Sunday Lake, WA Map & Demographics
Sunday Lake Map
Sunday Lake Overview
$59,338
PER CAPITA INCOME
$195,341
AVG FAMILY INCOME
0.43
INEQUALITY / GINI INDEX
1,166
TOTAL POPULATION
598
MALE POPULATION
568
FEMALE POPULATION
105.28
MALES / 100 FEMALES
94.98
FEMALES / 100 MALES
39.7
MEDIAN AGE
3.3
AVG FAMILY SIZE
3.0
AVG HOUSEHOLD SIZE
567
LABOR FORCE [ PEOPLE ]
67.8%
PERCENT IN LABOR FORCE
Income in Sunday Lake
Income Overview in Sunday Lake
| Characteristic | Number | Measure |
| Per Capita Income | 1,166 | $59,338 |
| Median Family Income | 329 | $195,341 |
| Mean Family Income | 329 | $196,536 |
| Median Household Income | 395 | $0 |
| Mean Household Income | 395 | $172,679 |
| Income Deficit | 329 | $0 |
| Wage / Income Gap (%) | 1,166 | 0.00% |
| Wage / Income Gap ($) | 1,166 | 100.00¢ per $1 |
| Gini / Inequality Index | 1,166 | 0.43 |
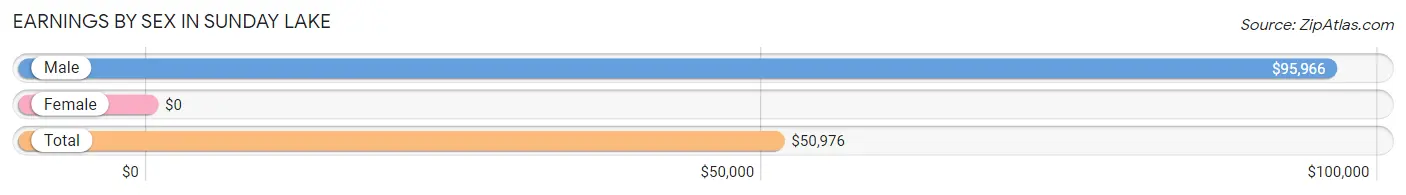
Earnings by Sex in Sunday Lake
| Sex | Number | Average Earnings |
| Male | 368 (61.3%) | $95,966 |
| Female | 232 (38.7%) | $0 |
| Total | 600 (100.0%) | $50,976 |
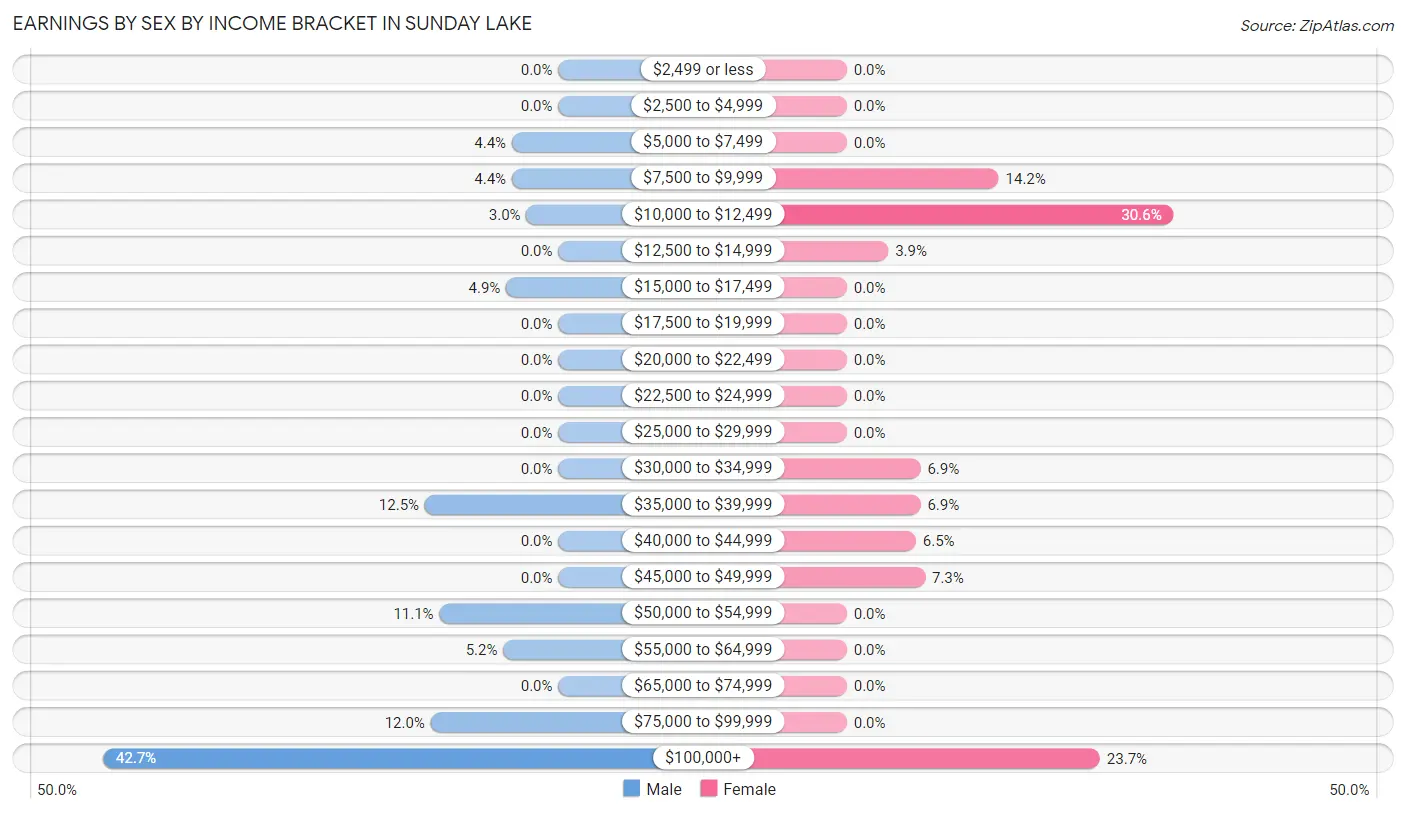
Earnings by Sex by Income Bracket in Sunday Lake
The most common earnings brackets in Sunday Lake are $100,000+ for men (157 | 42.7%) and $10,000 to $12,499 for women (71 | 30.6%).
| Income | Male | Female |
| $2,499 or less | 0 (0.0%) | 0 (0.0%) |
| $2,500 to $4,999 | 0 (0.0%) | 0 (0.0%) |
| $5,000 to $7,499 | 16 (4.3%) | 0 (0.0%) |
| $7,500 to $9,999 | 16 (4.3%) | 33 (14.2%) |
| $10,000 to $12,499 | 11 (3.0%) | 71 (30.6%) |
| $12,500 to $14,999 | 0 (0.0%) | 9 (3.9%) |
| $15,000 to $17,499 | 18 (4.9%) | 0 (0.0%) |
| $17,500 to $19,999 | 0 (0.0%) | 0 (0.0%) |
| $20,000 to $22,499 | 0 (0.0%) | 0 (0.0%) |
| $22,500 to $24,999 | 0 (0.0%) | 0 (0.0%) |
| $25,000 to $29,999 | 0 (0.0%) | 0 (0.0%) |
| $30,000 to $34,999 | 0 (0.0%) | 16 (6.9%) |
| $35,000 to $39,999 | 46 (12.5%) | 16 (6.9%) |
| $40,000 to $44,999 | 0 (0.0%) | 15 (6.5%) |
| $45,000 to $49,999 | 0 (0.0%) | 17 (7.3%) |
| $50,000 to $54,999 | 41 (11.1%) | 0 (0.0%) |
| $55,000 to $64,999 | 19 (5.2%) | 0 (0.0%) |
| $65,000 to $74,999 | 0 (0.0%) | 0 (0.0%) |
| $75,000 to $99,999 | 44 (12.0%) | 0 (0.0%) |
| $100,000+ | 157 (42.7%) | 55 (23.7%) |
| Total | 368 (100.0%) | 232 (100.0%) |
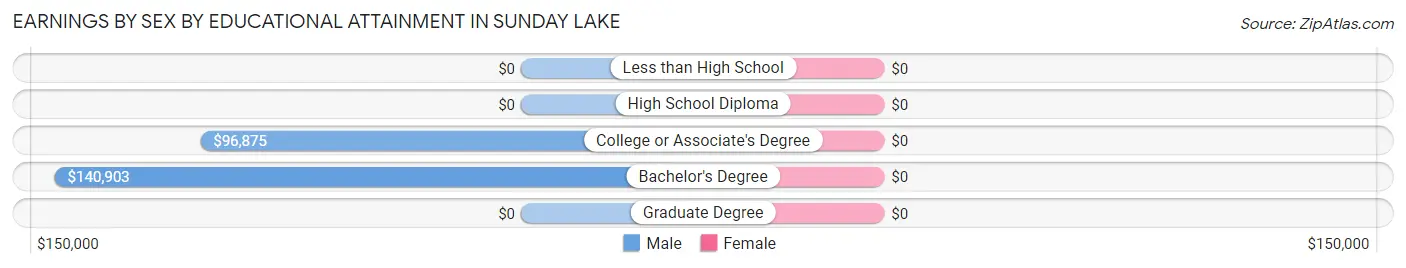
Earnings by Sex by Educational Attainment in Sunday Lake
| Educational Attainment | Male Income | Female Income |
| Less than High School | - | - |
| High School Diploma | - | - |
| College or Associate's Degree | $96,875 | $0 |
| Bachelor's Degree | $140,903 | $0 |
| Graduate Degree | - | - |
| Total | $108,047 | $39,453 |
Family Income in Sunday Lake
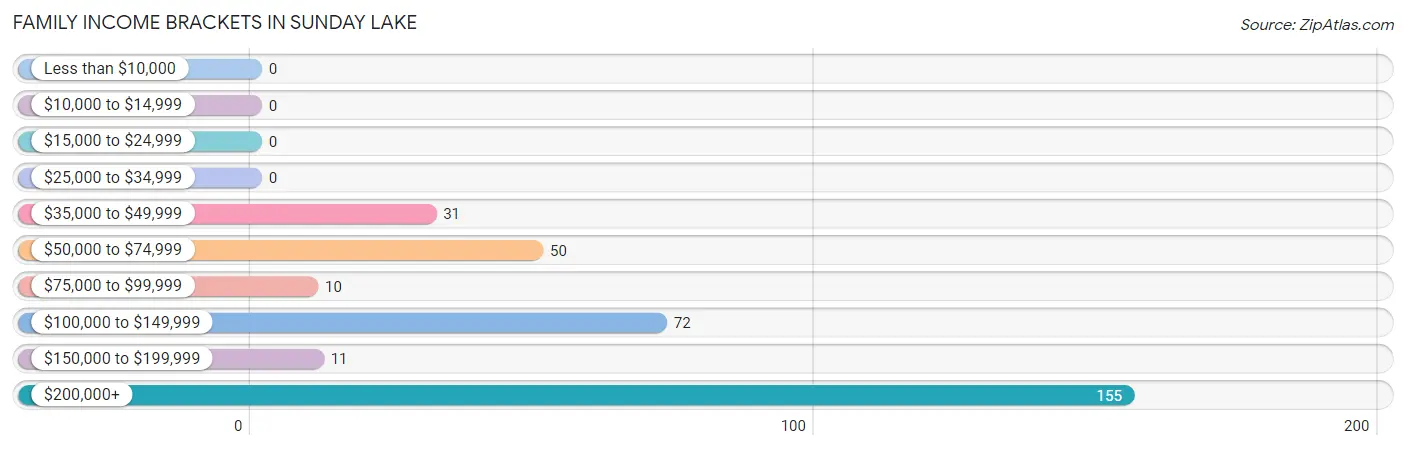
Family Income Brackets in Sunday Lake
According to the Sunday Lake family income data, there are 155 families falling into the $200,000+ income range, which is the most common income bracket and makes up 47.1% of all families.
| Income Bracket | # Families | % Families |
| Less than $10,000 | 0 | 0.0% |
| $10,000 to $14,999 | 0 | 0.0% |
| $15,000 to $24,999 | 0 | 0.0% |
| $25,000 to $34,999 | 0 | 0.0% |
| $35,000 to $49,999 | 31 | 9.4% |
| $50,000 to $74,999 | 50 | 15.2% |
| $75,000 to $99,999 | 10 | 3.0% |
| $100,000 to $149,999 | 72 | 21.9% |
| $150,000 to $199,999 | 11 | 3.3% |
| $200,000+ | 155 | 47.1% |
Family Income by Famaliy Size in Sunday Lake
| Income Bracket | # Families | Median Income |
| 2-Person Families | 173 (52.6%) | $0 |
| 3-Person Families | 33 (10.0%) | $0 |
| 4-Person Families | 43 (13.1%) | $0 |
| 5-Person Families | 42 (12.8%) | $0 |
| 6-Person Families | 38 (11.6%) | $0 |
| 7+ Person Families | 0 (0.0%) | $0 |
| Total | 329 (100.0%) | $195,341 |
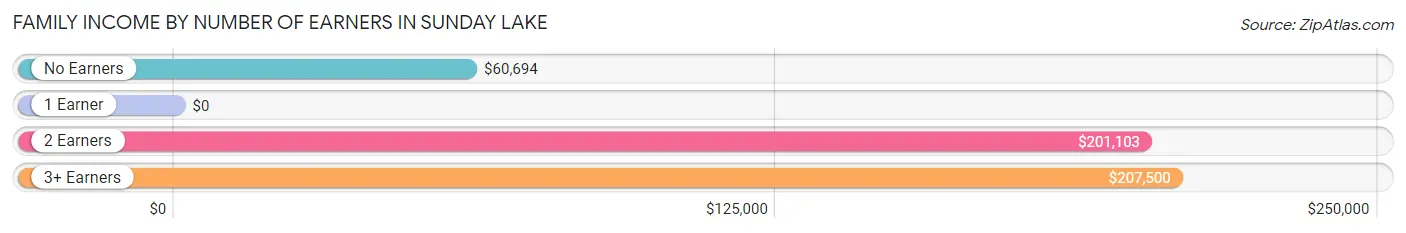
Family Income by Number of Earners in Sunday Lake
| Number of Earners | # Families | Median Income |
| No Earners | 33 (10.0%) | $60,694 |
| 1 Earner | 111 (33.7%) | $0 |
| 2 Earners | 131 (39.8%) | $201,103 |
| 3+ Earners | 54 (16.4%) | $207,500 |
| Total | 329 (100.0%) | $195,341 |
Household Income in Sunday Lake
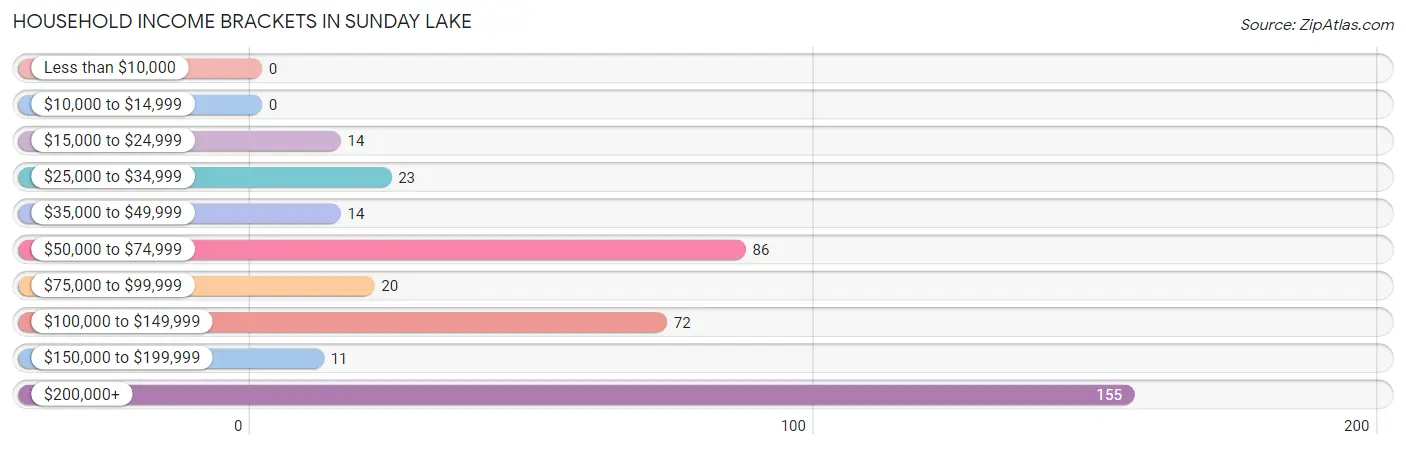
Household Income Brackets in Sunday Lake
With 155 households falling in the category, the $200,000+ income range is the most frequent in Sunday Lake, accounting for 39.2% of all households.
| Income Bracket | # Households | % Households |
| Less than $10,000 | 0 | 0.0% |
| $10,000 to $14,999 | 0 | 0.0% |
| $15,000 to $24,999 | 14 | 3.5% |
| $25,000 to $34,999 | 23 | 5.8% |
| $35,000 to $49,999 | 14 | 3.5% |
| $50,000 to $74,999 | 86 | 21.8% |
| $75,000 to $99,999 | 20 | 5.1% |
| $100,000 to $149,999 | 72 | 18.2% |
| $150,000 to $199,999 | 11 | 2.8% |
| $200,000+ | 155 | 39.2% |
Household Income by Householder Age in Sunday Lake
The median household income in Sunday Lake is $0, with the highest median household income of $207,176 found in the 45 to 64 years age bracket for the primary householder. A total of 119 households (30.1%) fall into this category.
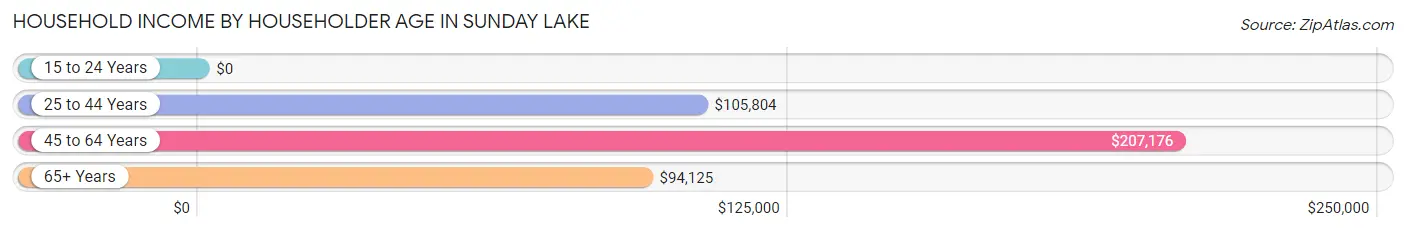
| Income Bracket | # Households | Median Income |
| 15 to 24 Years | 0 (0.0%) | $0 |
| 25 to 44 Years | 143 (36.2%) | $105,804 |
| 45 to 64 Years | 119 (30.1%) | $207,176 |
| 65+ Years | 133 (33.7%) | $94,125 |
| Total | 395 (100.0%) | $0 |
Poverty in Sunday Lake
Income Below Poverty by Sex and Age in Sunday Lake
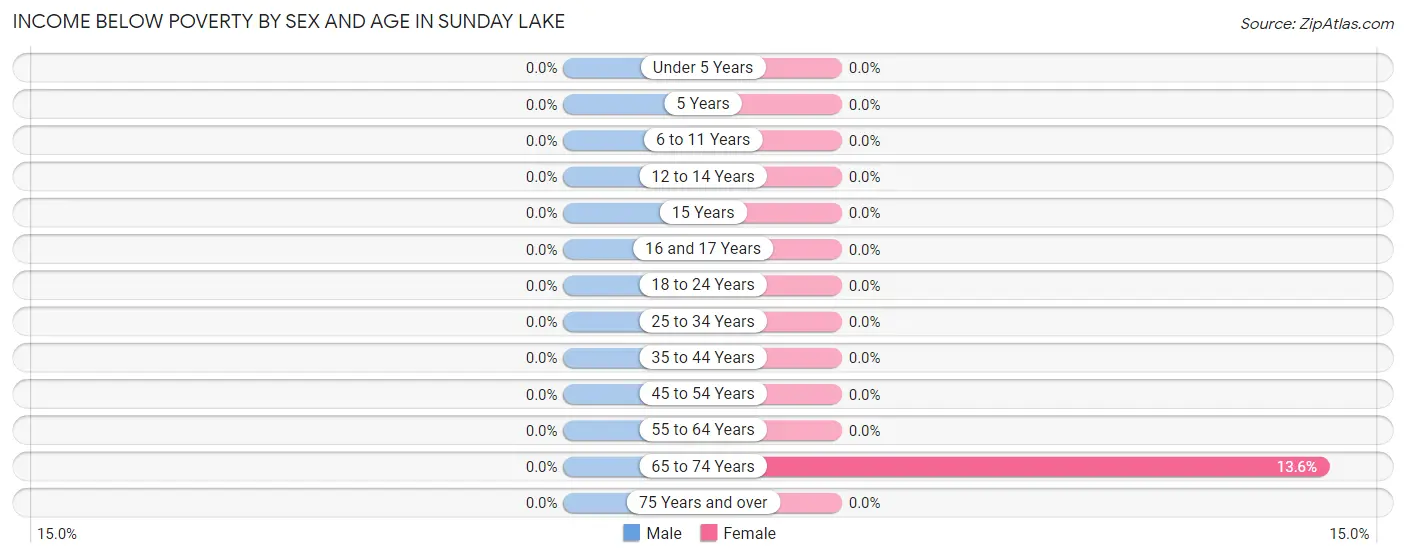
| Age Bracket | Male | Female |
| Under 5 Years | 0 (0.0%) | 0 (0.0%) |
| 5 Years | 0 (0.0%) | 0 (0.0%) |
| 6 to 11 Years | 0 (0.0%) | 0 (0.0%) |
| 12 to 14 Years | 0 (0.0%) | 0 (0.0%) |
| 15 Years | 0 (0.0%) | 0 (0.0%) |
| 16 and 17 Years | 0 (0.0%) | 0 (0.0%) |
| 18 to 24 Years | 0 (0.0%) | 0 (0.0%) |
| 25 to 34 Years | 0 (0.0%) | 0 (0.0%) |
| 35 to 44 Years | 0 (0.0%) | 0 (0.0%) |
| 45 to 54 Years | 0 (0.0%) | 0 (0.0%) |
| 55 to 64 Years | 0 (0.0%) | 0 (0.0%) |
| 65 to 74 Years | 0 (0.0%) | 8 (13.6%) |
| 75 Years and over | 0 (0.0%) | 0 (0.0%) |
| Total | 0 (0.0%) | 8 (1.4%) |
Income Above Poverty by Sex and Age in Sunday Lake
According to the poverty statistics in Sunday Lake, males aged under 5 years and females aged under 5 years are the age groups that are most secure financially, with 100.0% of males and 100.0% of females in these age groups living above the poverty line.
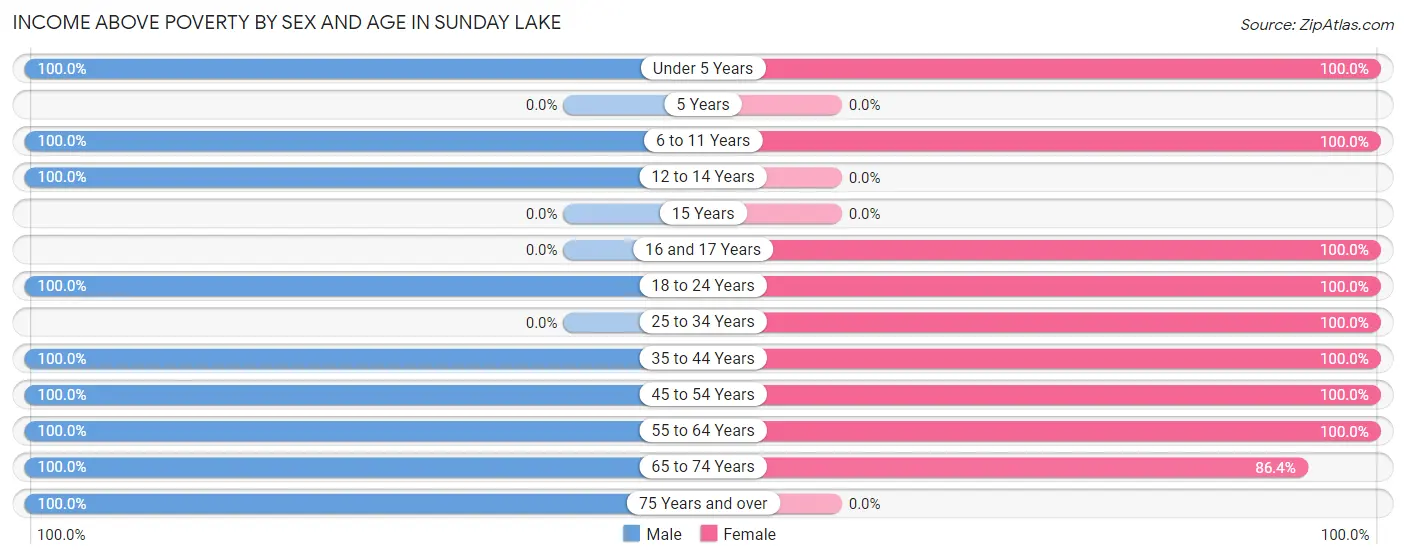
| Age Bracket | Male | Female |
| Under 5 Years | 65 (100.0%) | 68 (100.0%) |
| 5 Years | 0 (0.0%) | 0 (0.0%) |
| 6 to 11 Years | 39 (100.0%) | 119 (100.0%) |
| 12 to 14 Years | 39 (100.0%) | 0 (0.0%) |
| 15 Years | 0 (0.0%) | 0 (0.0%) |
| 16 and 17 Years | 0 (0.0%) | 22 (100.0%) |
| 18 to 24 Years | 61 (100.0%) | 29 (100.0%) |
| 25 to 34 Years | 0 (0.0%) | 27 (100.0%) |
| 35 to 44 Years | 164 (100.0%) | 126 (100.0%) |
| 45 to 54 Years | 44 (100.0%) | 31 (100.0%) |
| 55 to 64 Years | 77 (100.0%) | 87 (100.0%) |
| 65 to 74 Years | 67 (100.0%) | 51 (86.4%) |
| 75 Years and over | 42 (100.0%) | 0 (0.0%) |
| Total | 598 (100.0%) | 560 (98.6%) |
Income Below Poverty Among Married-Couple Families in Sunday Lake
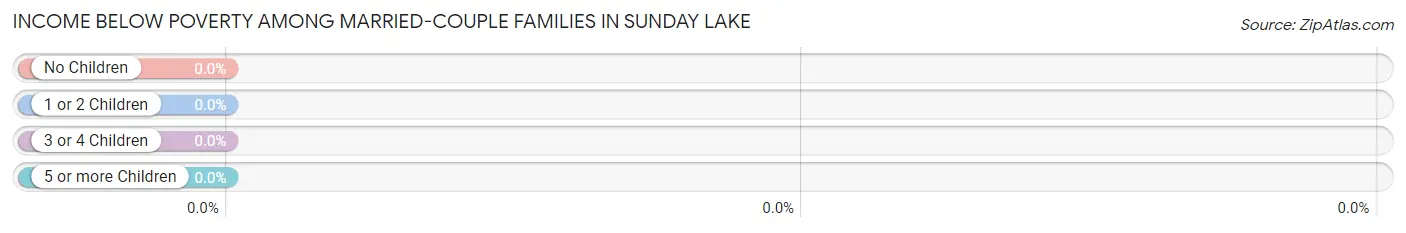
| Children | Above Poverty | Below Poverty |
| No Children | 134 (100.0%) | 0 (0.0%) |
| 1 or 2 Children | 81 (100.0%) | 0 (0.0%) |
| 3 or 4 Children | 42 (100.0%) | 0 (0.0%) |
| 5 or more Children | 0 (0.0%) | 0 (0.0%) |
| Total | 257 (100.0%) | 0 (0.0%) |
Income Below Poverty Among Single-Parent Households in Sunday Lake
| Children | Single Father | Single Mother |
| No Children | 0 (0.0%) | 0 (0.0%) |
| 1 or 2 Children | 0 (0.0%) | 0 (0.0%) |
| 3 or 4 Children | 0 (0.0%) | 0 (0.0%) |
| 5 or more Children | 0 (0.0%) | 0 (0.0%) |
| Total | 0 (0.0%) | 0 (0.0%) |
Income Below Poverty Among Married-Couple vs Single-Parent Households in Sunday Lake
| Children | Married-Couple Families | Single-Parent Households |
| No Children | 0 (0.0%) | 0 (0.0%) |
| 1 or 2 Children | 0 (0.0%) | 0 (0.0%) |
| 3 or 4 Children | 0 (0.0%) | 0 (0.0%) |
| 5 or more Children | 0 (0.0%) | 0 (0.0%) |
| Total | 0 (0.0%) | 0 (0.0%) |
Race in Sunday Lake
The most populous races in Sunday Lake are White / Caucasian (998 | 85.6%), Hispanic or Latino (182 | 15.6%), and Two or more Races (115 | 9.9%).
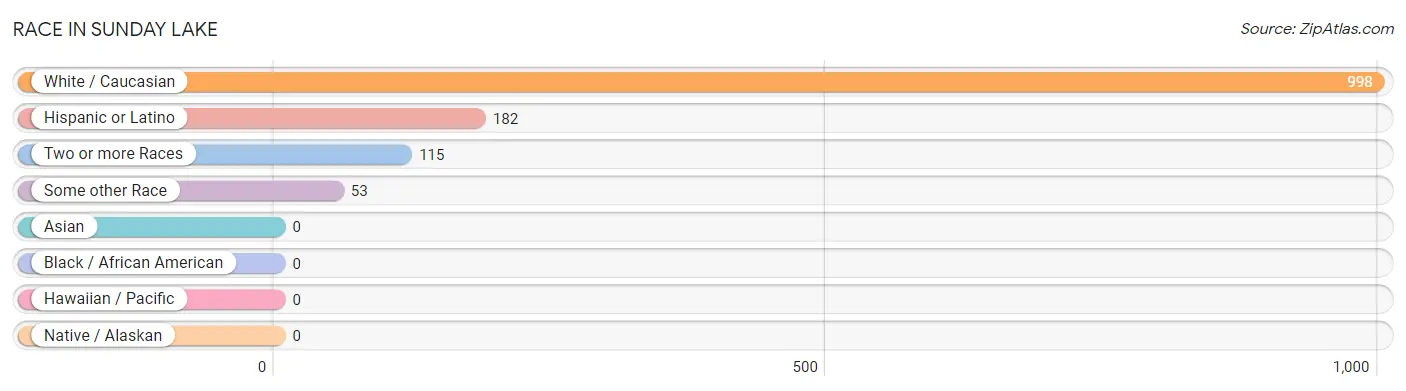
| Race | # Population | % Population |
| Asian | 0 | 0.0% |
| Black / African American | 0 | 0.0% |
| Hawaiian / Pacific | 0 | 0.0% |
| Hispanic or Latino | 182 | 15.6% |
| Native / Alaskan | 0 | 0.0% |
| White / Caucasian | 998 | 85.6% |
| Two or more Races | 115 | 9.9% |
| Some other Race | 53 | 4.5% |
| Total | 1,166 | 100.0% |
Ancestry in Sunday Lake
The most populous ancestries reported in Sunday Lake are Norwegian (361 | 31.0%), Swedish (211 | 18.1%), German (151 | 13.0%), English (125 | 10.7%), and European (123 | 10.5%), together accounting for 83.3% of all Sunday Lake residents.
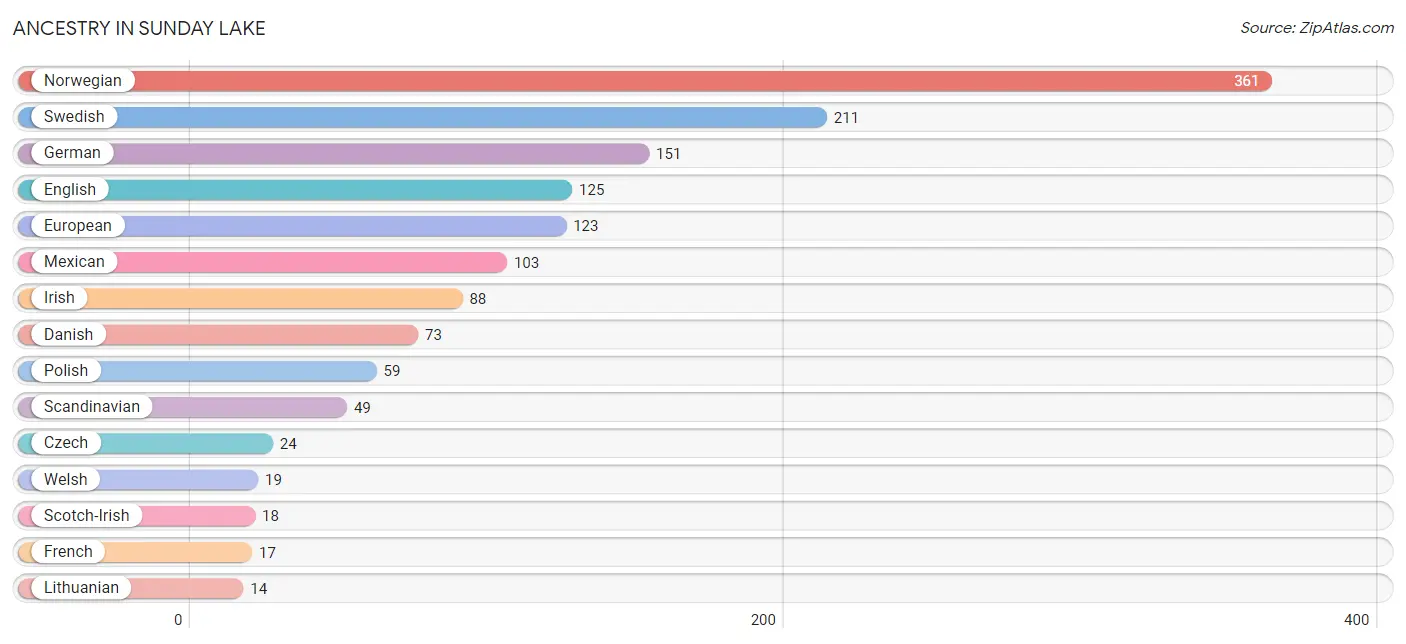
| Ancestry | # Population | % Population |
| Czech | 24 | 2.1% |
| Danish | 73 | 6.3% |
| Dutch | 10 | 0.9% |
| English | 125 | 10.7% |
| European | 123 | 10.5% |
| French | 17 | 1.5% |
| French Canadian | 12 | 1.0% |
| German | 151 | 13.0% |
| Irish | 88 | 7.5% |
| Lithuanian | 14 | 1.2% |
| Mexican | 103 | 8.8% |
| Norwegian | 361 | 31.0% |
| Polish | 59 | 5.1% |
| Scandinavian | 49 | 4.2% |
| Scotch-Irish | 18 | 1.5% |
| Scottish | 8 | 0.7% |
| Slovak | 8 | 0.7% |
| Slovene | 10 | 0.9% |
| Swedish | 211 | 18.1% |
| Welsh | 19 | 1.6% | View All 20 Rows |
Immigrants in Sunday Lake
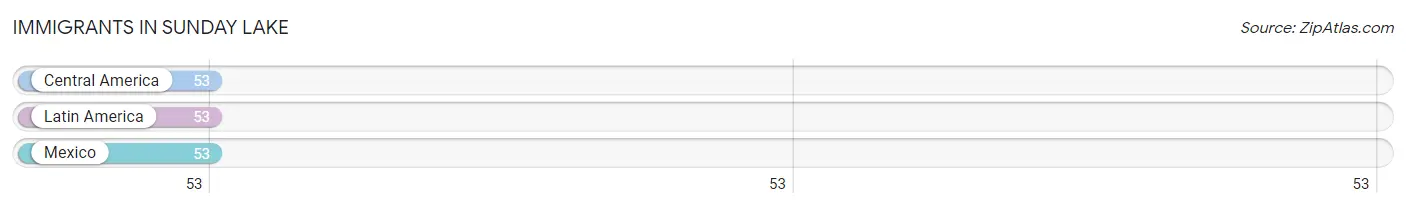
The most numerous immigrant groups reported in Sunday Lake came from Central America (53 | 4.5%), Latin America (53 | 4.5%), and Mexico (53 | 4.5%), together accounting for 13.7% of all Sunday Lake residents.
| Immigration Origin | # Population | % Population |
| Central America | 53 | 4.5% |
| Latin America | 53 | 4.5% |
| Mexico | 53 | 4.5% | View All 3 Rows |
Sex and Age in Sunday Lake
Sex and Age in Sunday Lake
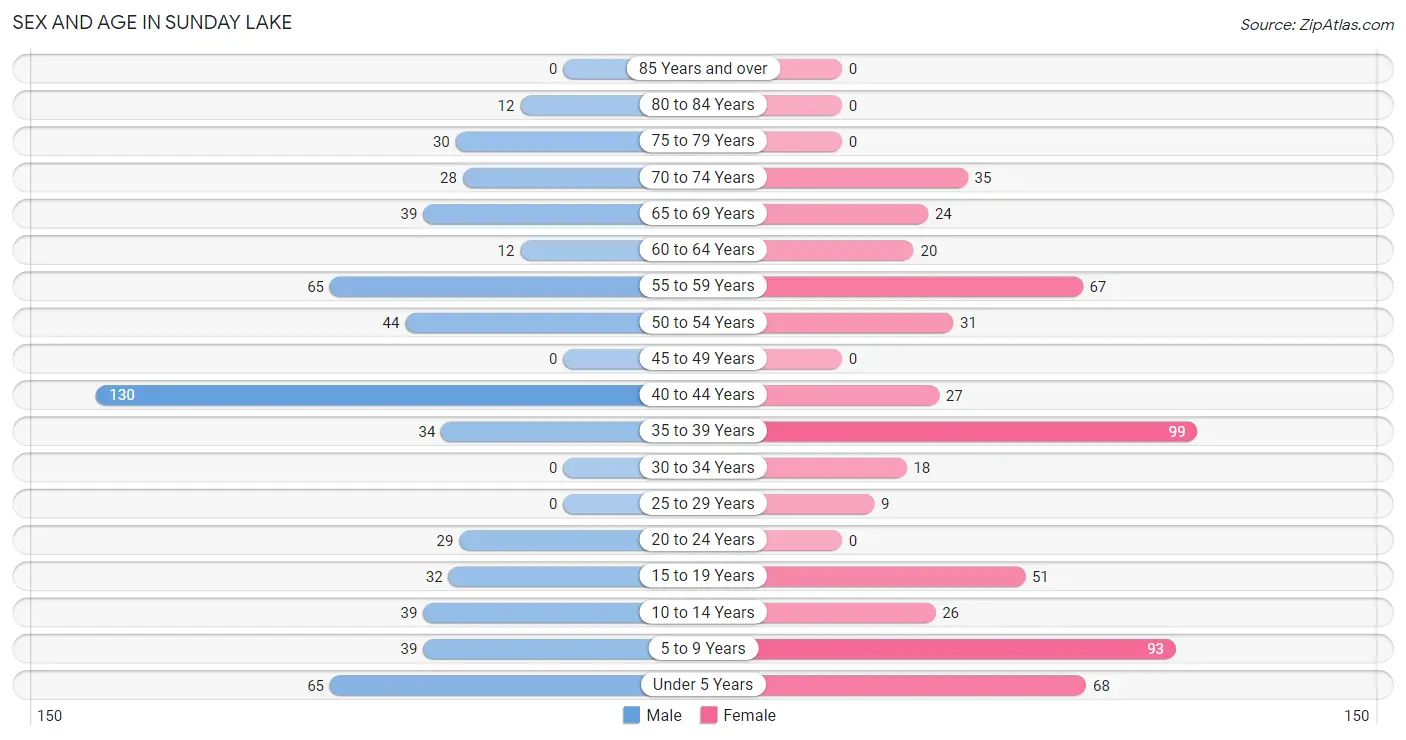
The most populous age groups in Sunday Lake are 40 to 44 Years (130 | 21.7%) for men and 35 to 39 Years (99 | 17.4%) for women.
| Age Bracket | Male | Female |
| Under 5 Years | 65 (10.9%) | 68 (12.0%) |
| 5 to 9 Years | 39 (6.5%) | 93 (16.4%) |
| 10 to 14 Years | 39 (6.5%) | 26 (4.6%) |
| 15 to 19 Years | 32 (5.3%) | 51 (9.0%) |
| 20 to 24 Years | 29 (4.9%) | 0 (0.0%) |
| 25 to 29 Years | 0 (0.0%) | 9 (1.6%) |
| 30 to 34 Years | 0 (0.0%) | 18 (3.2%) |
| 35 to 39 Years | 34 (5.7%) | 99 (17.4%) |
| 40 to 44 Years | 130 (21.7%) | 27 (4.8%) |
| 45 to 49 Years | 0 (0.0%) | 0 (0.0%) |
| 50 to 54 Years | 44 (7.4%) | 31 (5.5%) |
| 55 to 59 Years | 65 (10.9%) | 67 (11.8%) |
| 60 to 64 Years | 12 (2.0%) | 20 (3.5%) |
| 65 to 69 Years | 39 (6.5%) | 24 (4.2%) |
| 70 to 74 Years | 28 (4.7%) | 35 (6.2%) |
| 75 to 79 Years | 30 (5.0%) | 0 (0.0%) |
| 80 to 84 Years | 12 (2.0%) | 0 (0.0%) |
| 85 Years and over | 0 (0.0%) | 0 (0.0%) |
| Total | 598 (100.0%) | 568 (100.0%) |
Families and Households in Sunday Lake
Median Family Size in Sunday Lake
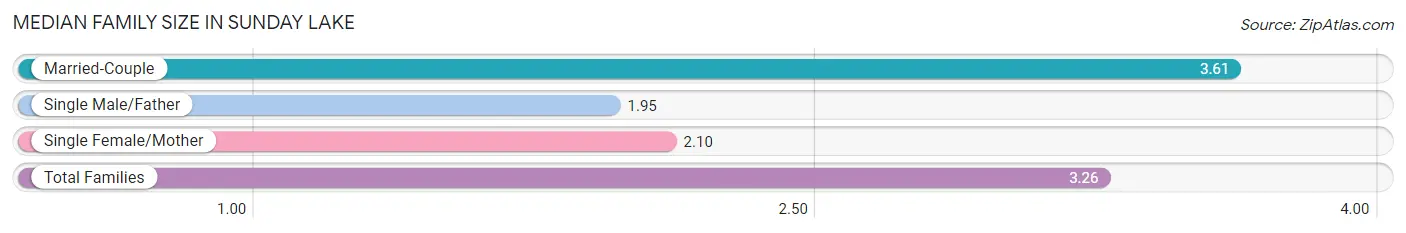
The median family size in Sunday Lake is 3.26 persons per family, with married-couple families (257 | 78.1%) accounting for the largest median family size of 3.61 persons per family. On the other hand, single male/father families (41 | 12.5%) represent the smallest median family size with 1.95 persons per family.
| Family Type | # Families | Family Size |
| Married-Couple | 257 (78.1%) | 3.61 |
| Single Male/Father | 41 (12.5%) | 1.95 |
| Single Female/Mother | 31 (9.4%) | 2.10 |
| Total Families | 329 (100.0%) | 3.26 |
Median Household Size in Sunday Lake
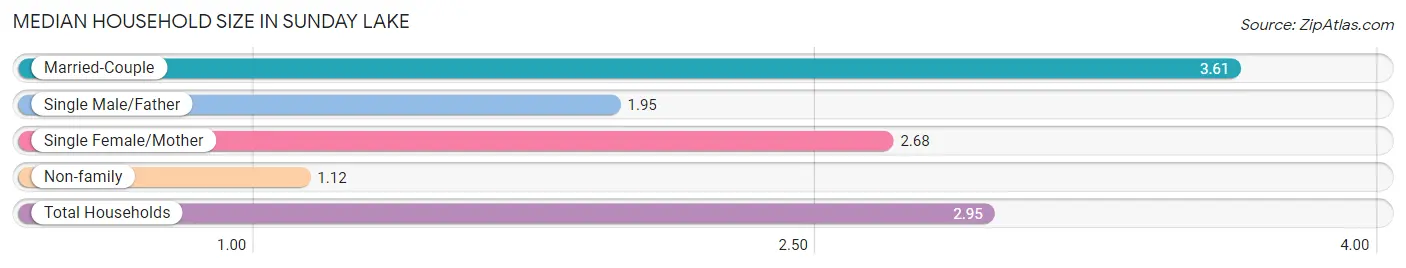
The median household size in Sunday Lake is 2.95 persons per household, with married-couple households (257 | 65.1%) accounting for the largest median household size of 3.61 persons per household. non-family households (66 | 16.7%) represent the smallest median household size with 1.12 persons per household.
| Household Type | # Households | Household Size |
| Married-Couple | 257 (65.1%) | 3.61 |
| Single Male/Father | 41 (10.4%) | 1.95 |
| Single Female/Mother | 31 (7.9%) | 2.68 |
| Non-family | 66 (16.7%) | 1.12 |
| Total Households | 395 (100.0%) | 2.95 |
Household Size by Marriage Status in Sunday Lake
Out of a total of 395 households in Sunday Lake, 329 (83.3%) are family households, while 66 (16.7%) are nonfamily households. The most numerous type of family households are 2-person households, comprising 156, and the most common type of nonfamily households are 1-person households, comprising 55.
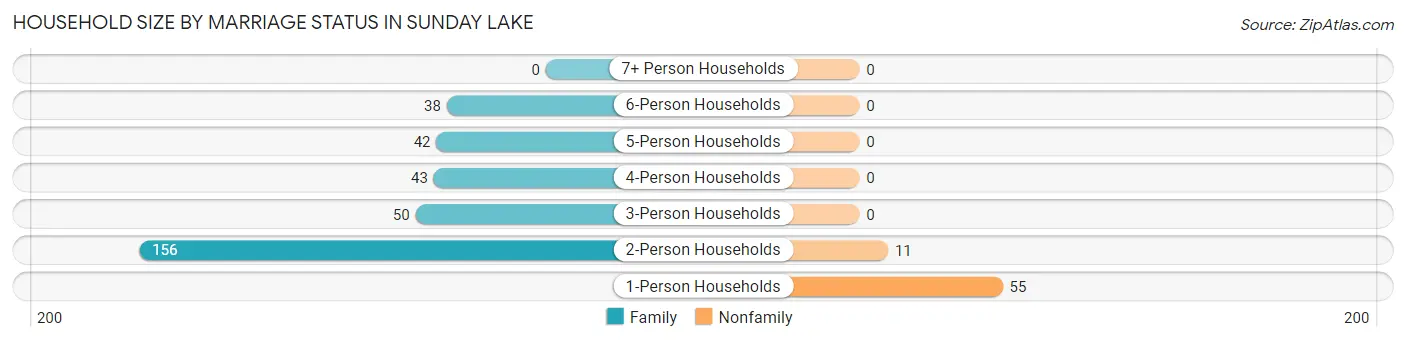
| Household Size | Family Households | Nonfamily Households |
| 1-Person Households | - | 55 (13.9%) |
| 2-Person Households | 156 (39.5%) | 11 (2.8%) |
| 3-Person Households | 50 (12.7%) | 0 (0.0%) |
| 4-Person Households | 43 (10.9%) | 0 (0.0%) |
| 5-Person Households | 42 (10.6%) | 0 (0.0%) |
| 6-Person Households | 38 (9.6%) | 0 (0.0%) |
| 7+ Person Households | 0 (0.0%) | 0 (0.0%) |
| Total | 329 (83.3%) | 66 (16.7%) |
Female Fertility in Sunday Lake
Fertility by Age in Sunday Lake
| Age Bracket | Women with Births | Births / 1,000 Women |
| 15 to 19 years | 0 (0.0%) | 0.0 |
| 20 to 34 years | 0 (0.0%) | 0.0 |
| 35 to 50 years | 0 (0.0%) | 0.0 |
| Total | 0 (0.0%) | 0.0 |
Fertility by Age by Marriage Status in Sunday Lake
| Age Bracket | Married | Unmarried |
| 15 to 19 years | 0 (0.0%) | 0 (0.0%) |
| 20 to 34 years | 0 (0.0%) | 0 (0.0%) |
| 35 to 50 years | 0 (0.0%) | 0 (0.0%) |
| Total | 0 (0.0%) | 0 (0.0%) |
Fertility by Education in Sunday Lake
| Educational Attainment | Women with Births | Births / 1,000 Women |
| Less than High School | 0 (0.0%) | 0.0 |
| High School Diploma | 0 (0.0%) | 0.0 |
| College or Associate's Degree | 0 (0.0%) | 0.0 |
| Bachelor's Degree | 0 (0.0%) | 0.0 |
| Graduate Degree | 0 (0.0%) | 0.0 |
| Total | 0 (0.0%) | 0.0 |
Fertility by Education by Marriage Status in Sunday Lake
| Educational Attainment | Married | Unmarried |
| Less than High School | 0 (0.0%) | 0 (0.0%) |
| High School Diploma | 0 (0.0%) | 0 (0.0%) |
| College or Associate's Degree | 0 (0.0%) | 0 (0.0%) |
| Bachelor's Degree | 0 (0.0%) | 0 (0.0%) |
| Graduate Degree | 0 (0.0%) | 0 (0.0%) |
| Total | 0 (0.0%) | 0 (0.0%) |
Employment Characteristics in Sunday Lake
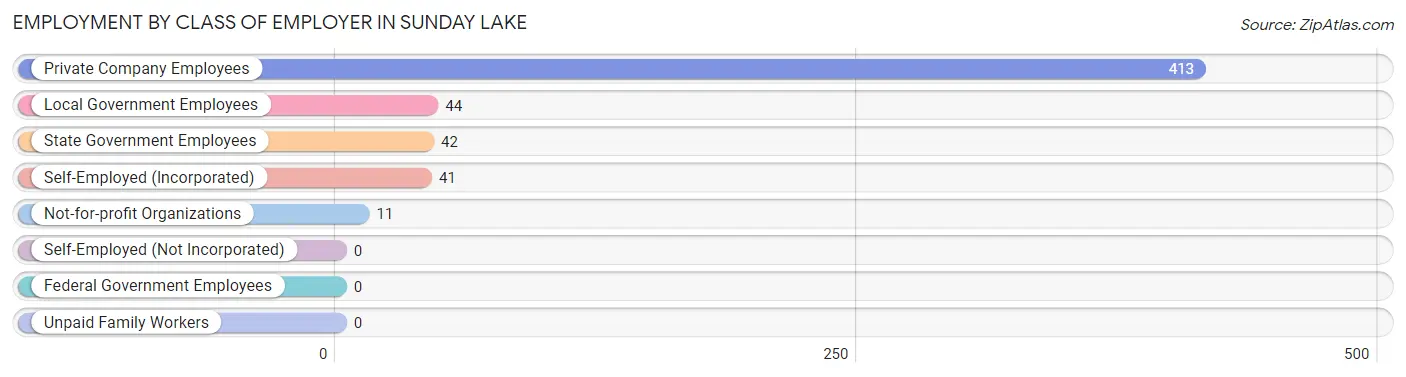
Employment by Class of Employer in Sunday Lake
Among the 551 employed individuals in Sunday Lake, private company employees (413 | 75.0%), local government employees (44 | 8.0%), and state government employees (42 | 7.6%) make up the most common classes of employment.
| Employer Class | # Employees | % Employees |
| Private Company Employees | 413 | 75.0% |
| Self-Employed (Incorporated) | 41 | 7.4% |
| Self-Employed (Not Incorporated) | 0 | 0.0% |
| Not-for-profit Organizations | 11 | 2.0% |
| Local Government Employees | 44 | 8.0% |
| State Government Employees | 42 | 7.6% |
| Federal Government Employees | 0 | 0.0% |
| Unpaid Family Workers | 0 | 0.0% |
| Total | 551 | 100.0% |
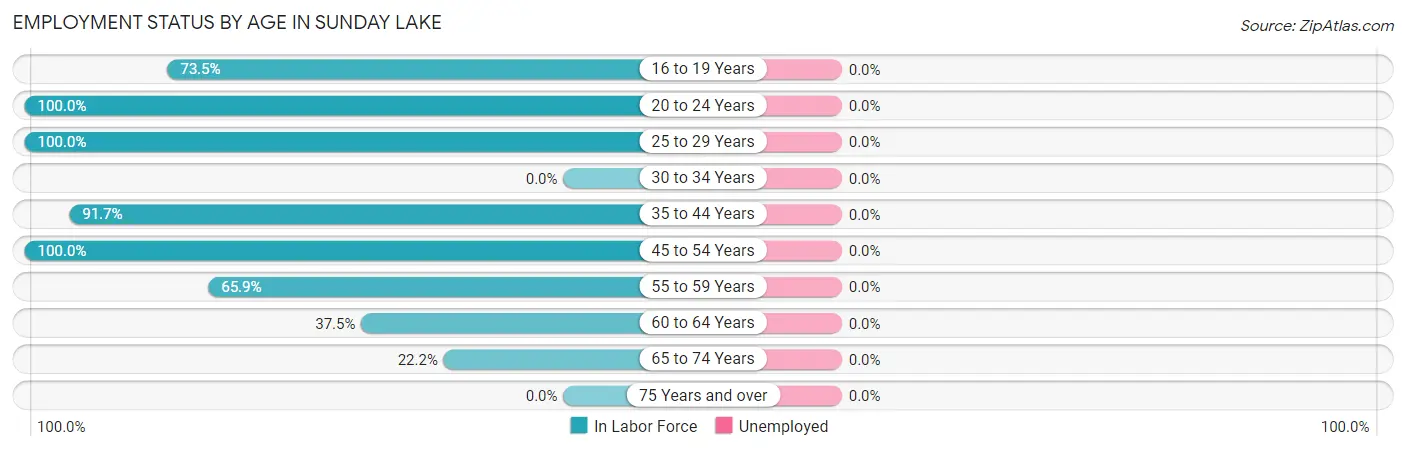
Employment Status by Age in Sunday Lake
| Age Bracket | In Labor Force | Unemployed |
| 16 to 19 Years | 61 (73.5%) | 0 (0.0%) |
| 20 to 24 Years | 29 (100.0%) | 0 (0.0%) |
| 25 to 29 Years | 9 (100.0%) | 0 (0.0%) |
| 30 to 34 Years | 0 (0.0%) | 0 (0.0%) |
| 35 to 44 Years | 266 (91.7%) | 0 (0.0%) |
| 45 to 54 Years | 75 (100.0%) | 0 (0.0%) |
| 55 to 59 Years | 87 (65.9%) | 0 (0.0%) |
| 60 to 64 Years | 12 (37.5%) | 0 (0.0%) |
| 65 to 74 Years | 28 (22.2%) | 0 (0.0%) |
| 75 Years and over | 0 (0.0%) | 0 (0.0%) |
| Total | 567 (67.8%) | 0 (0.0%) |
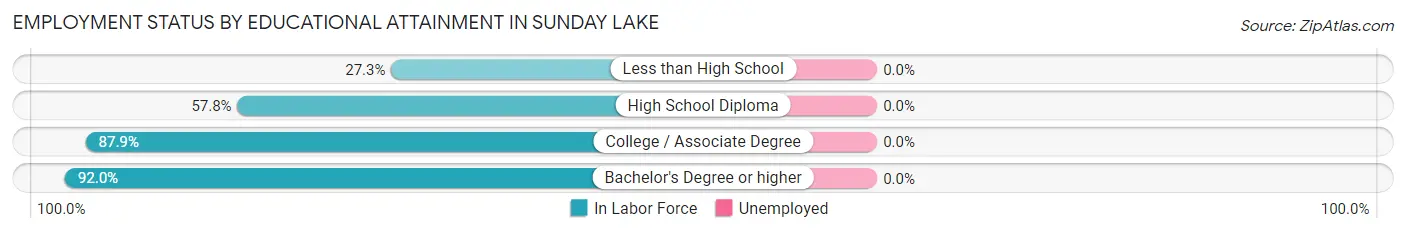
Employment Status by Educational Attainment in Sunday Lake
| Educational Attainment | In Labor Force | Unemployed |
| Less than High School | 9 (27.3%) | 0 (0.0%) |
| High School Diploma | 52 (57.8%) | 0 (0.0%) |
| College / Associate Degree | 226 (87.9%) | 0 (0.0%) |
| Bachelor's Degree or higher | 162 (92.0%) | 0 (0.0%) |
| Total | 449 (80.8%) | 0 (0.0%) |
Employment Occupations by Sex in Sunday Lake
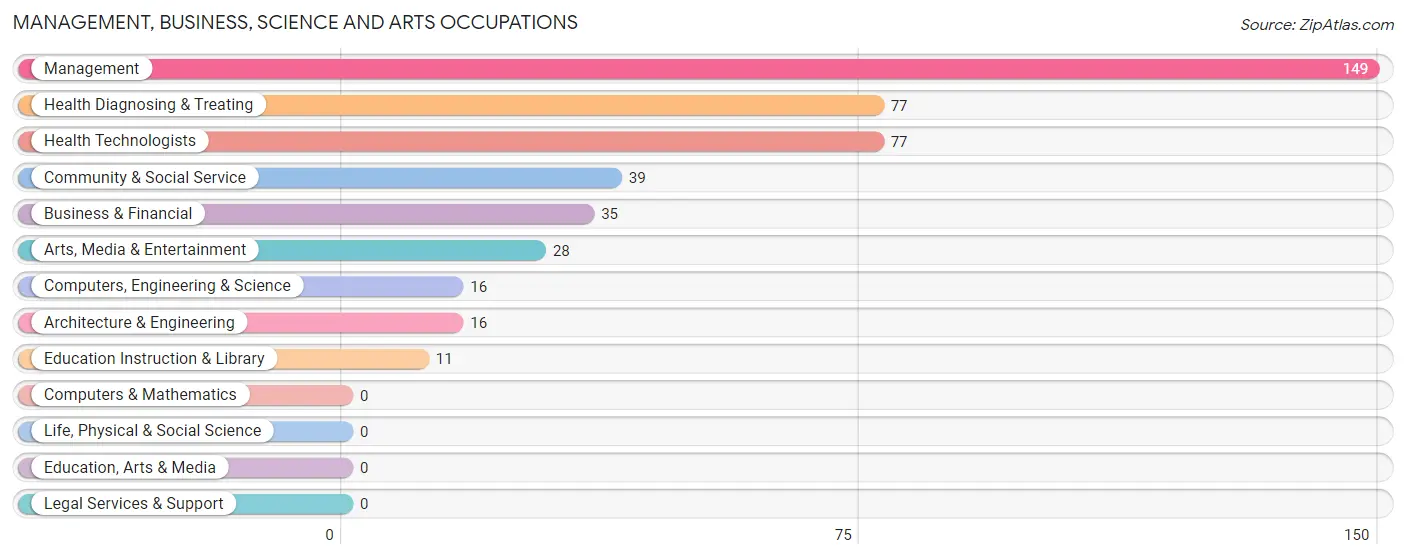
Management, Business, Science and Arts Occupations
The most common Management, Business, Science and Arts occupations in Sunday Lake are Management (149 | 26.3%), Health Diagnosing & Treating (77 | 13.6%), Health Technologists (77 | 13.6%), Community & Social Service (39 | 6.9%), and Business & Financial (35 | 6.2%).
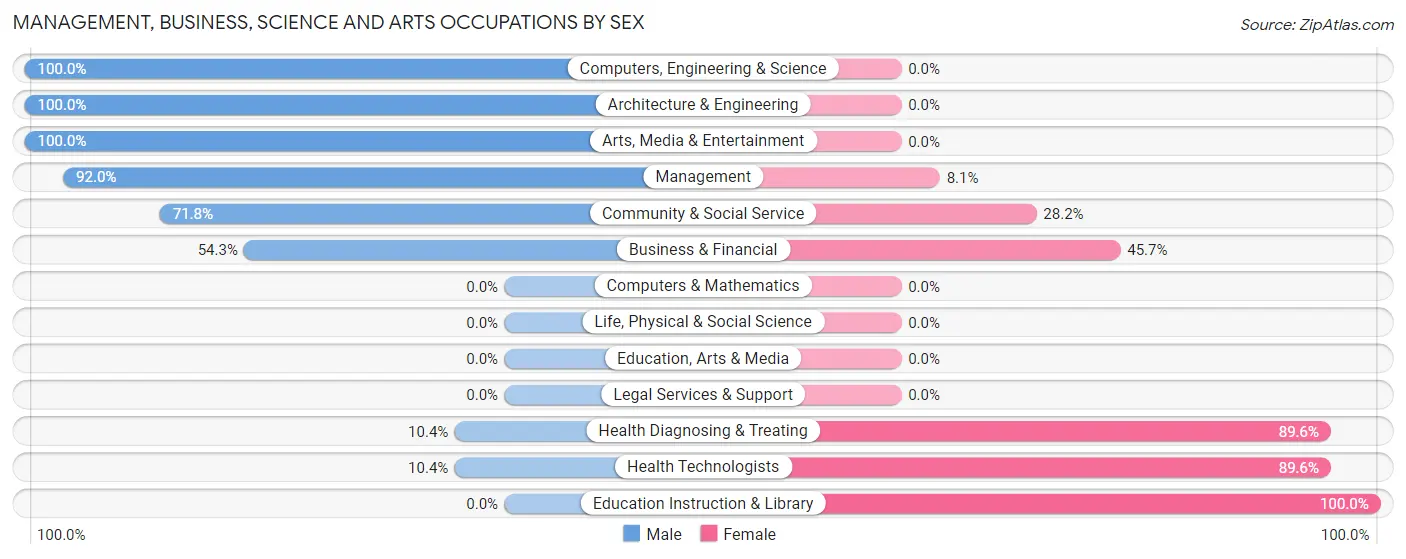
Management, Business, Science and Arts Occupations by Sex
Within the Management, Business, Science and Arts occupations in Sunday Lake, the most male-oriented occupations are Computers, Engineering & Science (100.0%), Architecture & Engineering (100.0%), and Arts, Media & Entertainment (100.0%), while the most female-oriented occupations are Education Instruction & Library (100.0%), Health Diagnosing & Treating (89.6%), and Health Technologists (89.6%).
| Occupation | Male | Female |
| Management | 137 (91.9%) | 12 (8.1%) |
| Business & Financial | 19 (54.3%) | 16 (45.7%) |
| Computers, Engineering & Science | 16 (100.0%) | 0 (0.0%) |
| Computers & Mathematics | 0 (0.0%) | 0 (0.0%) |
| Architecture & Engineering | 16 (100.0%) | 0 (0.0%) |
| Life, Physical & Social Science | 0 (0.0%) | 0 (0.0%) |
| Community & Social Service | 28 (71.8%) | 11 (28.2%) |
| Education, Arts & Media | 0 (0.0%) | 0 (0.0%) |
| Legal Services & Support | 0 (0.0%) | 0 (0.0%) |
| Education Instruction & Library | 0 (0.0%) | 11 (100.0%) |
| Arts, Media & Entertainment | 28 (100.0%) | 0 (0.0%) |
| Health Diagnosing & Treating | 8 (10.4%) | 69 (89.6%) |
| Health Technologists | 8 (10.4%) | 69 (89.6%) |
| Total (Category) | 208 (65.8%) | 108 (34.2%) |
| Total (Overall) | 357 (63.0%) | 210 (37.0%) |
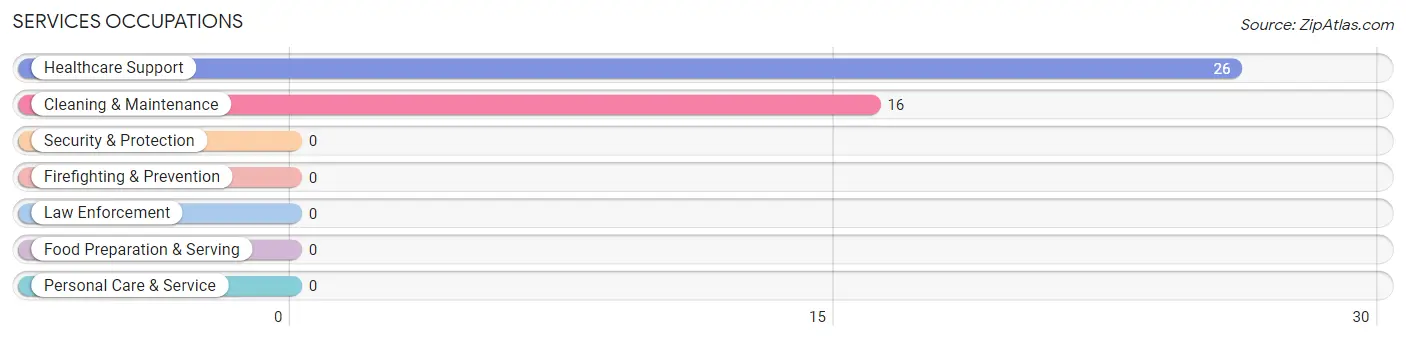
Services Occupations
The most common Services occupations in Sunday Lake are Healthcare Support (26 | 4.6%), and Cleaning & Maintenance (16 | 2.8%).
Services Occupations by Sex
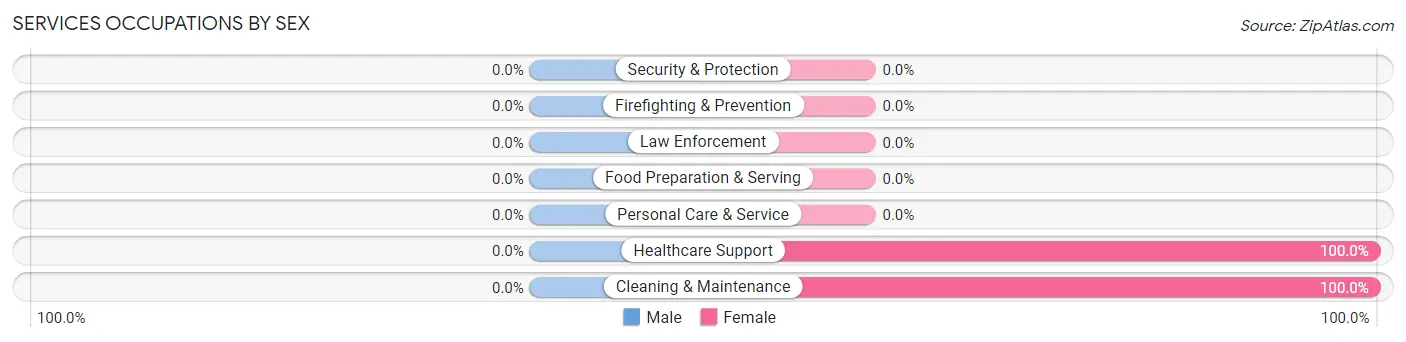
| Occupation | Male | Female |
| Healthcare Support | 0 (0.0%) | 26 (100.0%) |
| Security & Protection | 0 (0.0%) | 0 (0.0%) |
| Firefighting & Prevention | 0 (0.0%) | 0 (0.0%) |
| Law Enforcement | 0 (0.0%) | 0 (0.0%) |
| Food Preparation & Serving | 0 (0.0%) | 0 (0.0%) |
| Cleaning & Maintenance | 0 (0.0%) | 16 (100.0%) |
| Personal Care & Service | 0 (0.0%) | 0 (0.0%) |
| Total (Category) | 0 (0.0%) | 42 (100.0%) |
| Total (Overall) | 357 (63.0%) | 210 (37.0%) |
Sales and Office Occupations
The most common Sales and Office occupations in Sunday Lake are Sales & Related (101 | 17.8%), and Office & Administration (28 | 4.9%).
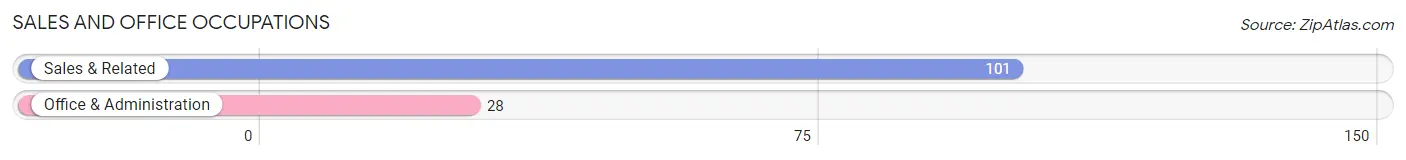
Sales and Office Occupations by Sex
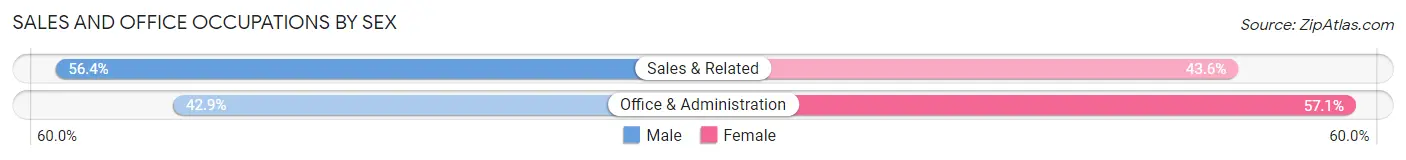
| Occupation | Male | Female |
| Sales & Related | 57 (56.4%) | 44 (43.6%) |
| Office & Administration | 12 (42.9%) | 16 (57.1%) |
| Total (Category) | 69 (53.5%) | 60 (46.5%) |
| Total (Overall) | 357 (63.0%) | 210 (37.0%) |
Natural Resources, Construction and Maintenance Occupations
The most common Natural Resources, Construction and Maintenance occupations in Sunday Lake are , and Construction & Extraction (45 | 7.9%).
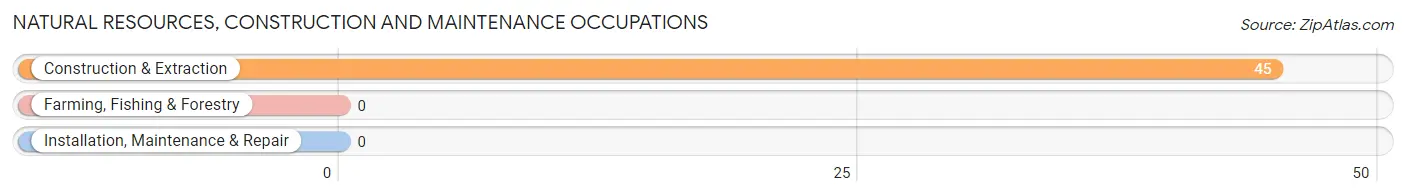
Natural Resources, Construction and Maintenance Occupations by Sex
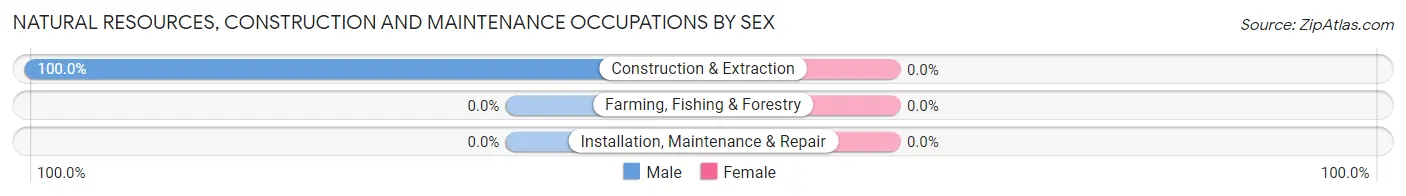
| Occupation | Male | Female |
| Farming, Fishing & Forestry | 0 (0.0%) | 0 (0.0%) |
| Construction & Extraction | 45 (100.0%) | 0 (0.0%) |
| Installation, Maintenance & Repair | 0 (0.0%) | 0 (0.0%) |
| Total (Category) | 45 (100.0%) | 0 (0.0%) |
| Total (Overall) | 357 (63.0%) | 210 (37.0%) |
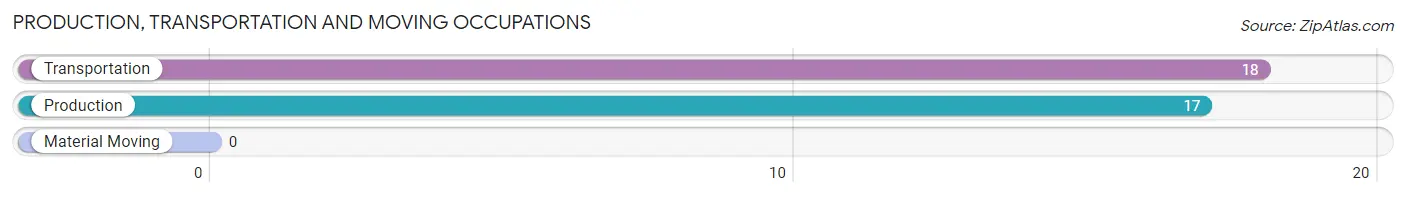
Production, Transportation and Moving Occupations
The most common Production, Transportation and Moving occupations in Sunday Lake are Transportation (18 | 3.2%), and Production (17 | 3.0%).
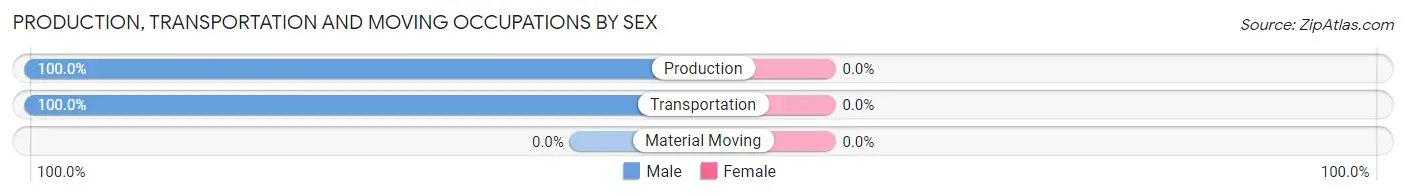
Production, Transportation and Moving Occupations by Sex
| Occupation | Male | Female |
| Production | 17 (100.0%) | 0 (0.0%) |
| Transportation | 18 (100.0%) | 0 (0.0%) |
| Material Moving | 0 (0.0%) | 0 (0.0%) |
| Total (Category) | 35 (100.0%) | 0 (0.0%) |
| Total (Overall) | 357 (63.0%) | 210 (37.0%) |
Employment Industries by Sex in Sunday Lake
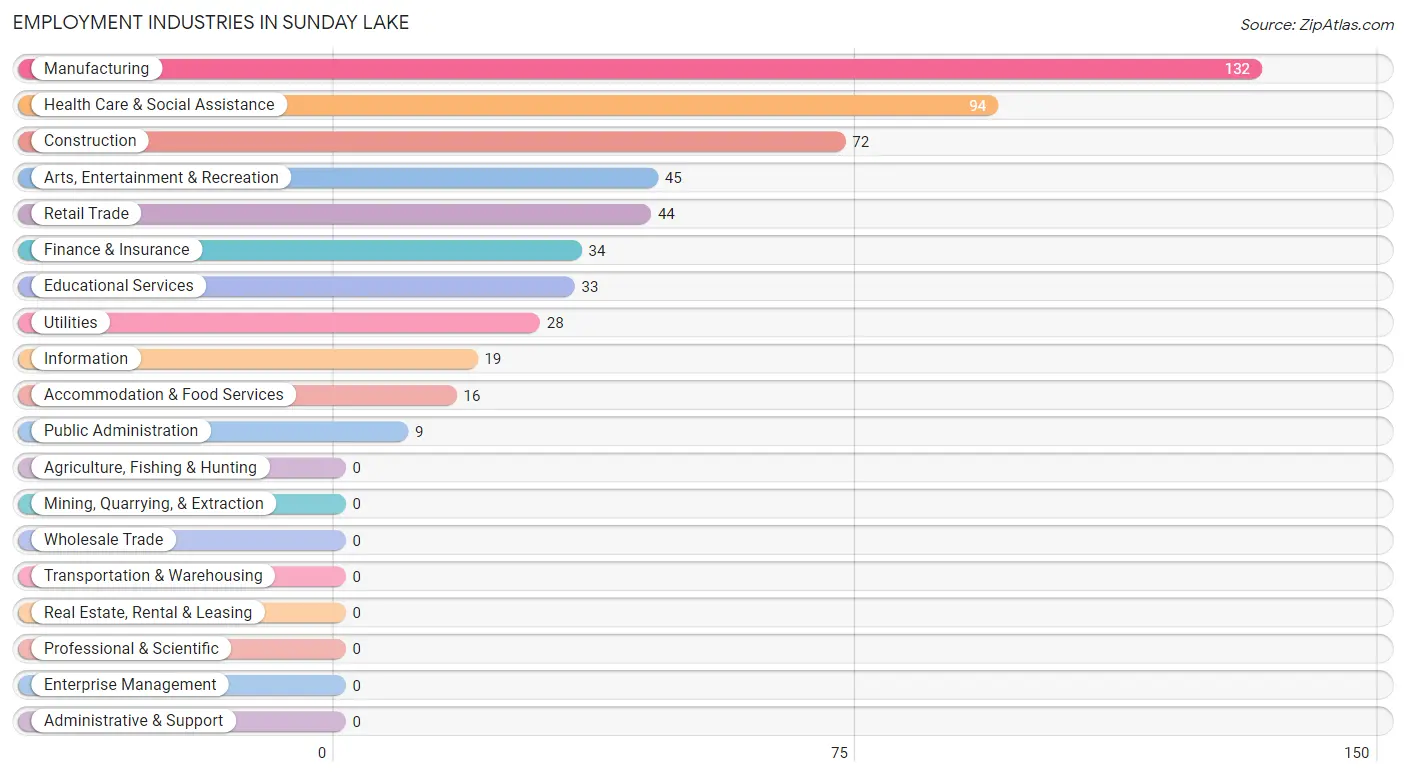
Employment Industries in Sunday Lake
The major employment industries in Sunday Lake include Manufacturing (132 | 23.3%), Health Care & Social Assistance (94 | 16.6%), Construction (72 | 12.7%), Arts, Entertainment & Recreation (45 | 7.9%), and Retail Trade (44 | 7.8%).
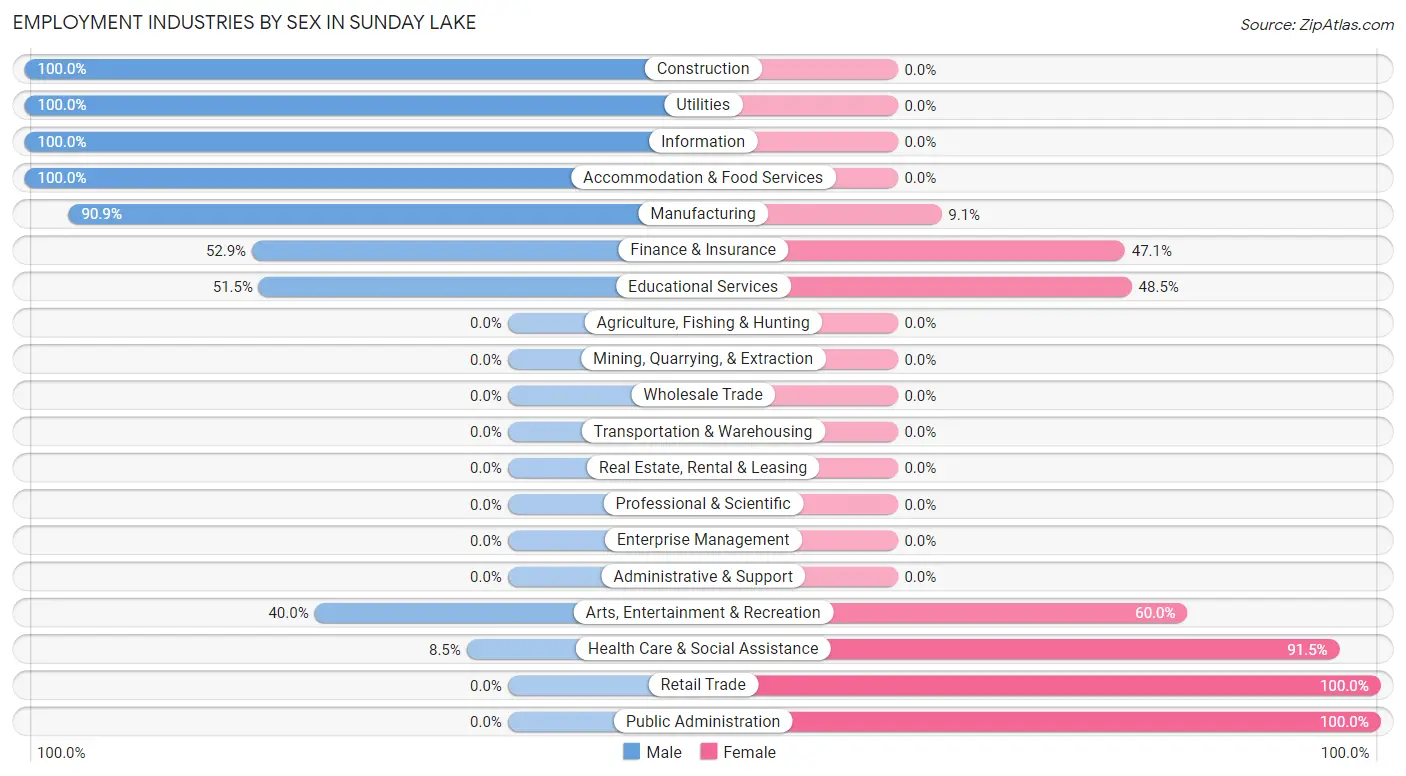
Employment Industries by Sex in Sunday Lake
The Sunday Lake industries that see more men than women are Construction (100.0%), Utilities (100.0%), and Information (100.0%), whereas the industries that tend to have a higher number of women are Retail Trade (100.0%), Public Administration (100.0%), and Health Care & Social Assistance (91.5%).
| Industry | Male | Female |
| Agriculture, Fishing & Hunting | 0 (0.0%) | 0 (0.0%) |
| Mining, Quarrying, & Extraction | 0 (0.0%) | 0 (0.0%) |
| Construction | 72 (100.0%) | 0 (0.0%) |
| Manufacturing | 120 (90.9%) | 12 (9.1%) |
| Wholesale Trade | 0 (0.0%) | 0 (0.0%) |
| Retail Trade | 0 (0.0%) | 44 (100.0%) |
| Transportation & Warehousing | 0 (0.0%) | 0 (0.0%) |
| Utilities | 28 (100.0%) | 0 (0.0%) |
| Information | 19 (100.0%) | 0 (0.0%) |
| Finance & Insurance | 18 (52.9%) | 16 (47.1%) |
| Real Estate, Rental & Leasing | 0 (0.0%) | 0 (0.0%) |
| Professional & Scientific | 0 (0.0%) | 0 (0.0%) |
| Enterprise Management | 0 (0.0%) | 0 (0.0%) |
| Administrative & Support | 0 (0.0%) | 0 (0.0%) |
| Educational Services | 17 (51.5%) | 16 (48.5%) |
| Health Care & Social Assistance | 8 (8.5%) | 86 (91.5%) |
| Arts, Entertainment & Recreation | 18 (40.0%) | 27 (60.0%) |
| Accommodation & Food Services | 16 (100.0%) | 0 (0.0%) |
| Public Administration | 0 (0.0%) | 9 (100.0%) |
| Total | 357 (63.0%) | 210 (37.0%) |
Education in Sunday Lake
School Enrollment in Sunday Lake
The most common levels of schooling among the 260 students in Sunday Lake are elementary school (115 | 44.2%), middle school (82 | 31.5%), and high school (47 | 18.1%).
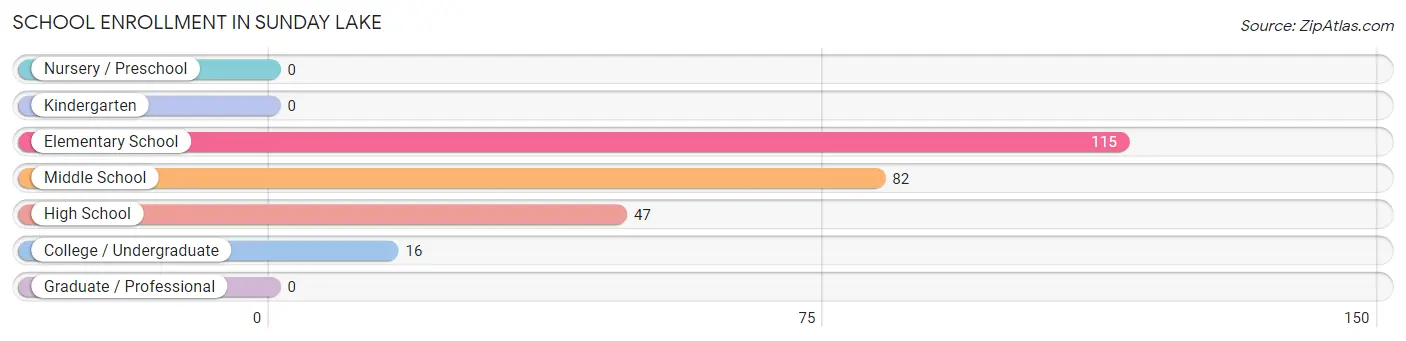
| School Level | # Students | % Students |
| Nursery / Preschool | 0 | 0.0% |
| Kindergarten | 0 | 0.0% |
| Elementary School | 115 | 44.2% |
| Middle School | 82 | 31.5% |
| High School | 47 | 18.1% |
| College / Undergraduate | 16 | 6.1% |
| Graduate / Professional | 0 | 0.0% |
| Total | 260 | 100.0% |
School Enrollment by Age by Funding Source in Sunday Lake
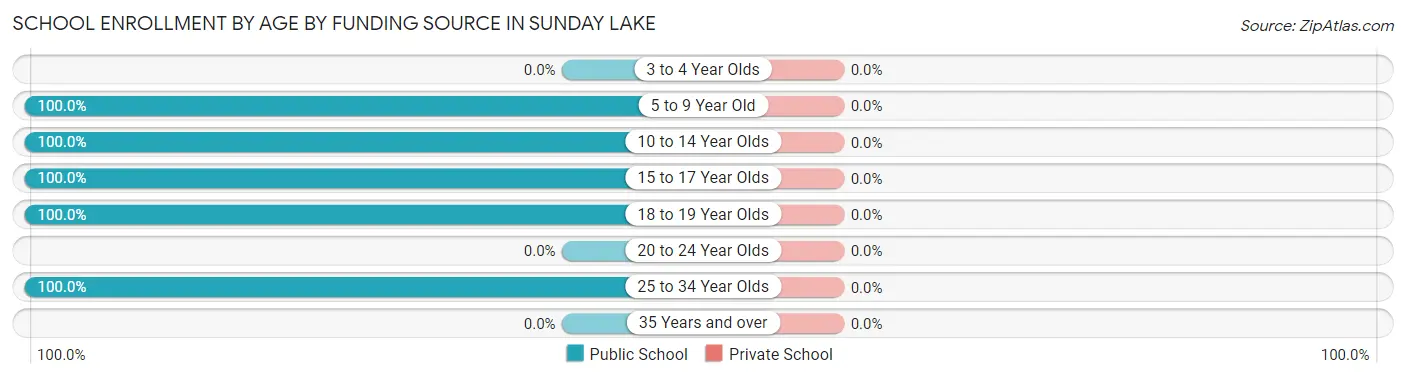
| Age Bracket | Public School | Private School |
| 3 to 4 Year Olds | 0 (0.0%) | 0 (0.0%) |
| 5 to 9 Year Old | 132 (100.0%) | 0 (0.0%) |
| 10 to 14 Year Olds | 65 (100.0%) | 0 (0.0%) |
| 15 to 17 Year Olds | 22 (100.0%) | 0 (0.0%) |
| 18 to 19 Year Olds | 32 (100.0%) | 0 (0.0%) |
| 20 to 24 Year Olds | 0 (0.0%) | 0 (0.0%) |
| 25 to 34 Year Olds | 9 (100.0%) | 0 (0.0%) |
| 35 Years and over | 0 (0.0%) | 0 (0.0%) |
| Total | 260 (100.0%) | 0 (0.0%) |
Educational Attainment by Field of Study in Sunday Lake
Science & technology (88 | 37.8%), business (34 | 14.6%), bio, nature & agricultural (26 | 11.2%), communications (24 | 10.3%), and education (20 | 8.6%) are the most common fields of study among 233 individuals in Sunday Lake who have obtained a bachelor's degree or higher.
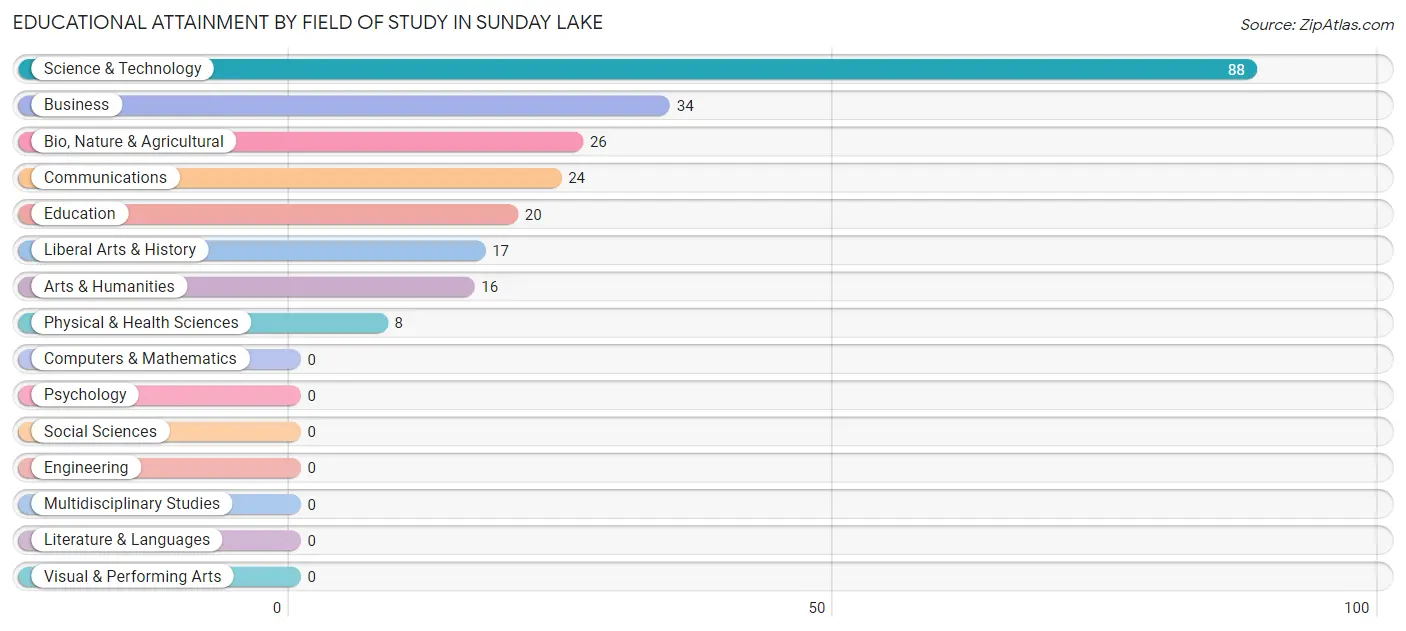
| Field of Study | # Graduates | % Graduates |
| Computers & Mathematics | 0 | 0.0% |
| Bio, Nature & Agricultural | 26 | 11.2% |
| Physical & Health Sciences | 8 | 3.4% |
| Psychology | 0 | 0.0% |
| Social Sciences | 0 | 0.0% |
| Engineering | 0 | 0.0% |
| Multidisciplinary Studies | 0 | 0.0% |
| Science & Technology | 88 | 37.8% |
| Business | 34 | 14.6% |
| Education | 20 | 8.6% |
| Literature & Languages | 0 | 0.0% |
| Liberal Arts & History | 17 | 7.3% |
| Visual & Performing Arts | 0 | 0.0% |
| Communications | 24 | 10.3% |
| Arts & Humanities | 16 | 6.9% |
| Total | 233 | 100.0% |
Transportation & Commute in Sunday Lake
Vehicle Availability by Sex in Sunday Lake
The most prevalent vehicle ownership categories in Sunday Lake are males with 2 vehicles (162, accounting for 47.5%) and females with 2 vehicles (71, making up 77.1%).
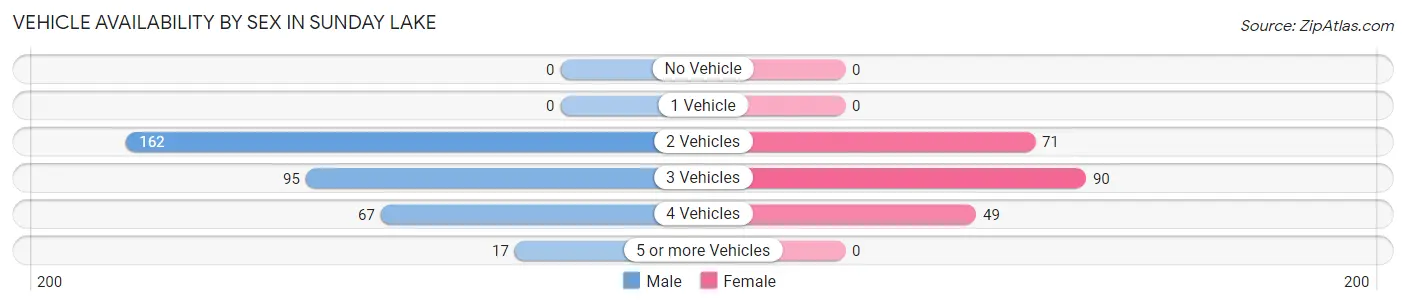
| Vehicles Available | Male | Female |
| No Vehicle | 0 (0.0%) | 0 (0.0%) |
| 1 Vehicle | 0 (0.0%) | 0 (0.0%) |
| 2 Vehicles | 162 (47.5%) | 71 (33.8%) |
| 3 Vehicles | 95 (27.9%) | 90 (42.9%) |
| 4 Vehicles | 67 (19.7%) | 49 (23.3%) |
| 5 or more Vehicles | 17 (5.0%) | 0 (0.0%) |
| Total | 341 (100.0%) | 210 (100.0%) |
Commute Time in Sunday Lake
The most frequently occuring commute durations in Sunday Lake are 45 to 59 minutes (120 commuters, 24.9%), 20 to 24 minutes (93 commuters, 19.3%), and 30 to 34 minutes (75 commuters, 15.6%).
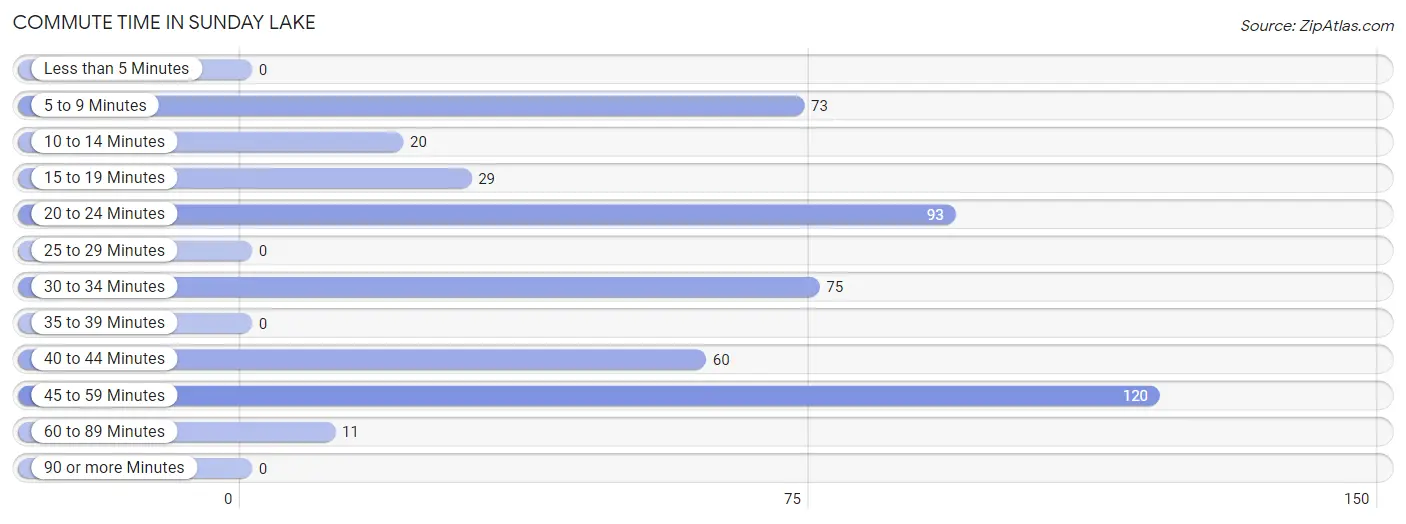
| Commute Time | # Commuters | % Commuters |
| Less than 5 Minutes | 0 | 0.0% |
| 5 to 9 Minutes | 73 | 15.2% |
| 10 to 14 Minutes | 20 | 4.2% |
| 15 to 19 Minutes | 29 | 6.0% |
| 20 to 24 Minutes | 93 | 19.3% |
| 25 to 29 Minutes | 0 | 0.0% |
| 30 to 34 Minutes | 75 | 15.6% |
| 35 to 39 Minutes | 0 | 0.0% |
| 40 to 44 Minutes | 60 | 12.5% |
| 45 to 59 Minutes | 120 | 24.9% |
| 60 to 89 Minutes | 11 | 2.3% |
| 90 or more Minutes | 0 | 0.0% |
Commute Time by Sex in Sunday Lake
The most common commute times in Sunday Lake are 45 to 59 minutes (91 commuters, 33.6%) for males and 20 to 24 minutes (58 commuters, 27.6%) for females.
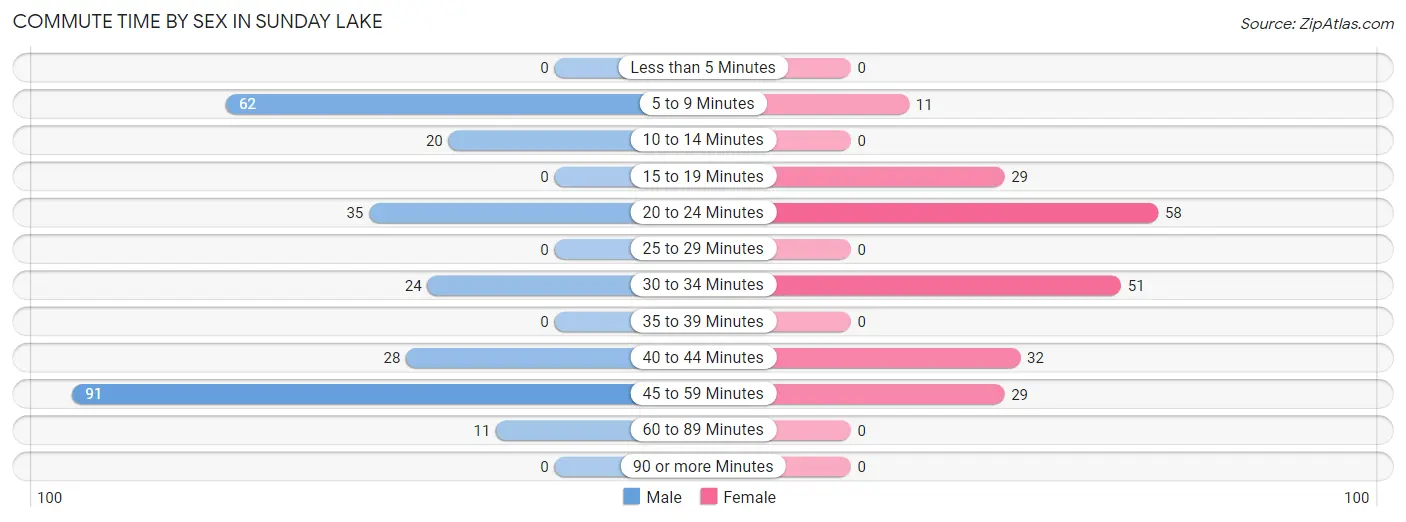
| Commute Time | Male | Female |
| Less than 5 Minutes | 0 (0.0%) | 0 (0.0%) |
| 5 to 9 Minutes | 62 (22.9%) | 11 (5.2%) |
| 10 to 14 Minutes | 20 (7.4%) | 0 (0.0%) |
| 15 to 19 Minutes | 0 (0.0%) | 29 (13.8%) |
| 20 to 24 Minutes | 35 (12.9%) | 58 (27.6%) |
| 25 to 29 Minutes | 0 (0.0%) | 0 (0.0%) |
| 30 to 34 Minutes | 24 (8.9%) | 51 (24.3%) |
| 35 to 39 Minutes | 0 (0.0%) | 0 (0.0%) |
| 40 to 44 Minutes | 28 (10.3%) | 32 (15.2%) |
| 45 to 59 Minutes | 91 (33.6%) | 29 (13.8%) |
| 60 to 89 Minutes | 11 (4.1%) | 0 (0.0%) |
| 90 or more Minutes | 0 (0.0%) | 0 (0.0%) |
Time of Departure to Work by Sex in Sunday Lake
The most frequent times of departure to work in Sunday Lake are 6:00 AM to 6:29 AM (103, 38.0%) for males and 7:00 AM to 7:29 AM (85, 40.5%) for females.
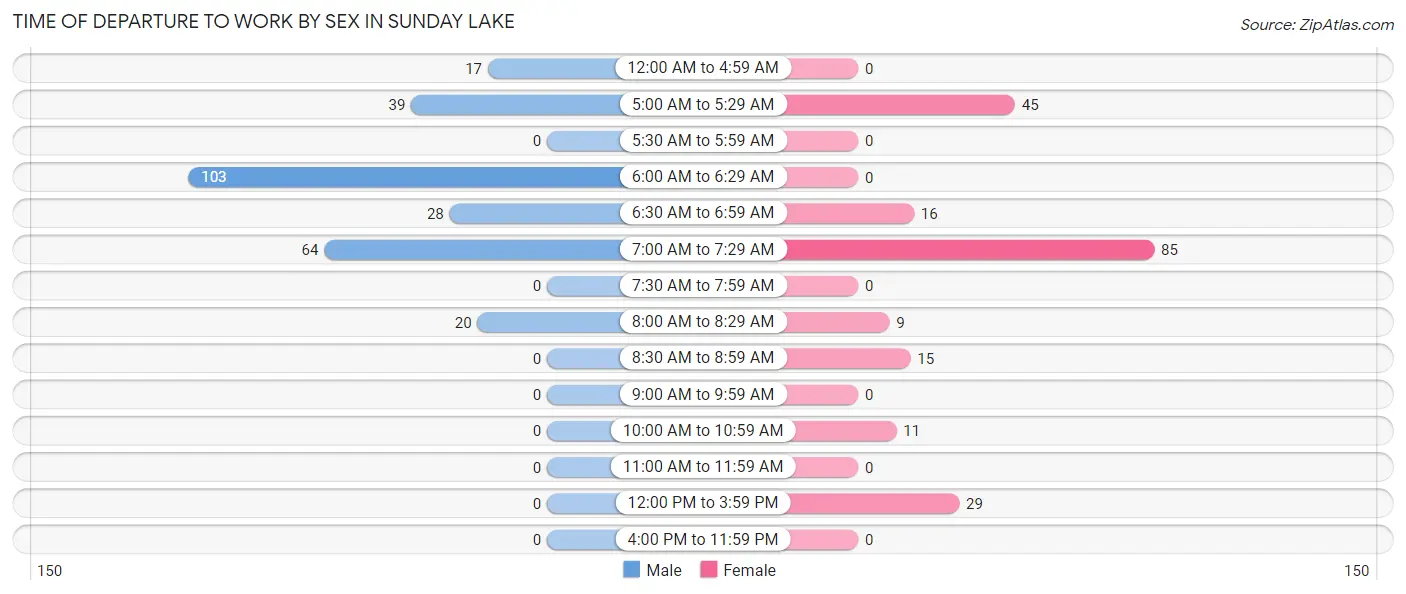
| Time of Departure | Male | Female |
| 12:00 AM to 4:59 AM | 17 (6.3%) | 0 (0.0%) |
| 5:00 AM to 5:29 AM | 39 (14.4%) | 45 (21.4%) |
| 5:30 AM to 5:59 AM | 0 (0.0%) | 0 (0.0%) |
| 6:00 AM to 6:29 AM | 103 (38.0%) | 0 (0.0%) |
| 6:30 AM to 6:59 AM | 28 (10.3%) | 16 (7.6%) |
| 7:00 AM to 7:29 AM | 64 (23.6%) | 85 (40.5%) |
| 7:30 AM to 7:59 AM | 0 (0.0%) | 0 (0.0%) |
| 8:00 AM to 8:29 AM | 20 (7.4%) | 9 (4.3%) |
| 8:30 AM to 8:59 AM | 0 (0.0%) | 15 (7.1%) |
| 9:00 AM to 9:59 AM | 0 (0.0%) | 0 (0.0%) |
| 10:00 AM to 10:59 AM | 0 (0.0%) | 11 (5.2%) |
| 11:00 AM to 11:59 AM | 0 (0.0%) | 0 (0.0%) |
| 12:00 PM to 3:59 PM | 0 (0.0%) | 29 (13.8%) |
| 4:00 PM to 11:59 PM | 0 (0.0%) | 0 (0.0%) |
| Total | 271 (100.0%) | 210 (100.0%) |
Housing Occupancy in Sunday Lake
Occupancy by Ownership in Sunday Lake
Of the total 395 dwellings in Sunday Lake, owner-occupied units account for 379 (96.0%), while renter-occupied units make up 16 (4.1%).
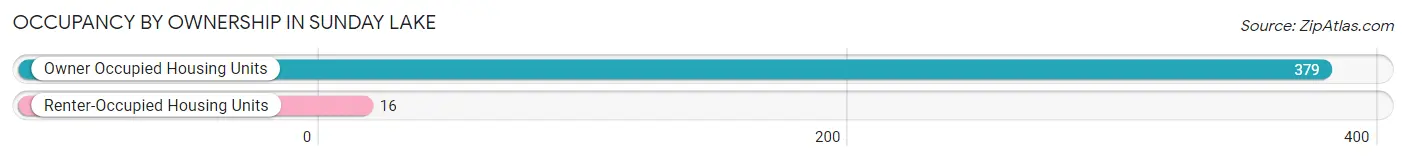
| Occupancy | # Housing Units | % Housing Units |
| Owner Occupied Housing Units | 379 | 96.0% |
| Renter-Occupied Housing Units | 16 | 4.1% |
| Total Occupied Housing Units | 395 | 100.0% |
Occupancy by Household Size in Sunday Lake
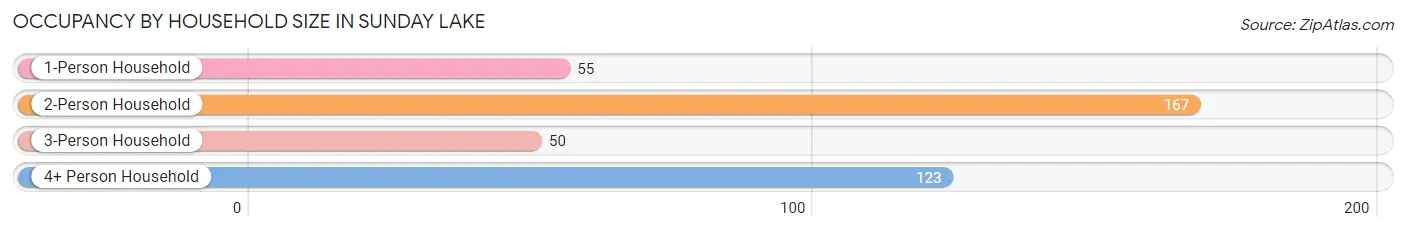
| Household Size | # Housing Units | % Housing Units |
| 1-Person Household | 55 | 13.9% |
| 2-Person Household | 167 | 42.3% |
| 3-Person Household | 50 | 12.7% |
| 4+ Person Household | 123 | 31.1% |
| Total Housing Units | 395 | 100.0% |
Occupancy by Ownership by Household Size in Sunday Lake
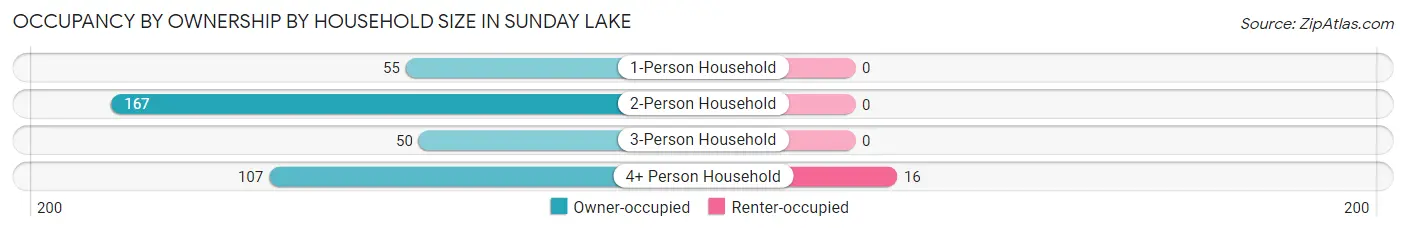
| Household Size | Owner-occupied | Renter-occupied |
| 1-Person Household | 55 (100.0%) | 0 (0.0%) |
| 2-Person Household | 167 (100.0%) | 0 (0.0%) |
| 3-Person Household | 50 (100.0%) | 0 (0.0%) |
| 4+ Person Household | 107 (87.0%) | 16 (13.0%) |
| Total Housing Units | 379 (96.0%) | 16 (4.1%) |
Occupancy by Educational Attainment in Sunday Lake
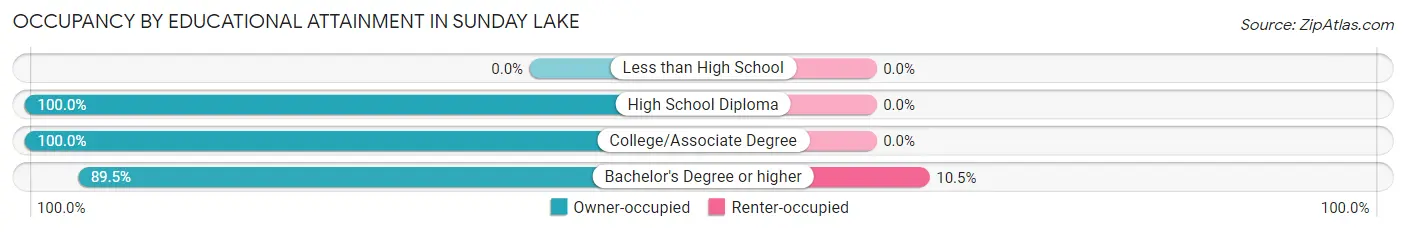
| Household Size | Owner-occupied | Renter-occupied |
| Less than High School | 0 (0.0%) | 0 (0.0%) |
| High School Diploma | 51 (100.0%) | 0 (0.0%) |
| College/Associate Degree | 192 (100.0%) | 0 (0.0%) |
| Bachelor's Degree or higher | 136 (89.5%) | 16 (10.5%) |
Occupancy by Age of Householder in Sunday Lake
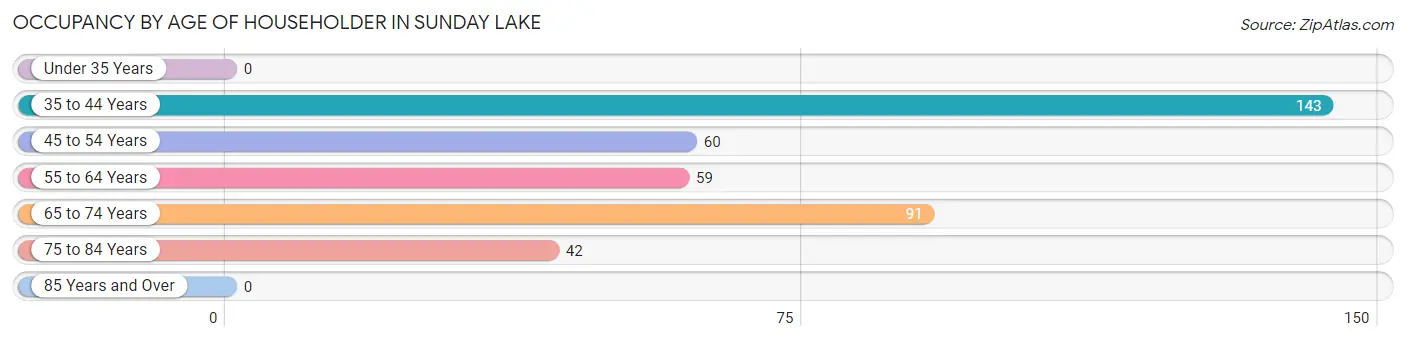
| Age Bracket | # Households | % Households |
| Under 35 Years | 0 | 0.0% |
| 35 to 44 Years | 143 | 36.2% |
| 45 to 54 Years | 60 | 15.2% |
| 55 to 64 Years | 59 | 14.9% |
| 65 to 74 Years | 91 | 23.0% |
| 75 to 84 Years | 42 | 10.6% |
| 85 Years and Over | 0 | 0.0% |
| Total | 395 | 100.0% |
Housing Finances in Sunday Lake
Median Income by Occupancy in Sunday Lake
| Occupancy Type | # Households | Median Income |
| Owner-Occupied | 379 (96.0%) | $0 |
| Renter-Occupied | 16 (4.1%) | $0 |
| Average | 395 (100.0%) | $0 |
Occupancy by Householder Income Bracket in Sunday Lake
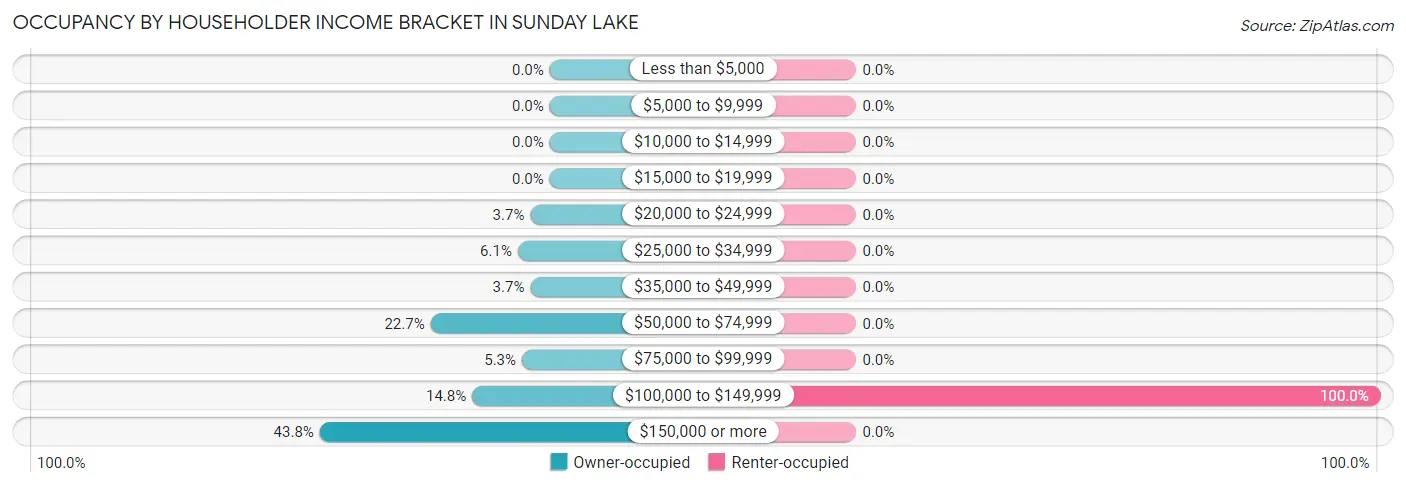
| Income Bracket | Owner-occupied | Renter-occupied |
| Less than $5,000 | 0 (0.0%) | 0 (0.0%) |
| $5,000 to $9,999 | 0 (0.0%) | 0 (0.0%) |
| $10,000 to $14,999 | 0 (0.0%) | 0 (0.0%) |
| $15,000 to $19,999 | 0 (0.0%) | 0 (0.0%) |
| $20,000 to $24,999 | 14 (3.7%) | 0 (0.0%) |
| $25,000 to $34,999 | 23 (6.1%) | 0 (0.0%) |
| $35,000 to $49,999 | 14 (3.7%) | 0 (0.0%) |
| $50,000 to $74,999 | 86 (22.7%) | 0 (0.0%) |
| $75,000 to $99,999 | 20 (5.3%) | 0 (0.0%) |
| $100,000 to $149,999 | 56 (14.8%) | 16 (100.0%) |
| $150,000 or more | 166 (43.8%) | 0 (0.0%) |
| Total | 379 (100.0%) | 16 (100.0%) |
Monthly Housing Cost Tiers in Sunday Lake
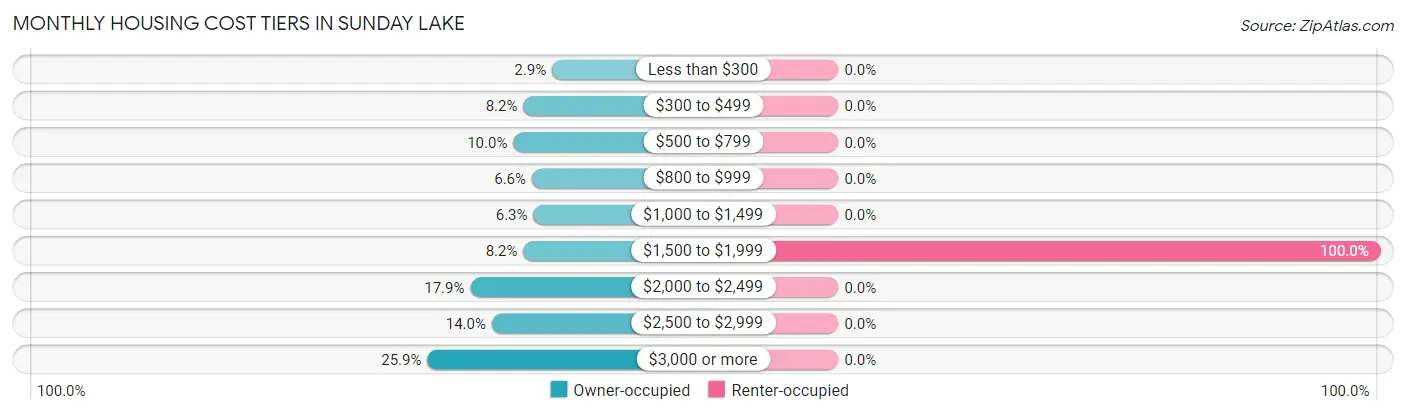
| Monthly Cost | Owner-occupied | Renter-occupied |
| Less than $300 | 11 (2.9%) | 0 (0.0%) |
| $300 to $499 | 31 (8.2%) | 0 (0.0%) |
| $500 to $799 | 38 (10.0%) | 0 (0.0%) |
| $800 to $999 | 25 (6.6%) | 0 (0.0%) |
| $1,000 to $1,499 | 24 (6.3%) | 0 (0.0%) |
| $1,500 to $1,999 | 31 (8.2%) | 16 (100.0%) |
| $2,000 to $2,499 | 68 (17.9%) | 0 (0.0%) |
| $2,500 to $2,999 | 53 (14.0%) | 0 (0.0%) |
| $3,000 or more | 98 (25.9%) | 0 (0.0%) |
| Total | 379 (100.0%) | 16 (100.0%) |
Physical Housing Characteristics in Sunday Lake
Housing Structures in Sunday Lake
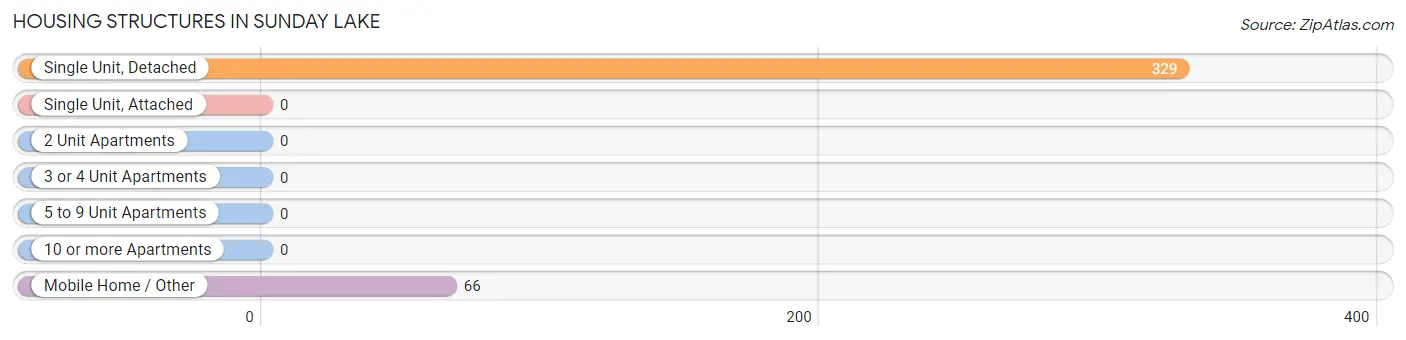
| Structure Type | # Housing Units | % Housing Units |
| Single Unit, Detached | 329 | 83.3% |
| Single Unit, Attached | 0 | 0.0% |
| 2 Unit Apartments | 0 | 0.0% |
| 3 or 4 Unit Apartments | 0 | 0.0% |
| 5 to 9 Unit Apartments | 0 | 0.0% |
| 10 or more Apartments | 0 | 0.0% |
| Mobile Home / Other | 66 | 16.7% |
| Total | 395 | 100.0% |
Housing Structures by Occupancy in Sunday Lake
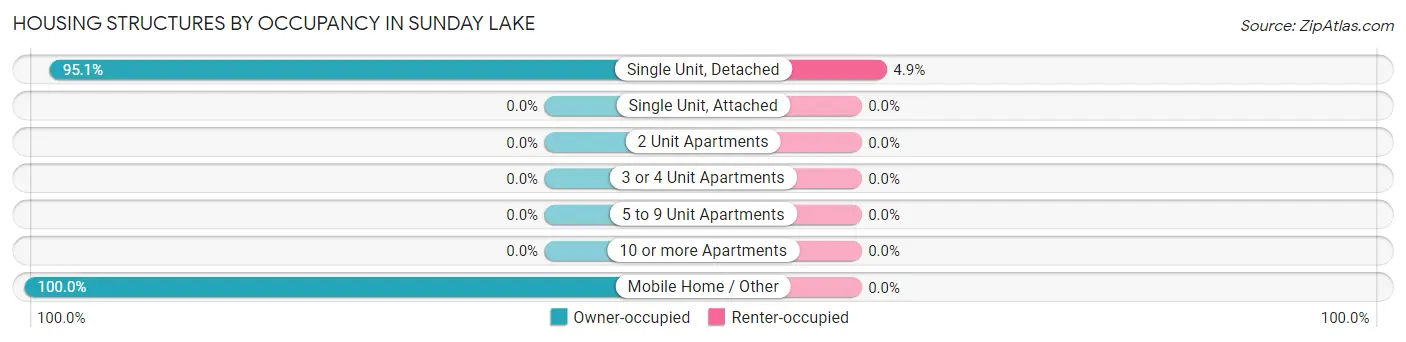
| Structure Type | Owner-occupied | Renter-occupied |
| Single Unit, Detached | 313 (95.1%) | 16 (4.9%) |
| Single Unit, Attached | 0 (0.0%) | 0 (0.0%) |
| 2 Unit Apartments | 0 (0.0%) | 0 (0.0%) |
| 3 or 4 Unit Apartments | 0 (0.0%) | 0 (0.0%) |
| 5 to 9 Unit Apartments | 0 (0.0%) | 0 (0.0%) |
| 10 or more Apartments | 0 (0.0%) | 0 (0.0%) |
| Mobile Home / Other | 66 (100.0%) | 0 (0.0%) |
| Total | 379 (96.0%) | 16 (4.1%) |
Housing Structures by Number of Rooms in Sunday Lake
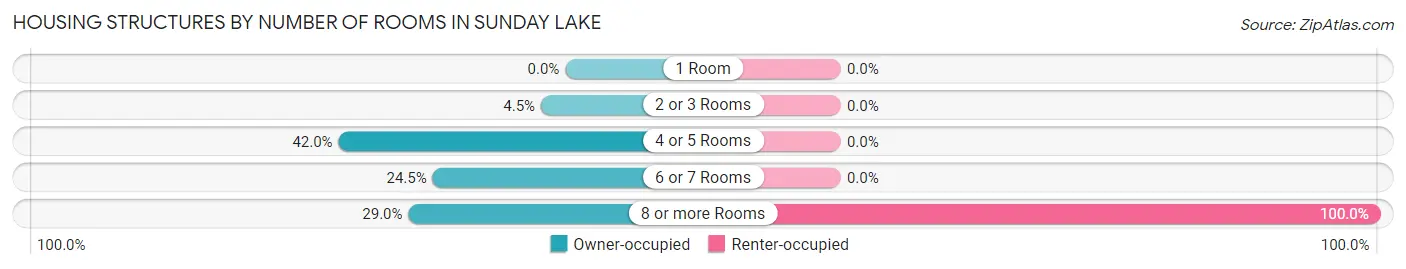
| Number of Rooms | Owner-occupied | Renter-occupied |
| 1 Room | 0 (0.0%) | 0 (0.0%) |
| 2 or 3 Rooms | 17 (4.5%) | 0 (0.0%) |
| 4 or 5 Rooms | 159 (41.9%) | 0 (0.0%) |
| 6 or 7 Rooms | 93 (24.5%) | 0 (0.0%) |
| 8 or more Rooms | 110 (29.0%) | 16 (100.0%) |
| Total | 379 (100.0%) | 16 (100.0%) |
Housing Structure by Heating Type in Sunday Lake
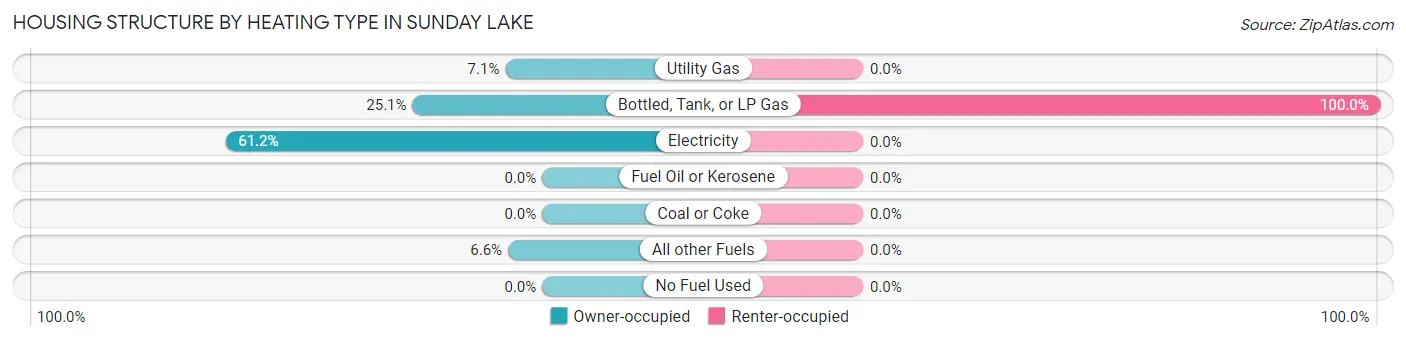
| Heating Type | Owner-occupied | Renter-occupied |
| Utility Gas | 27 (7.1%) | 0 (0.0%) |
| Bottled, Tank, or LP Gas | 95 (25.1%) | 16 (100.0%) |
| Electricity | 232 (61.2%) | 0 (0.0%) |
| Fuel Oil or Kerosene | 0 (0.0%) | 0 (0.0%) |
| Coal or Coke | 0 (0.0%) | 0 (0.0%) |
| All other Fuels | 25 (6.6%) | 0 (0.0%) |
| No Fuel Used | 0 (0.0%) | 0 (0.0%) |
| Total | 379 (100.0%) | 16 (100.0%) |
Household Vehicle Usage in Sunday Lake
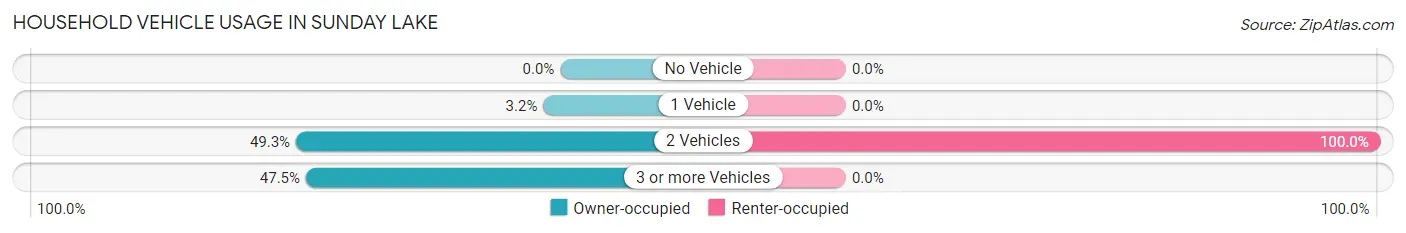
| Vehicles per Household | Owner-occupied | Renter-occupied |
| No Vehicle | 0 (0.0%) | 0 (0.0%) |
| 1 Vehicle | 12 (3.2%) | 0 (0.0%) |
| 2 Vehicles | 187 (49.3%) | 16 (100.0%) |
| 3 or more Vehicles | 180 (47.5%) | 0 (0.0%) |
| Total | 379 (100.0%) | 16 (100.0%) |
Real Estate & Mortgages in Sunday Lake
Real Estate and Mortgage Overview in Sunday Lake
| Characteristic | Without Mortgage | With Mortgage |
| Housing Units | 115 | 264 |
| Median Property Value | $634,800 | $635,500 |
| Median Household Income | - | - |
| Monthly Housing Costs | $725 | $98 |
| Real Estate Taxes | $5,531 | $0 |
Property Value by Mortgage Status in Sunday Lake
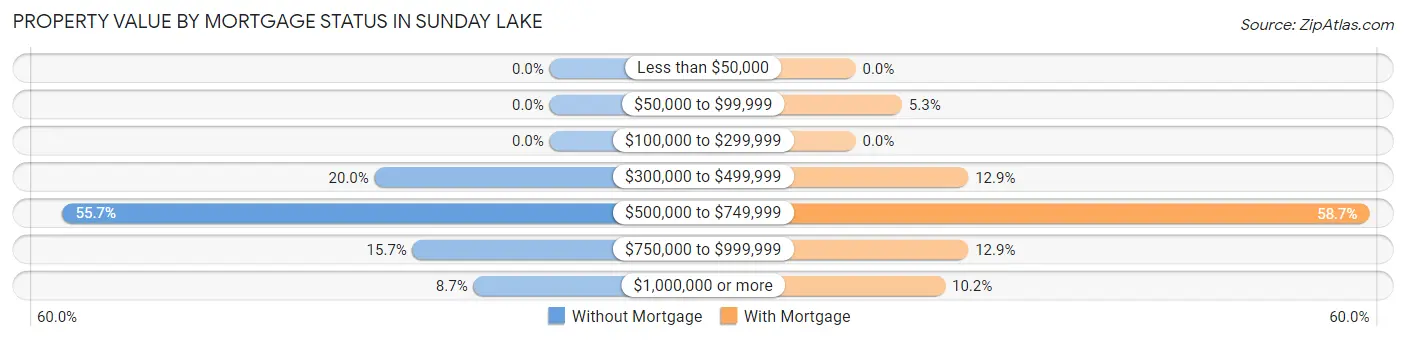
| Property Value | Without Mortgage | With Mortgage |
| Less than $50,000 | 0 (0.0%) | 0 (0.0%) |
| $50,000 to $99,999 | 0 (0.0%) | 14 (5.3%) |
| $100,000 to $299,999 | 0 (0.0%) | 0 (0.0%) |
| $300,000 to $499,999 | 23 (20.0%) | 34 (12.9%) |
| $500,000 to $749,999 | 64 (55.6%) | 155 (58.7%) |
| $750,000 to $999,999 | 18 (15.7%) | 34 (12.9%) |
| $1,000,000 or more | 10 (8.7%) | 27 (10.2%) |
| Total | 115 (100.0%) | 264 (100.0%) |
Household Income by Mortgage Status in Sunday Lake
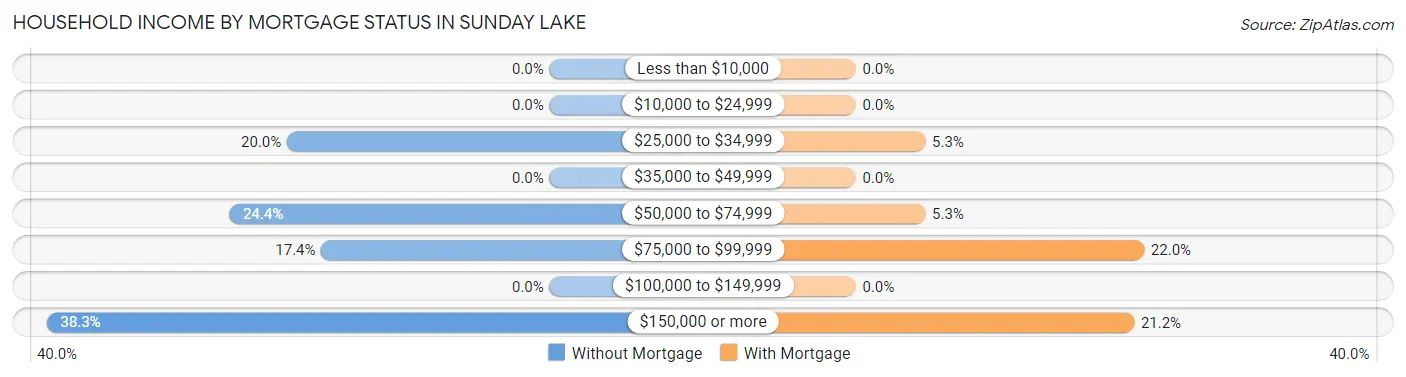
| Household Income | Without Mortgage | With Mortgage |
| Less than $10,000 | 0 (0.0%) | 0 (0.0%) |
| $10,000 to $24,999 | 0 (0.0%) | 0 (0.0%) |
| $25,000 to $34,999 | 23 (20.0%) | 14 (5.3%) |
| $35,000 to $49,999 | 0 (0.0%) | 0 (0.0%) |
| $50,000 to $74,999 | 28 (24.3%) | 14 (5.3%) |
| $75,000 to $99,999 | 20 (17.4%) | 58 (22.0%) |
| $100,000 to $149,999 | 0 (0.0%) | 0 (0.0%) |
| $150,000 or more | 44 (38.3%) | 56 (21.2%) |
| Total | 115 (100.0%) | 264 (100.0%) |
Property Value to Household Income Ratio in Sunday Lake
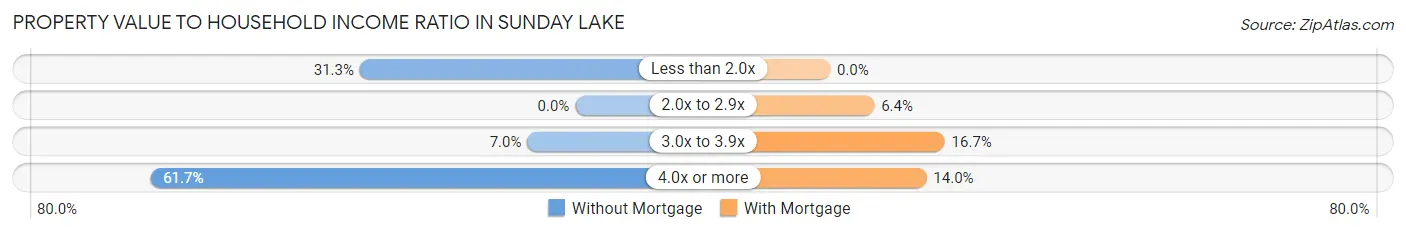
| Value-to-Income Ratio | Without Mortgage | With Mortgage |
| Less than 2.0x | 36 (31.3%) | 0 (0.0%) |
| 2.0x to 2.9x | 0 (0.0%) | 17 (6.4%) |
| 3.0x to 3.9x | 8 (7.0%) | 44 (16.7%) |
| 4.0x or more | 71 (61.7%) | 37 (14.0%) |
| Total | 115 (100.0%) | 264 (100.0%) |
Real Estate Taxes by Mortgage Status in Sunday Lake
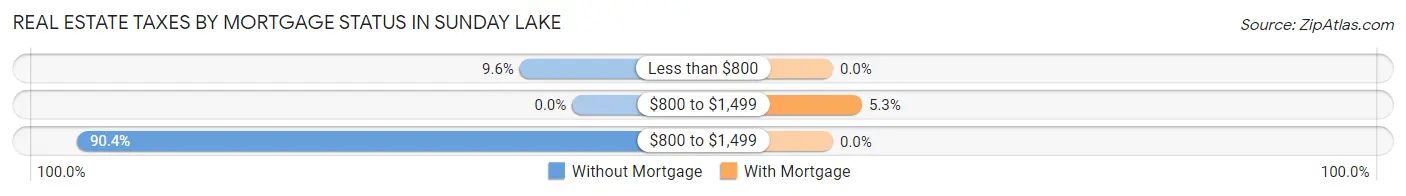
| Property Taxes | Without Mortgage | With Mortgage |
| Less than $800 | 11 (9.6%) | 0 (0.0%) |
| $800 to $1,499 | 0 (0.0%) | 14 (5.3%) |
| $800 to $1,499 | 104 (90.4%) | 0 (0.0%) |
| Total | 115 (100.0%) | 264 (100.0%) |
Health & Disability in Sunday Lake
Health Insurance Coverage by Age in Sunday Lake
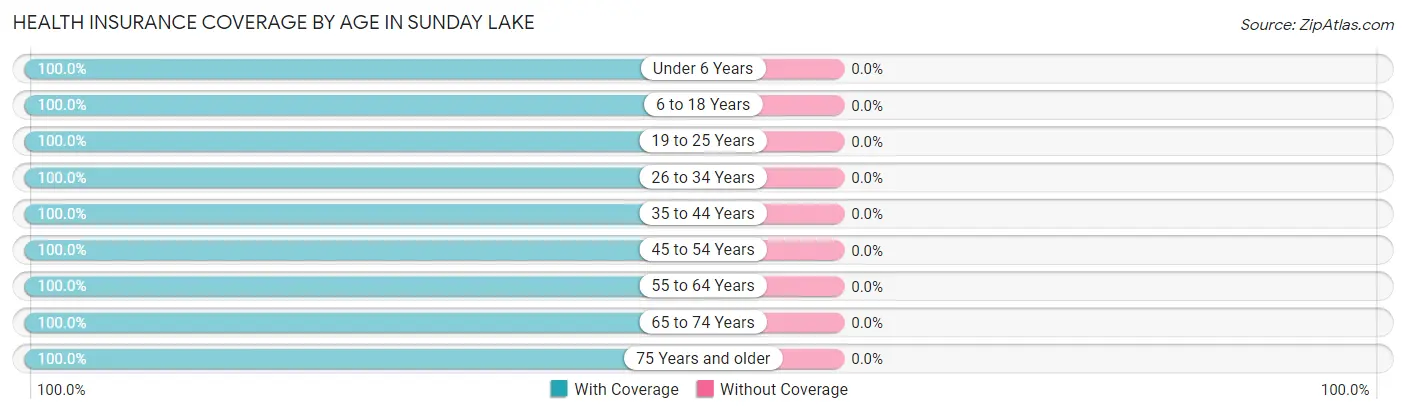
| Age Bracket | With Coverage | Without Coverage |
| Under 6 Years | 133 (100.0%) | 0 (0.0%) |
| 6 to 18 Years | 251 (100.0%) | 0 (0.0%) |
| 19 to 25 Years | 58 (100.0%) | 0 (0.0%) |
| 26 to 34 Years | 27 (100.0%) | 0 (0.0%) |
| 35 to 44 Years | 290 (100.0%) | 0 (0.0%) |
| 45 to 54 Years | 75 (100.0%) | 0 (0.0%) |
| 55 to 64 Years | 164 (100.0%) | 0 (0.0%) |
| 65 to 74 Years | 126 (100.0%) | 0 (0.0%) |
| 75 Years and older | 42 (100.0%) | 0 (0.0%) |
| Total | 1,166 (100.0%) | 0 (0.0%) |
Health Insurance Coverage by Citizenship Status in Sunday Lake
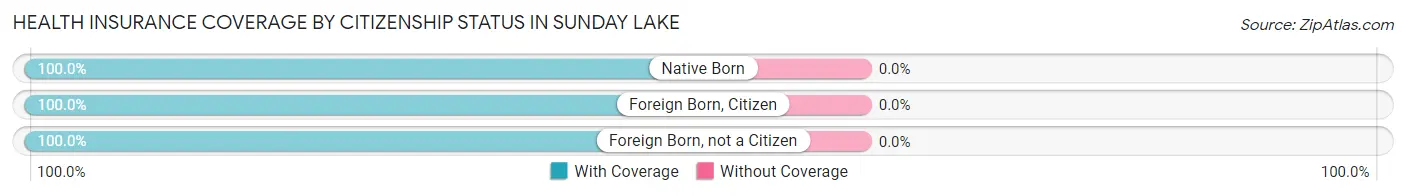
| Citizenship Status | With Coverage | Without Coverage |
| Native Born | 133 (100.0%) | 0 (0.0%) |
| Foreign Born, Citizen | 251 (100.0%) | 0 (0.0%) |
| Foreign Born, not a Citizen | 58 (100.0%) | 0 (0.0%) |
Health Insurance Coverage by Household Income in Sunday Lake
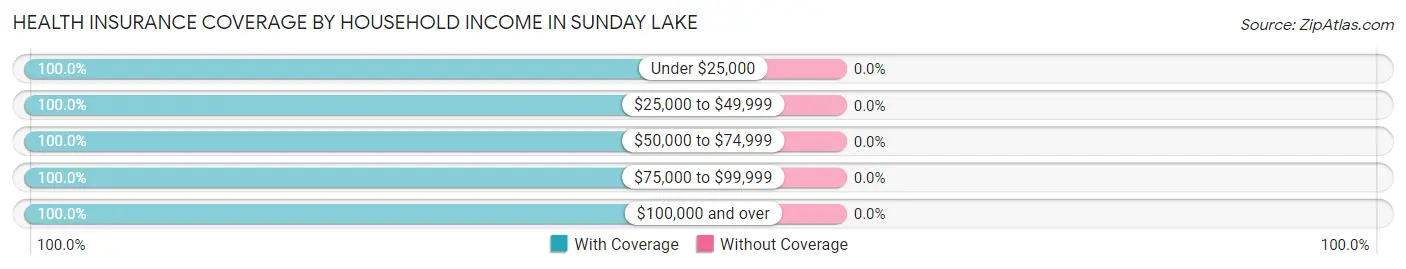
| Household Income | With Coverage | Without Coverage |
| Under $25,000 | 14 (100.0%) | 0 (0.0%) |
| $25,000 to $49,999 | 59 (100.0%) | 0 (0.0%) |
| $50,000 to $74,999 | 169 (100.0%) | 0 (0.0%) |
| $75,000 to $99,999 | 30 (100.0%) | 0 (0.0%) |
| $100,000 and over | 894 (100.0%) | 0 (0.0%) |
Public vs Private Health Insurance Coverage by Age in Sunday Lake
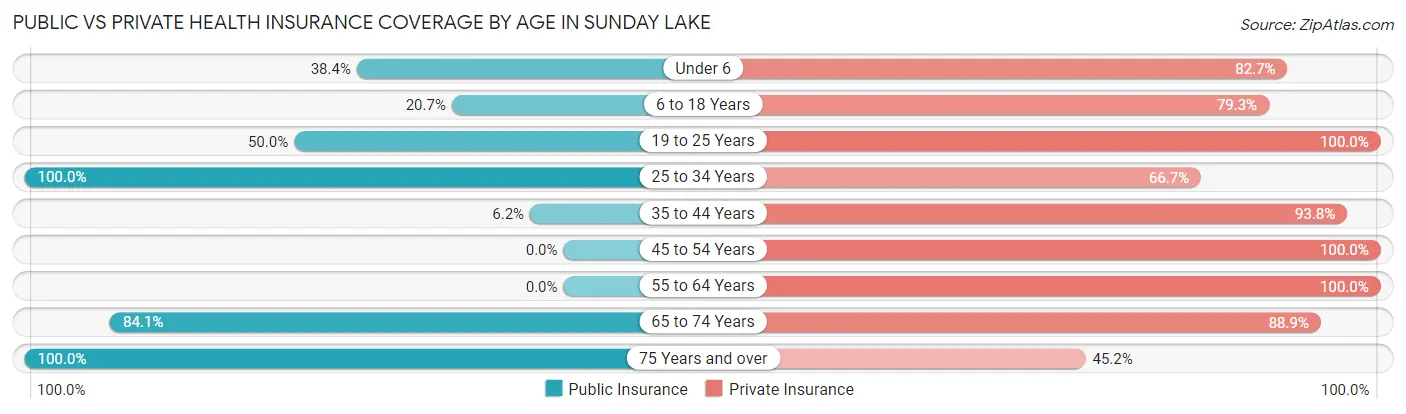
| Age Bracket | Public Insurance | Private Insurance |
| Under 6 | 51 (38.4%) | 110 (82.7%) |
| 6 to 18 Years | 52 (20.7%) | 199 (79.3%) |
| 19 to 25 Years | 29 (50.0%) | 58 (100.0%) |
| 25 to 34 Years | 27 (100.0%) | 18 (66.7%) |
| 35 to 44 Years | 18 (6.2%) | 272 (93.8%) |
| 45 to 54 Years | 0 (0.0%) | 75 (100.0%) |
| 55 to 64 Years | 0 (0.0%) | 164 (100.0%) |
| 65 to 74 Years | 106 (84.1%) | 112 (88.9%) |
| 75 Years and over | 42 (100.0%) | 19 (45.2%) |
| Total | 325 (27.9%) | 1,027 (88.1%) |
Disability Status by Sex by Age in Sunday Lake
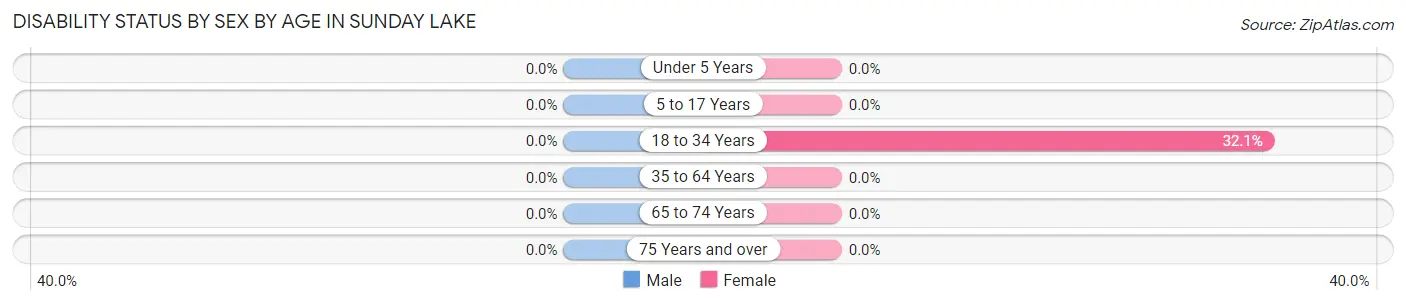
| Age Bracket | Male | Female |
| Under 5 Years | 0 (0.0%) | 0 (0.0%) |
| 5 to 17 Years | 0 (0.0%) | 0 (0.0%) |
| 18 to 34 Years | 0 (0.0%) | 18 (32.1%) |
| 35 to 64 Years | 0 (0.0%) | 0 (0.0%) |
| 65 to 74 Years | 0 (0.0%) | 0 (0.0%) |
| 75 Years and over | 0 (0.0%) | 0 (0.0%) |
Disability Class by Sex by Age in Sunday Lake
Disability Class: Hearing Difficulty
| Age Bracket | Male | Female |
| Under 5 Years | 0 (0.0%) | 0 (0.0%) |
| 5 to 17 Years | 0 (0.0%) | 0 (0.0%) |
| 18 to 34 Years | 0 (0.0%) | 0 (0.0%) |
| 35 to 64 Years | 0 (0.0%) | 0 (0.0%) |
| 65 to 74 Years | 0 (0.0%) | 0 (0.0%) |
| 75 Years and over | 0 (0.0%) | 0 (0.0%) |
Disability Class: Vision Difficulty
| Age Bracket | Male | Female |
| Under 5 Years | 0 (0.0%) | 0 (0.0%) |
| 5 to 17 Years | 0 (0.0%) | 0 (0.0%) |
| 18 to 34 Years | 0 (0.0%) | 0 (0.0%) |
| 35 to 64 Years | 0 (0.0%) | 0 (0.0%) |
| 65 to 74 Years | 0 (0.0%) | 0 (0.0%) |
| 75 Years and over | 0 (0.0%) | 0 (0.0%) |
Disability Class: Cognitive Difficulty
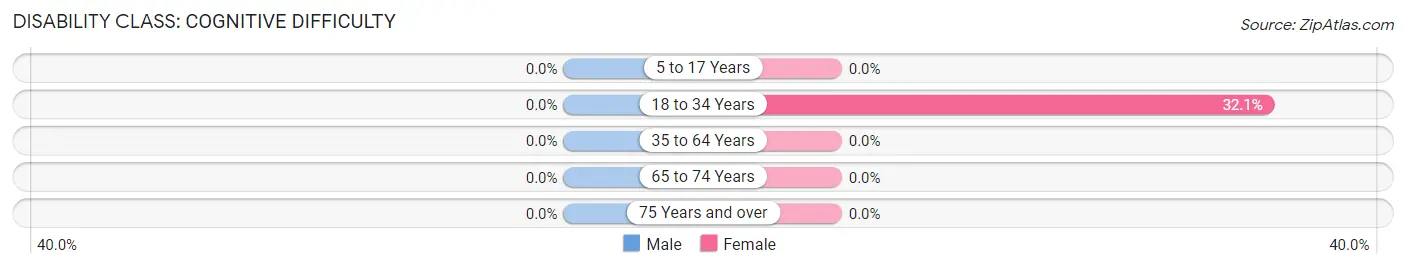
| Age Bracket | Male | Female |
| 5 to 17 Years | 0 (0.0%) | 0 (0.0%) |
| 18 to 34 Years | 0 (0.0%) | 18 (32.1%) |
| 35 to 64 Years | 0 (0.0%) | 0 (0.0%) |
| 65 to 74 Years | 0 (0.0%) | 0 (0.0%) |
| 75 Years and over | 0 (0.0%) | 0 (0.0%) |
Disability Class: Ambulatory Difficulty
| Age Bracket | Male | Female |
| 5 to 17 Years | 0 (0.0%) | 0 (0.0%) |
| 18 to 34 Years | 0 (0.0%) | 0 (0.0%) |
| 35 to 64 Years | 0 (0.0%) | 0 (0.0%) |
| 65 to 74 Years | 0 (0.0%) | 0 (0.0%) |
| 75 Years and over | 0 (0.0%) | 0 (0.0%) |
Disability Class: Self-Care Difficulty
| Age Bracket | Male | Female |
| 5 to 17 Years | 0 (0.0%) | 0 (0.0%) |
| 18 to 34 Years | 0 (0.0%) | 0 (0.0%) |
| 35 to 64 Years | 0 (0.0%) | 0 (0.0%) |
| 65 to 74 Years | 0 (0.0%) | 0 (0.0%) |
| 75 Years and over | 0 (0.0%) | 0 (0.0%) |
Technology Access in Sunday Lake
Computing Device Access in Sunday Lake
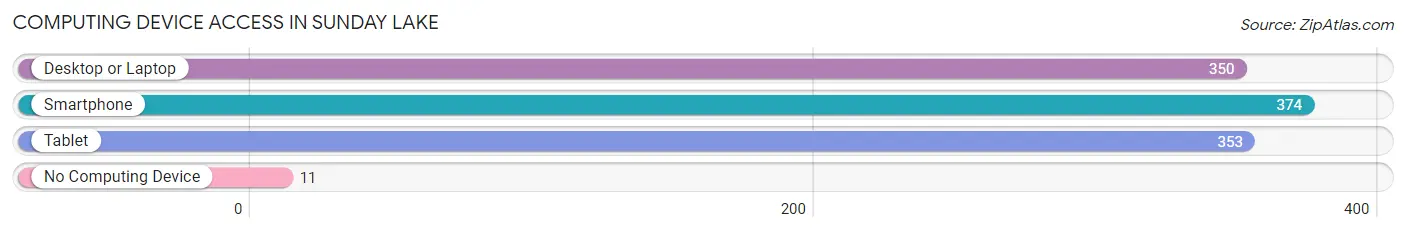
| Device Type | # Households | % Households |
| Desktop or Laptop | 350 | 88.6% |
| Smartphone | 374 | 94.7% |
| Tablet | 353 | 89.4% |
| No Computing Device | 11 | 2.8% |
| Total | 395 | 100.0% |
Internet Access in Sunday Lake
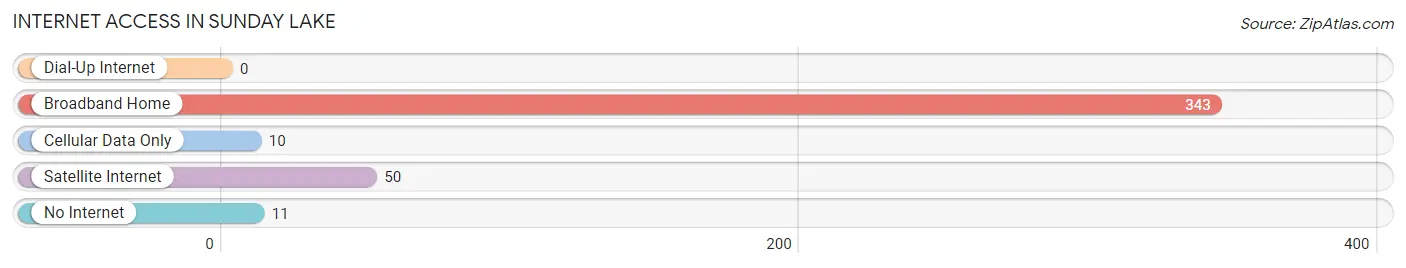
| Internet Type | # Households | % Households |
| Dial-Up Internet | 0 | 0.0% |
| Broadband Home | 343 | 86.8% |
| Cellular Data Only | 10 | 2.5% |
| Satellite Internet | 50 | 12.7% |
| No Internet | 11 | 2.8% |
| Total | 395 | 100.0% |
Sunday Lake Summary
Lake Sunday, Washington is a small town located in the Cascade Mountains of Washington State. It is situated in the foothills of the Cascades, about an hour and a half drive from Seattle. The town is home to about 1,000 people, and is known for its picturesque views of the surrounding mountains and its small-town charm.
History
The area around Lake Sunday has been inhabited for thousands of years by Native American tribes, including the Yakama, Klickitat, and Spokane. The first European settlers arrived in the area in the late 1800s, and the town of Lake Sunday was officially founded in 1891. The town was named after a nearby lake, which was named after a local Native American chief.
The town grew slowly over the years, and by the early 1900s, it had become a popular destination for tourists and outdoor enthusiasts. The town was also home to a number of logging and mining operations, which provided jobs for many of the town's residents.
Geography
Lake Sunday is located in the foothills of the Cascade Mountains, about an hour and a half drive from Seattle. The town is situated at an elevation of 1,500 feet, and is surrounded by mountains and forests. The nearby lake, which gives the town its name, is a popular destination for fishing and boating.
The town is located in a temperate climate, with mild summers and cold winters. The average annual temperature is around 50 degrees Fahrenheit, and the average annual precipitation is around 30 inches.
Economy
The economy of Lake Sunday is largely based on tourism and outdoor recreation. The town is home to a number of resorts and lodges, which attract visitors from all over the world. The nearby lake is a popular destination for fishing and boating, and the surrounding mountains provide excellent opportunities for hiking and camping.
The town is also home to a number of small businesses, including restaurants, shops, and galleries. The local economy is also supported by logging and mining operations, which provide jobs for many of the town's residents.
Demographics
As of the 2010 census, the population of Lake Sunday was 1,000 people. The town is predominantly white, with about 90% of the population identifying as Caucasian. The remaining 10% of the population is made up of Native Americans, African Americans, and other ethnicities.
The median household income in Lake Sunday is around $50,000, and the median home value is around $200,000. The town has a low unemployment rate, and the majority of the population is employed in the tourism and outdoor recreation industries.
Conclusion
Lake Sunday, Washington is a small town located in the Cascade Mountains of Washington State. It is known for its picturesque views of the surrounding mountains and its small-town charm. The town has a long history, and its economy is largely based on tourism and outdoor recreation. The population of Lake Sunday is predominantly white, with a median household income of around $50,000 and a median home value of around $200,000.
Common Questions
What is Per Capita Income in Sunday Lake?
Per Capita income in Sunday Lake is $59,338.
What is the Median Family Income in Sunday Lake?
Median Family Income in Sunday Lake is $195,341.
What is Inequality or Gini Index in Sunday Lake?
Inequality or Gini Index in Sunday Lake is 0.43.
What is the Total Population of Sunday Lake?
Total Population of Sunday Lake is 1,166.
What is the Total Male Population of Sunday Lake?
Total Male Population of Sunday Lake is 598.
What is the Total Female Population of Sunday Lake?
Total Female Population of Sunday Lake is 568.
What is the Ratio of Males per 100 Females in Sunday Lake?
There are 105.28 Males per 100 Females in Sunday Lake.
What is the Ratio of Females per 100 Males in Sunday Lake?
There are 94.98 Females per 100 Males in Sunday Lake.
What is the Median Population Age in Sunday Lake?
Median Population Age in Sunday Lake is 39.7 Years.
What is the Average Family Size in Sunday Lake
Average Family Size in Sunday Lake is 3.3 People.
What is the Average Household Size in Sunday Lake
Average Household Size in Sunday Lake is 3.0 People.
How Large is the Labor Force in Sunday Lake?
There are 567 People in the Labor Forcein in Sunday Lake.
What is the Percentage of People in the Labor Force in Sunday Lake?
67.8% of People are in the Labor Force in Sunday Lake.