Lake Tapps, WA Map & Demographics
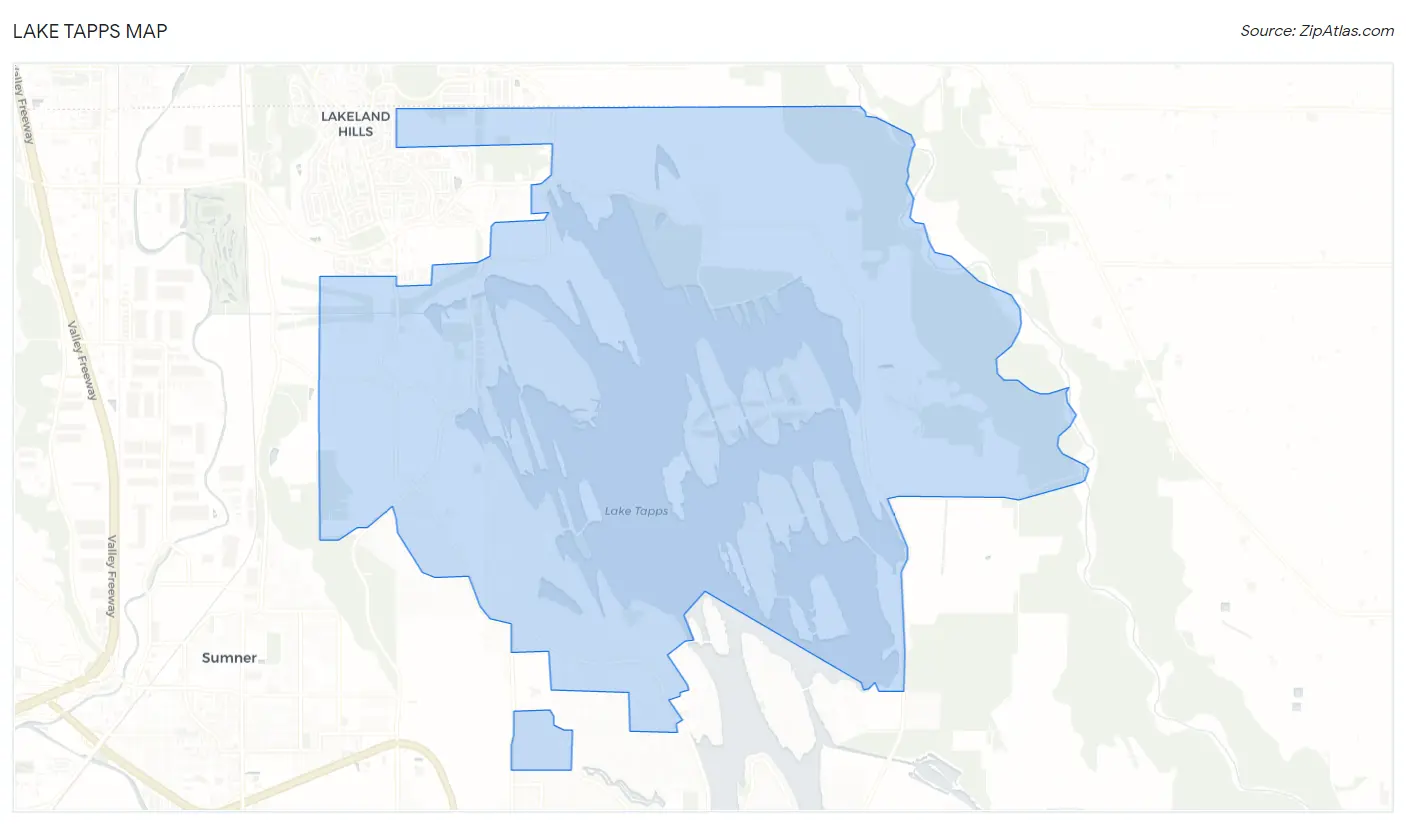
Lake Tapps Map
Lake Tapps Overview
$71,461
PER CAPITA INCOME
$154,297
AVG FAMILY INCOME
$132,850
AVG HOUSEHOLD INCOME
38.5%
WAGE / INCOME GAP [ % ]
61.5¢/ $1
WAGE / INCOME GAP [ $ ]
0.47
INEQUALITY / GINI INDEX
12,196
TOTAL POPULATION
6,255
MALE POPULATION
5,941
FEMALE POPULATION
105.29
MALES / 100 FEMALES
94.98
FEMALES / 100 MALES
43.3
MEDIAN AGE
3.1
AVG FAMILY SIZE
2.8
AVG HOUSEHOLD SIZE
6,542
LABOR FORCE [ PEOPLE ]
68.3%
PERCENT IN LABOR FORCE
3.6%
UNEMPLOYMENT RATE
Income in Lake Tapps
Income Overview in Lake Tapps
Per Capita Income in Lake Tapps is $71,461, while median incomes of families and households are $154,297 and $132,850 respectively.
| Characteristic | Number | Measure |
| Per Capita Income | 12,196 | $71,461 |
| Median Family Income | 3,418 | $154,297 |
| Mean Family Income | 3,418 | $226,230 |
| Median Household Income | 4,403 | $132,850 |
| Mean Household Income | 4,403 | $198,297 |
| Income Deficit | 3,418 | $0 |
| Wage / Income Gap (%) | 12,196 | 38.45% |
| Wage / Income Gap ($) | 12,196 | 61.55¢ per $1 |
| Gini / Inequality Index | 12,196 | 0.47 |
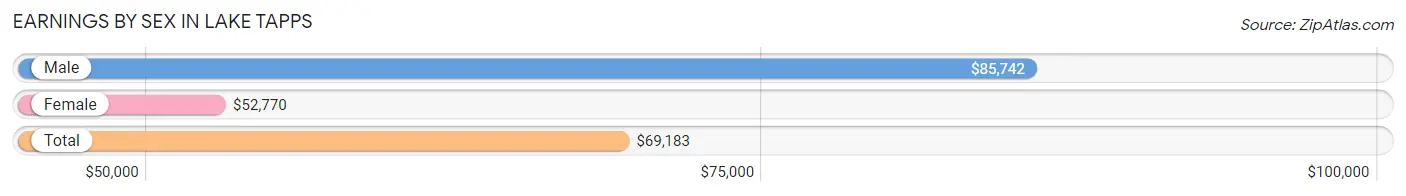
Earnings by Sex in Lake Tapps
Average Earnings in Lake Tapps are $69,183, $85,742 for men and $52,770 for women, a difference of 38.5%.
| Sex | Number | Average Earnings |
| Male | 3,565 (52.5%) | $85,742 |
| Female | 3,226 (47.5%) | $52,770 |
| Total | 6,791 (100.0%) | $69,183 |
Earnings by Sex by Income Bracket in Lake Tapps
The most common earnings brackets in Lake Tapps are $100,000+ for men (1,620 | 45.4%) and $100,000+ for women (727 | 22.5%).
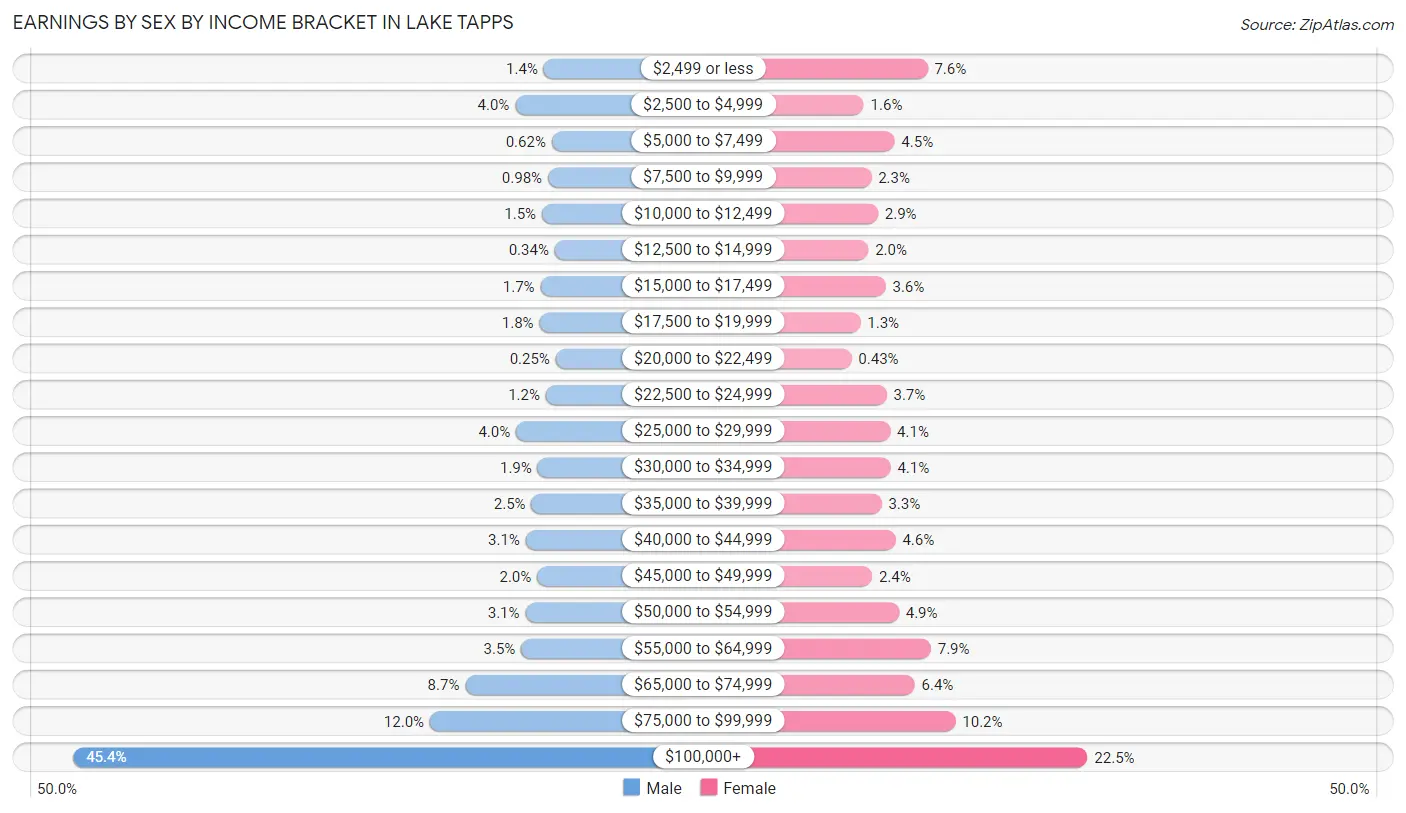
| Income | Male | Female |
| $2,499 or less | 49 (1.4%) | 244 (7.6%) |
| $2,500 to $4,999 | 144 (4.0%) | 51 (1.6%) |
| $5,000 to $7,499 | 22 (0.6%) | 144 (4.5%) |
| $7,500 to $9,999 | 35 (1.0%) | 74 (2.3%) |
| $10,000 to $12,499 | 55 (1.5%) | 94 (2.9%) |
| $12,500 to $14,999 | 12 (0.3%) | 65 (2.0%) |
| $15,000 to $17,499 | 60 (1.7%) | 117 (3.6%) |
| $17,500 to $19,999 | 63 (1.8%) | 41 (1.3%) |
| $20,000 to $22,499 | 9 (0.3%) | 14 (0.4%) |
| $22,500 to $24,999 | 42 (1.2%) | 120 (3.7%) |
| $25,000 to $29,999 | 141 (4.0%) | 131 (4.1%) |
| $30,000 to $34,999 | 69 (1.9%) | 132 (4.1%) |
| $35,000 to $39,999 | 90 (2.5%) | 105 (3.3%) |
| $40,000 to $44,999 | 109 (3.1%) | 147 (4.6%) |
| $45,000 to $49,999 | 71 (2.0%) | 76 (2.4%) |
| $50,000 to $54,999 | 110 (3.1%) | 157 (4.9%) |
| $55,000 to $64,999 | 124 (3.5%) | 254 (7.9%) |
| $65,000 to $74,999 | 311 (8.7%) | 205 (6.4%) |
| $75,000 to $99,999 | 429 (12.0%) | 328 (10.2%) |
| $100,000+ | 1,620 (45.4%) | 727 (22.5%) |
| Total | 3,565 (100.0%) | 3,226 (100.0%) |
Earnings by Sex by Educational Attainment in Lake Tapps
Average earnings in Lake Tapps are $102,449 for men and $60,799 for women, a difference of 40.6%. Men with an educational attainment of bachelor's degree enjoy the highest average annual earnings of $118,365, while those with less than high school education earn the least with $49,412. Women with an educational attainment of graduate degree earn the most with the average annual earnings of $97,070, while those with high school diploma education have the smallest earnings of $33,750.
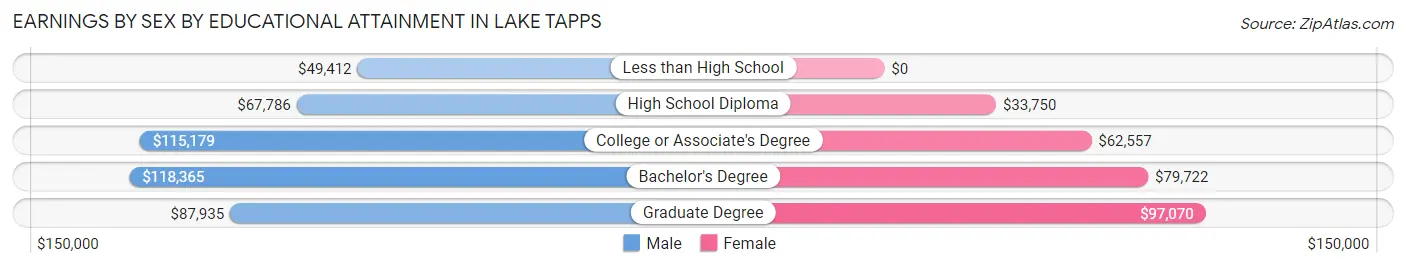
| Educational Attainment | Male Income | Female Income |
| Less than High School | $49,412 | $0 |
| High School Diploma | $67,786 | $33,750 |
| College or Associate's Degree | $115,179 | $62,557 |
| Bachelor's Degree | $118,365 | $79,722 |
| Graduate Degree | $87,935 | $97,070 |
| Total | $102,449 | $60,799 |
Family Income in Lake Tapps
Family Income Brackets in Lake Tapps
According to the Lake Tapps family income data, there are 1,087 families falling into the $200,000+ income range, which is the most common income bracket and makes up 31.8% of all families.
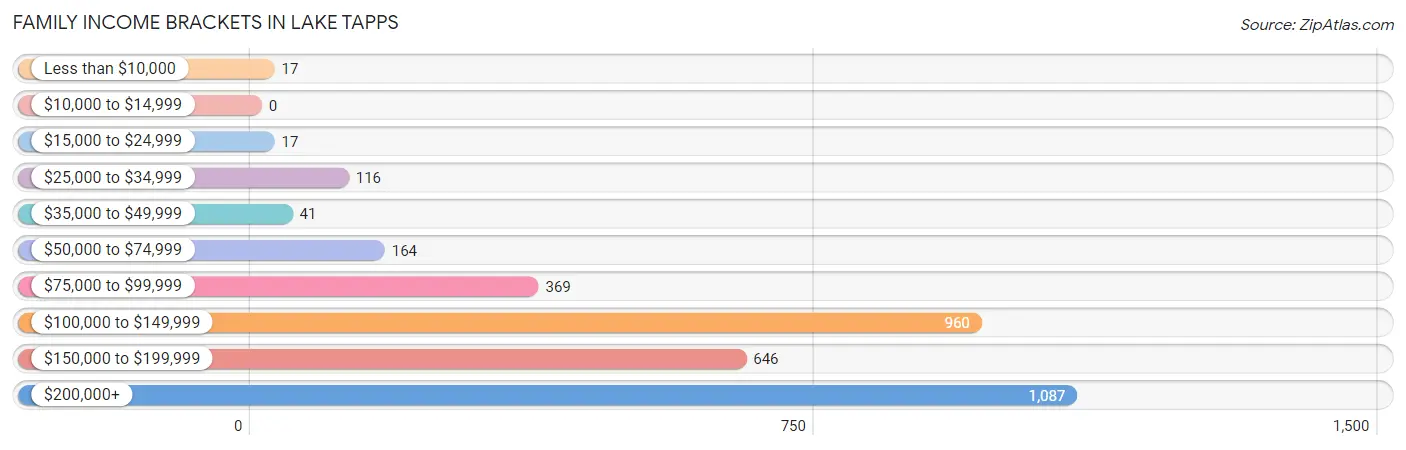
| Income Bracket | # Families | % Families |
| Less than $10,000 | 17 | 0.5% |
| $10,000 to $14,999 | 0 | 0.0% |
| $15,000 to $24,999 | 17 | 0.5% |
| $25,000 to $34,999 | 116 | 3.4% |
| $35,000 to $49,999 | 41 | 1.2% |
| $50,000 to $74,999 | 164 | 4.8% |
| $75,000 to $99,999 | 369 | 10.8% |
| $100,000 to $149,999 | 960 | 28.1% |
| $150,000 to $199,999 | 646 | 18.9% |
| $200,000+ | 1,087 | 31.8% |
Family Income by Famaliy Size in Lake Tapps
6-person families (81 | 2.4%) account for the highest median family income in Lake Tapps with $213,125 per family, while 2-person families (1,418 | 41.5%) have the highest median income of $63,873 per family member.
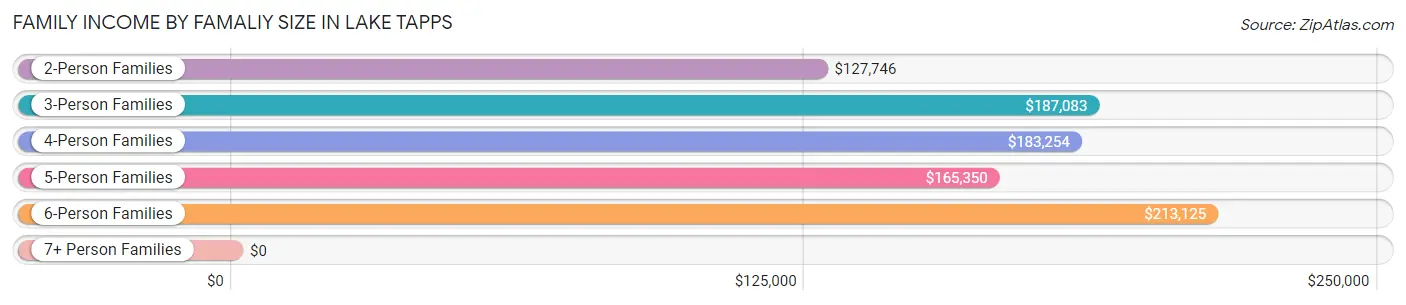
| Income Bracket | # Families | Median Income |
| 2-Person Families | 1,418 (41.5%) | $127,746 |
| 3-Person Families | 749 (21.9%) | $187,083 |
| 4-Person Families | 872 (25.5%) | $183,254 |
| 5-Person Families | 275 (8.1%) | $165,350 |
| 6-Person Families | 81 (2.4%) | $213,125 |
| 7+ Person Families | 23 (0.7%) | $0 |
| Total | 3,418 (100.0%) | $154,297 |
Family Income by Number of Earners in Lake Tapps
The median family income in Lake Tapps is $154,297, with families comprising 3+ earners (495) having the highest median family income of $197,917, while families with no earners (405) have the lowest median family income of $96,587, accounting for 14.5% and 11.8% of families, respectively.
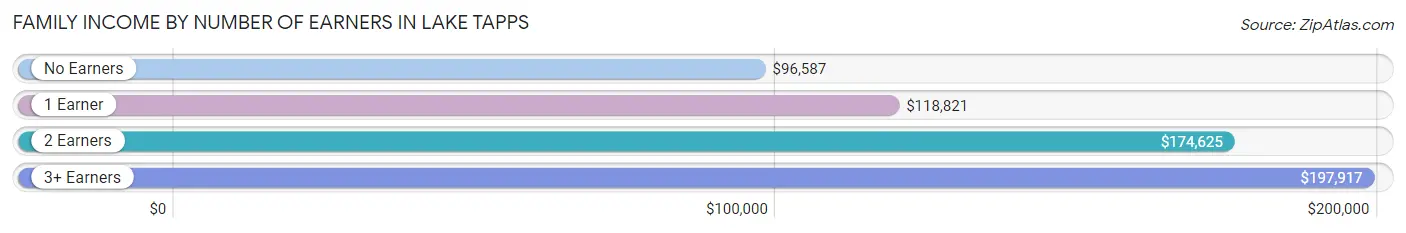
| Number of Earners | # Families | Median Income |
| No Earners | 405 (11.8%) | $96,587 |
| 1 Earner | 911 (26.7%) | $118,821 |
| 2 Earners | 1,607 (47.0%) | $174,625 |
| 3+ Earners | 495 (14.5%) | $197,917 |
| Total | 3,418 (100.0%) | $154,297 |
Household Income in Lake Tapps
Household Income Brackets in Lake Tapps
With 1,215 households falling in the category, the $200,000+ income range is the most frequent in Lake Tapps, accounting for 27.6% of all households. In contrast, only 40 households (0.9%) fall into the $10,000 to $14,999 income bracket, making it the least populous group.
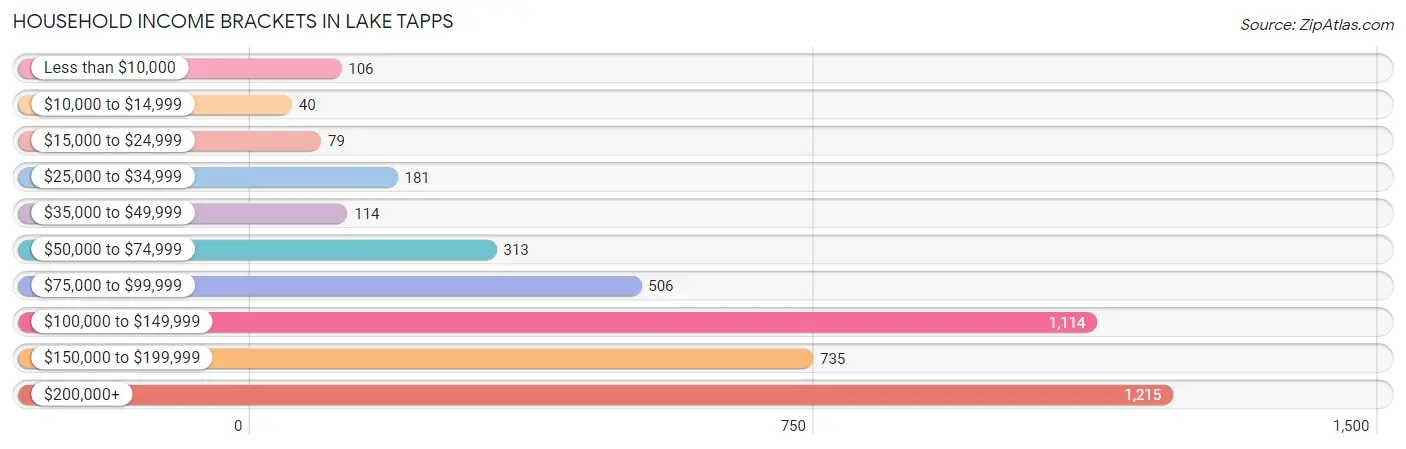
| Income Bracket | # Households | % Households |
| Less than $10,000 | 106 | 2.4% |
| $10,000 to $14,999 | 40 | 0.9% |
| $15,000 to $24,999 | 79 | 1.8% |
| $25,000 to $34,999 | 181 | 4.1% |
| $35,000 to $49,999 | 114 | 2.6% |
| $50,000 to $74,999 | 313 | 7.1% |
| $75,000 to $99,999 | 506 | 11.5% |
| $100,000 to $149,999 | 1,114 | 25.3% |
| $150,000 to $199,999 | 735 | 16.7% |
| $200,000+ | 1,215 | 27.6% |
Household Income by Householder Age in Lake Tapps
The median household income in Lake Tapps is $132,850, with the highest median household income of $166,250 found in the 45 to 64 years age bracket for the primary householder. A total of 2,160 households (49.1%) fall into this category. Meanwhile, the 15 to 24 years age bracket for the primary householder has the lowest median household income of $0, with 25 households (0.6%) in this group.
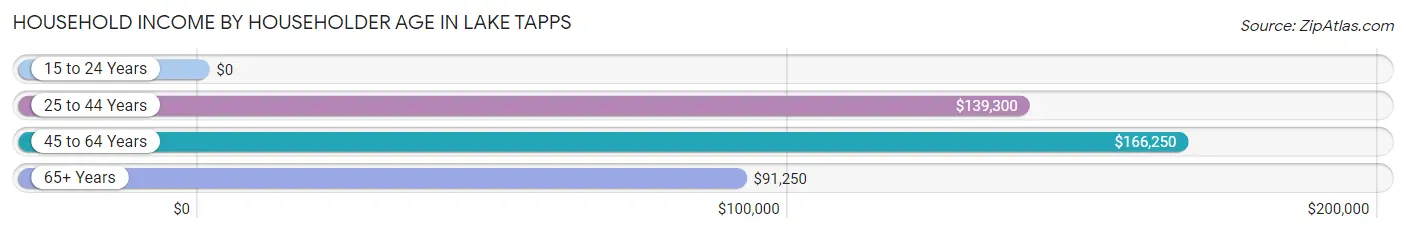
| Income Bracket | # Households | Median Income |
| 15 to 24 Years | 25 (0.6%) | $0 |
| 25 to 44 Years | 1,138 (25.9%) | $139,300 |
| 45 to 64 Years | 2,160 (49.1%) | $166,250 |
| 65+ Years | 1,080 (24.5%) | $91,250 |
| Total | 4,403 (100.0%) | $132,850 |
Poverty in Lake Tapps
Income Below Poverty by Sex and Age in Lake Tapps
With 2.9% poverty level for males and 3.3% for females among the residents of Lake Tapps, 12 to 14 year old males and 75 year old and over females are the most vulnerable to poverty, with 60 males (19.4%) and 30 females (14.4%) in their respective age groups living below the poverty level.
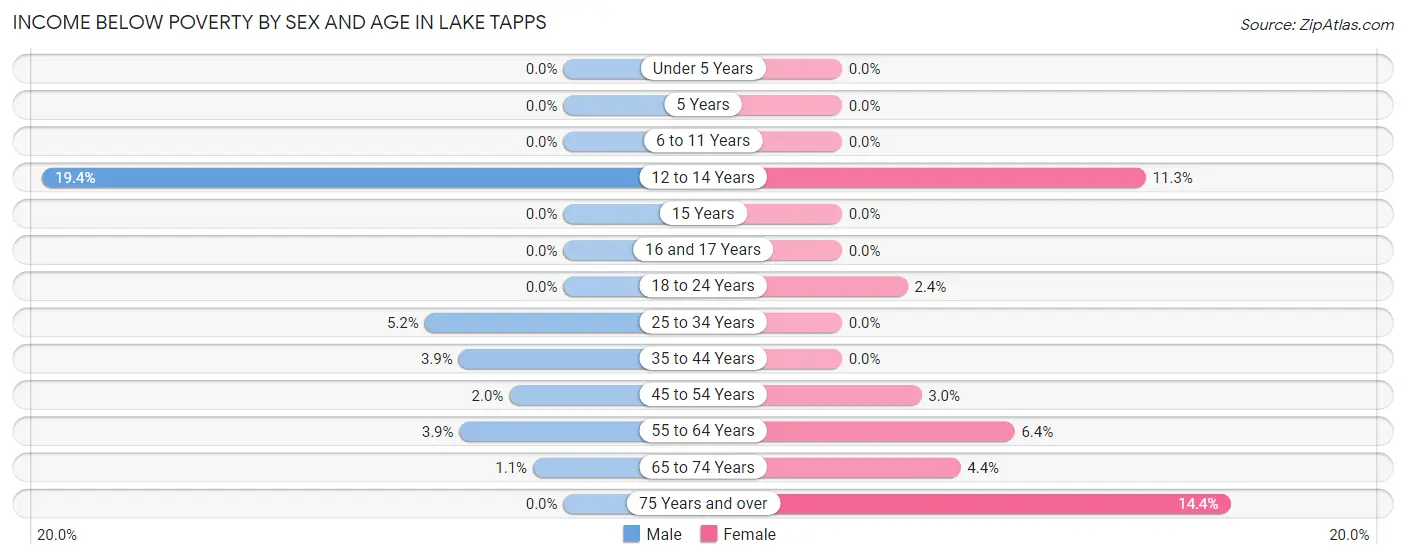
| Age Bracket | Male | Female |
| Under 5 Years | 0 (0.0%) | 0 (0.0%) |
| 5 Years | 0 (0.0%) | 0 (0.0%) |
| 6 to 11 Years | 0 (0.0%) | 0 (0.0%) |
| 12 to 14 Years | 60 (19.4%) | 30 (11.3%) |
| 15 Years | 0 (0.0%) | 0 (0.0%) |
| 16 and 17 Years | 0 (0.0%) | 0 (0.0%) |
| 18 to 24 Years | 0 (0.0%) | 11 (2.4%) |
| 25 to 34 Years | 19 (5.1%) | 0 (0.0%) |
| 35 to 44 Years | 33 (3.9%) | 0 (0.0%) |
| 45 to 54 Years | 21 (2.0%) | 27 (2.9%) |
| 55 to 64 Years | 40 (3.9%) | 60 (6.4%) |
| 65 to 74 Years | 7 (1.1%) | 35 (4.4%) |
| 75 Years and over | 0 (0.0%) | 30 (14.4%) |
| Total | 180 (2.9%) | 193 (3.3%) |
Income Above Poverty by Sex and Age in Lake Tapps
According to the poverty statistics in Lake Tapps, males aged under 5 years and females aged under 5 years are the age groups that are most secure financially, with 100.0% of males and 100.0% of females in these age groups living above the poverty line.
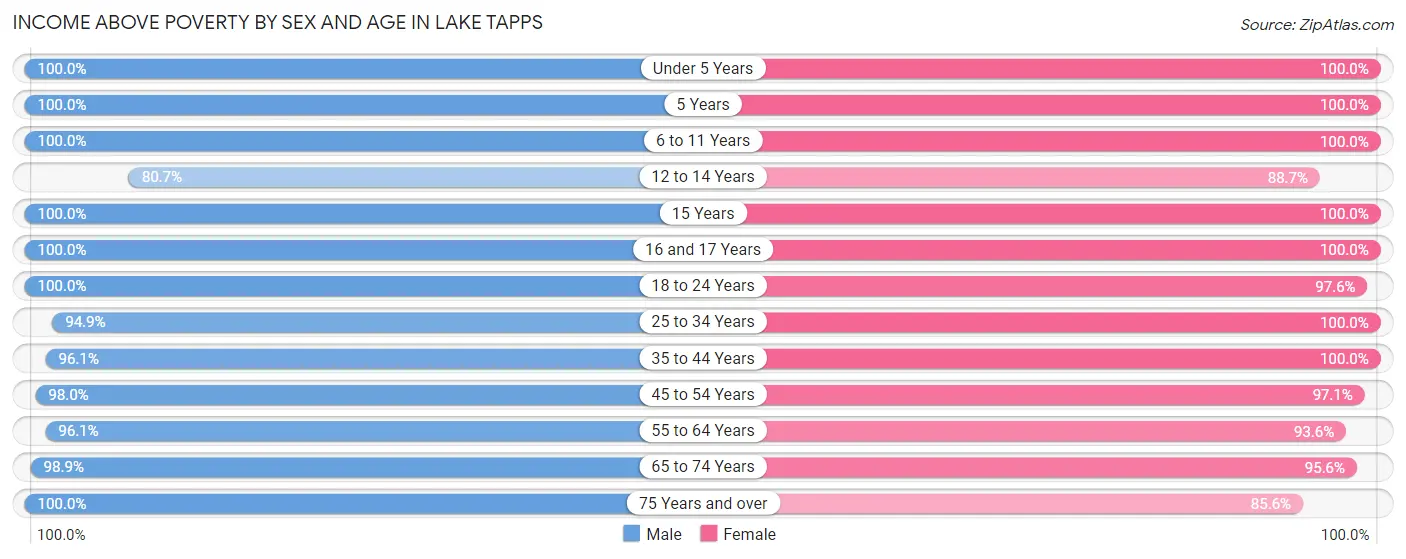
| Age Bracket | Male | Female |
| Under 5 Years | 283 (100.0%) | 286 (100.0%) |
| 5 Years | 61 (100.0%) | 28 (100.0%) |
| 6 to 11 Years | 670 (100.0%) | 486 (100.0%) |
| 12 to 14 Years | 250 (80.6%) | 236 (88.7%) |
| 15 Years | 91 (100.0%) | 124 (100.0%) |
| 16 and 17 Years | 138 (100.0%) | 123 (100.0%) |
| 18 to 24 Years | 558 (100.0%) | 439 (97.6%) |
| 25 to 34 Years | 350 (94.9%) | 489 (100.0%) |
| 35 to 44 Years | 816 (96.1%) | 823 (100.0%) |
| 45 to 54 Years | 1,022 (98.0%) | 888 (97.1%) |
| 55 to 64 Years | 995 (96.1%) | 876 (93.6%) |
| 65 to 74 Years | 610 (98.9%) | 760 (95.6%) |
| 75 Years and over | 231 (100.0%) | 178 (85.6%) |
| Total | 6,075 (97.1%) | 5,736 (96.7%) |
Income Below Poverty Among Married-Couple Families in Lake Tapps
The poverty statistics for married-couple families in Lake Tapps show that 0.5% or 16 of the total 3,065 families live below the poverty line. Families with no children have the highest poverty rate of 0.9%, comprising of 16 families. On the other hand, families with 1 or 2 children have the lowest poverty rate of 0.0%, which includes 0 families.
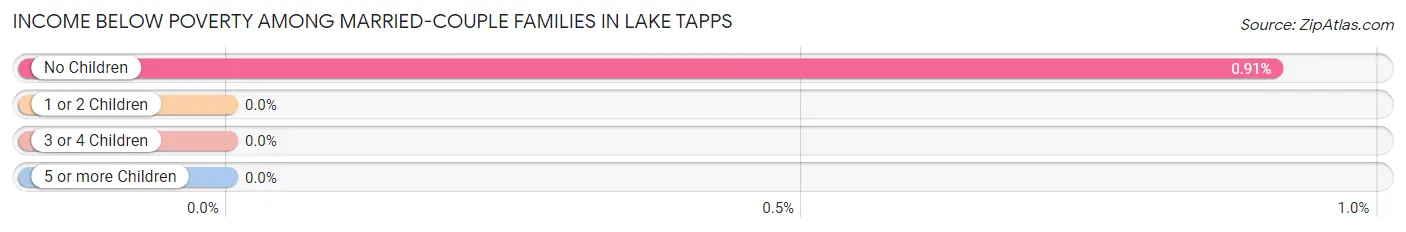
| Children | Above Poverty | Below Poverty |
| No Children | 1,750 (99.1%) | 16 (0.9%) |
| 1 or 2 Children | 1,103 (100.0%) | 0 (0.0%) |
| 3 or 4 Children | 196 (100.0%) | 0 (0.0%) |
| 5 or more Children | 0 (0.0%) | 0 (0.0%) |
| Total | 3,049 (99.5%) | 16 (0.5%) |
Income Below Poverty Among Single-Parent Households in Lake Tapps
According to the poverty data in Lake Tapps, 17.6% or 29 single-father households and 4.8% or 9 single-mother households are living below the poverty line. Among single-father households, those with 3 or 4 children have the highest poverty rate, with 29 households (55.8%) experiencing poverty. Likewise, among single-mother households, those with no children have the highest poverty rate, with 9 households (11.7%) falling below the poverty line.
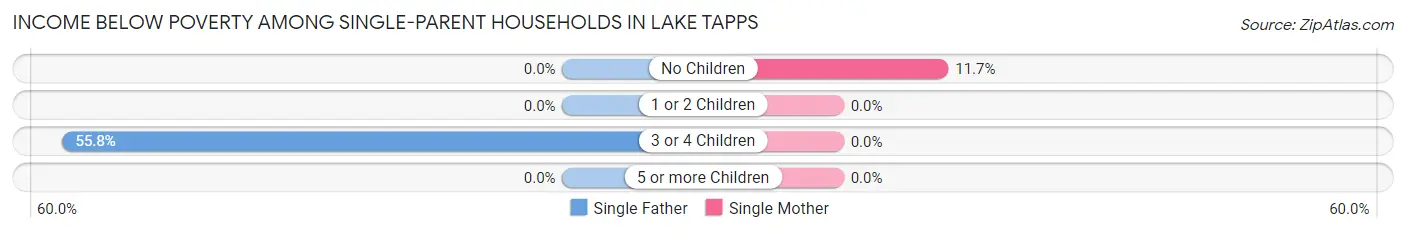
| Children | Single Father | Single Mother |
| No Children | 0 (0.0%) | 9 (11.7%) |
| 1 or 2 Children | 0 (0.0%) | 0 (0.0%) |
| 3 or 4 Children | 29 (55.8%) | 0 (0.0%) |
| 5 or more Children | 0 (0.0%) | 0 (0.0%) |
| Total | 29 (17.6%) | 9 (4.8%) |
Income Below Poverty Among Married-Couple vs Single-Parent Households in Lake Tapps
The poverty data for Lake Tapps shows that 16 of the married-couple family households (0.5%) and 38 of the single-parent households (10.8%) are living below the poverty level. Within the married-couple family households, those with no children have the highest poverty rate, with 16 households (0.9%) falling below the poverty line. Among the single-parent households, those with 3 or 4 children have the highest poverty rate, with 29 household (45.3%) living below poverty.
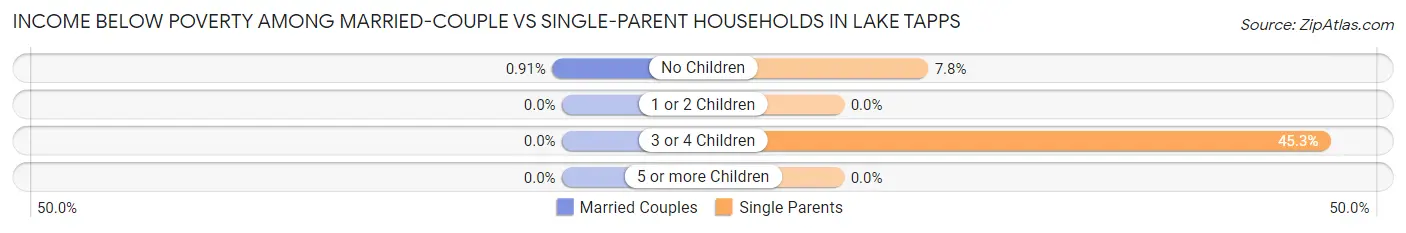
| Children | Married-Couple Families | Single-Parent Households |
| No Children | 16 (0.9%) | 9 (7.8%) |
| 1 or 2 Children | 0 (0.0%) | 0 (0.0%) |
| 3 or 4 Children | 0 (0.0%) | 29 (45.3%) |
| 5 or more Children | 0 (0.0%) | 0 (0.0%) |
| Total | 16 (0.5%) | 38 (10.8%) |
Race in Lake Tapps
The most populous races in Lake Tapps are White / Caucasian (10,453 | 85.7%), Two or more Races (1,079 | 8.8%), and Hispanic or Latino (686 | 5.6%).
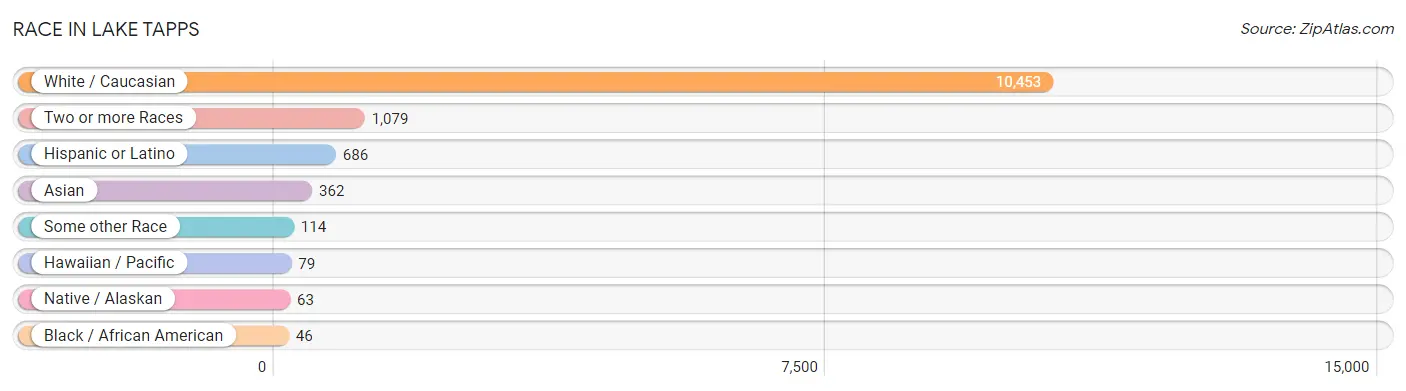
| Race | # Population | % Population |
| Asian | 362 | 3.0% |
| Black / African American | 46 | 0.4% |
| Hawaiian / Pacific | 79 | 0.6% |
| Hispanic or Latino | 686 | 5.6% |
| Native / Alaskan | 63 | 0.5% |
| White / Caucasian | 10,453 | 85.7% |
| Two or more Races | 1,079 | 8.8% |
| Some other Race | 114 | 0.9% |
| Total | 12,196 | 100.0% |
Ancestry in Lake Tapps
The most populous ancestries reported in Lake Tapps are German (1,969 | 16.1%), English (1,882 | 15.4%), Irish (1,608 | 13.2%), Norwegian (857 | 7.0%), and Swedish (644 | 5.3%), together accounting for 57.1% of all Lake Tapps residents.
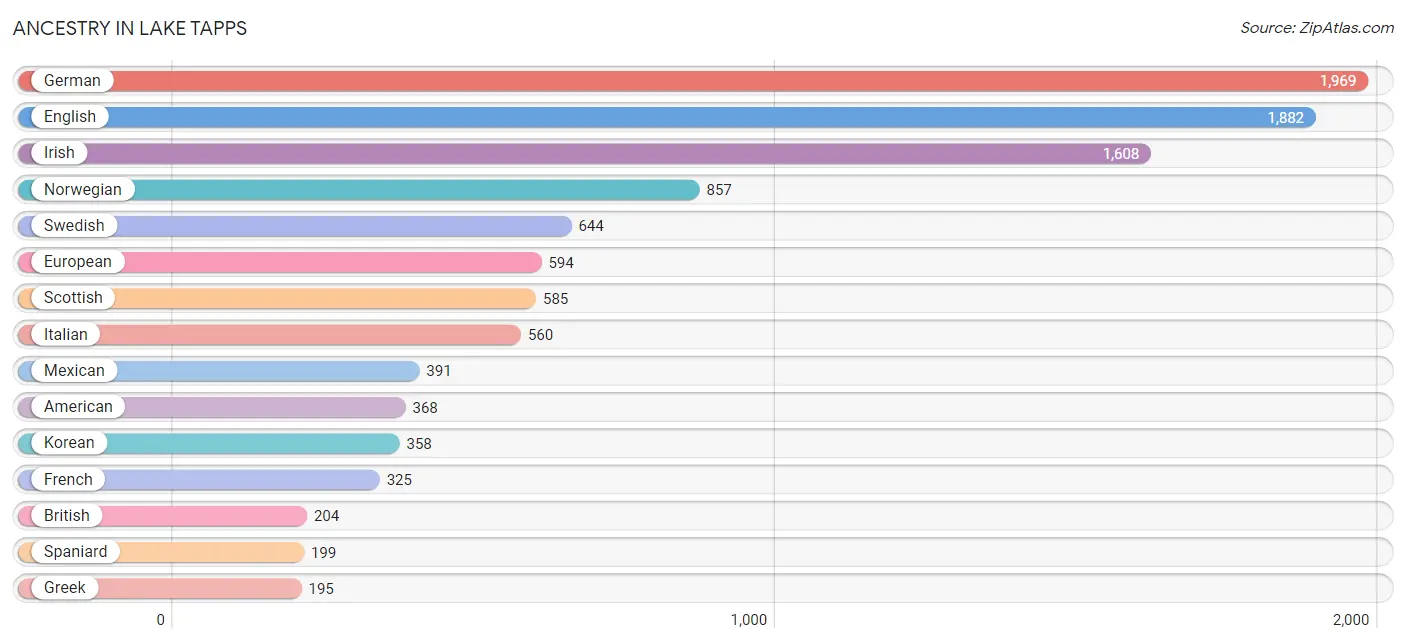
| Ancestry | # Population | % Population |
| American | 368 | 3.0% |
| Austrian | 26 | 0.2% |
| Bhutanese | 88 | 0.7% |
| British | 204 | 1.7% |
| Burmese | 55 | 0.4% |
| Canadian | 53 | 0.4% |
| Central American | 11 | 0.1% |
| Cherokee | 22 | 0.2% |
| Chickasaw | 5 | 0.0% |
| Colombian | 27 | 0.2% |
| Colville | 40 | 0.3% |
| Costa Rican | 11 | 0.1% |
| Czech | 107 | 0.9% |
| Czechoslovakian | 24 | 0.2% |
| Danish | 51 | 0.4% |
| Dutch | 158 | 1.3% |
| English | 1,882 | 15.4% |
| European | 594 | 4.9% |
| Finnish | 102 | 0.8% |
| French | 325 | 2.7% |
| French Canadian | 72 | 0.6% |
| German | 1,969 | 16.1% |
| Greek | 195 | 1.6% |
| Guamanian / Chamorro | 25 | 0.2% |
| Icelander | 20 | 0.2% |
| Indian (Asian) | 92 | 0.7% |
| Inupiat | 15 | 0.1% |
| Irish | 1,608 | 13.2% |
| Italian | 560 | 4.6% |
| Korean | 358 | 2.9% |
| Mexican | 391 | 3.2% |
| Mexican American Indian | 8 | 0.1% |
| Native Hawaiian | 54 | 0.4% |
| Navajo | 9 | 0.1% |
| Northern European | 20 | 0.2% |
| Norwegian | 857 | 7.0% |
| Polish | 127 | 1.0% |
| Portuguese | 11 | 0.1% |
| Puerto Rican | 12 | 0.1% |
| Puget Sound Salish | 31 | 0.3% |
| Russian | 66 | 0.5% |
| Samoan | 168 | 1.4% |
| Scandinavian | 188 | 1.5% |
| Scotch-Irish | 108 | 0.9% |
| Scottish | 585 | 4.8% |
| South American | 27 | 0.2% |
| Spaniard | 199 | 1.6% |
| Spanish | 46 | 0.4% |
| Sri Lankan | 30 | 0.3% |
| Swedish | 644 | 5.3% |
| Swiss | 171 | 1.4% |
| Thai | 92 | 0.7% |
| Ukrainian | 81 | 0.7% | View All 53 Rows |
Immigrants in Lake Tapps
The most numerous immigrant groups reported in Lake Tapps came from Europe (168 | 1.4%), Asia (166 | 1.4%), Canada (150 | 1.2%), Latin America (114 | 0.9%), and Eastern Europe (105 | 0.9%), together accounting for 5.8% of all Lake Tapps residents.
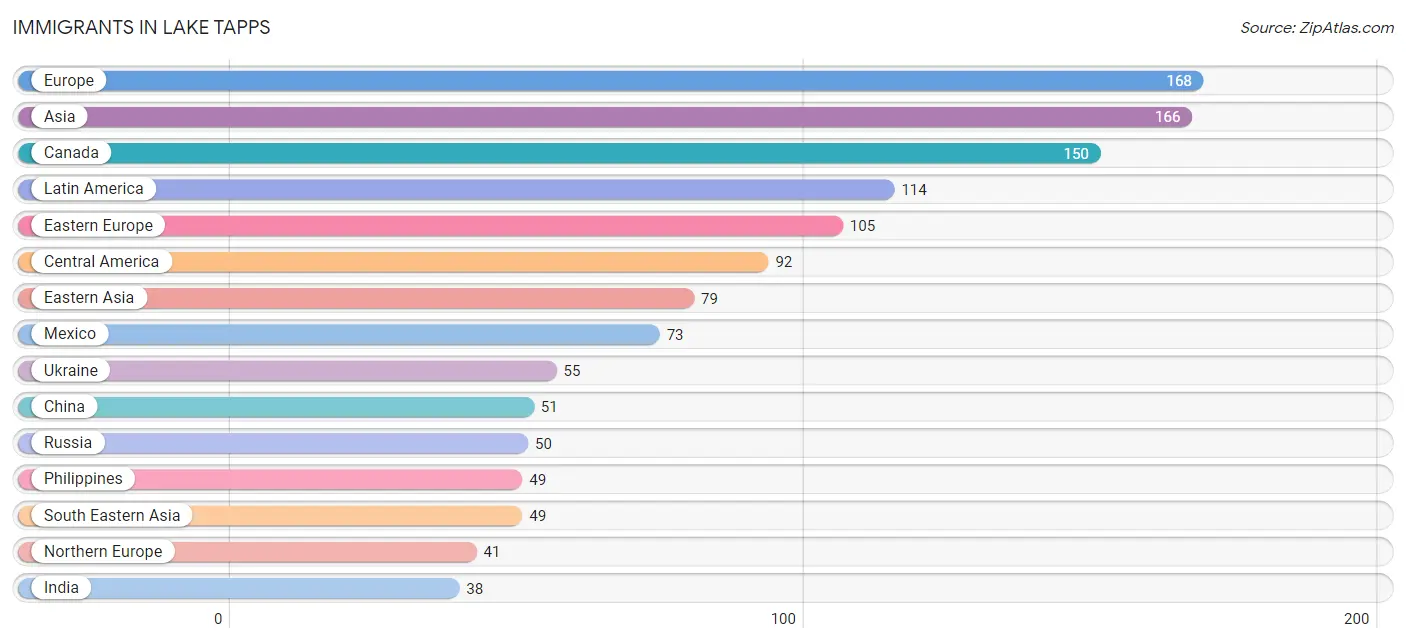
| Immigration Origin | # Population | % Population |
| Asia | 166 | 1.4% |
| Brazil | 14 | 0.1% |
| Canada | 150 | 1.2% |
| Central America | 92 | 0.7% |
| China | 51 | 0.4% |
| Colombia | 8 | 0.1% |
| Costa Rica | 11 | 0.1% |
| Eastern Asia | 79 | 0.6% |
| Eastern Europe | 105 | 0.9% |
| Europe | 168 | 1.4% |
| France | 11 | 0.1% |
| Germany | 11 | 0.1% |
| Guatemala | 8 | 0.1% |
| Hong Kong | 13 | 0.1% |
| India | 38 | 0.3% |
| Japan | 11 | 0.1% |
| Korea | 17 | 0.1% |
| Latin America | 114 | 0.9% |
| Mexico | 73 | 0.6% |
| Northern Europe | 41 | 0.3% |
| Norway | 9 | 0.1% |
| Oceania | 27 | 0.2% |
| Philippines | 49 | 0.4% |
| Russia | 50 | 0.4% |
| South America | 22 | 0.2% |
| South Central Asia | 38 | 0.3% |
| South Eastern Asia | 49 | 0.4% |
| Sweden | 21 | 0.2% |
| Taiwan | 11 | 0.1% |
| Ukraine | 55 | 0.4% |
| Western Europe | 22 | 0.2% | View All 31 Rows |
Sex and Age in Lake Tapps
Sex and Age in Lake Tapps
The most populous age groups in Lake Tapps are 60 to 64 Years (621 | 9.9%) for men and 60 to 64 Years (568 | 9.6%) for women.
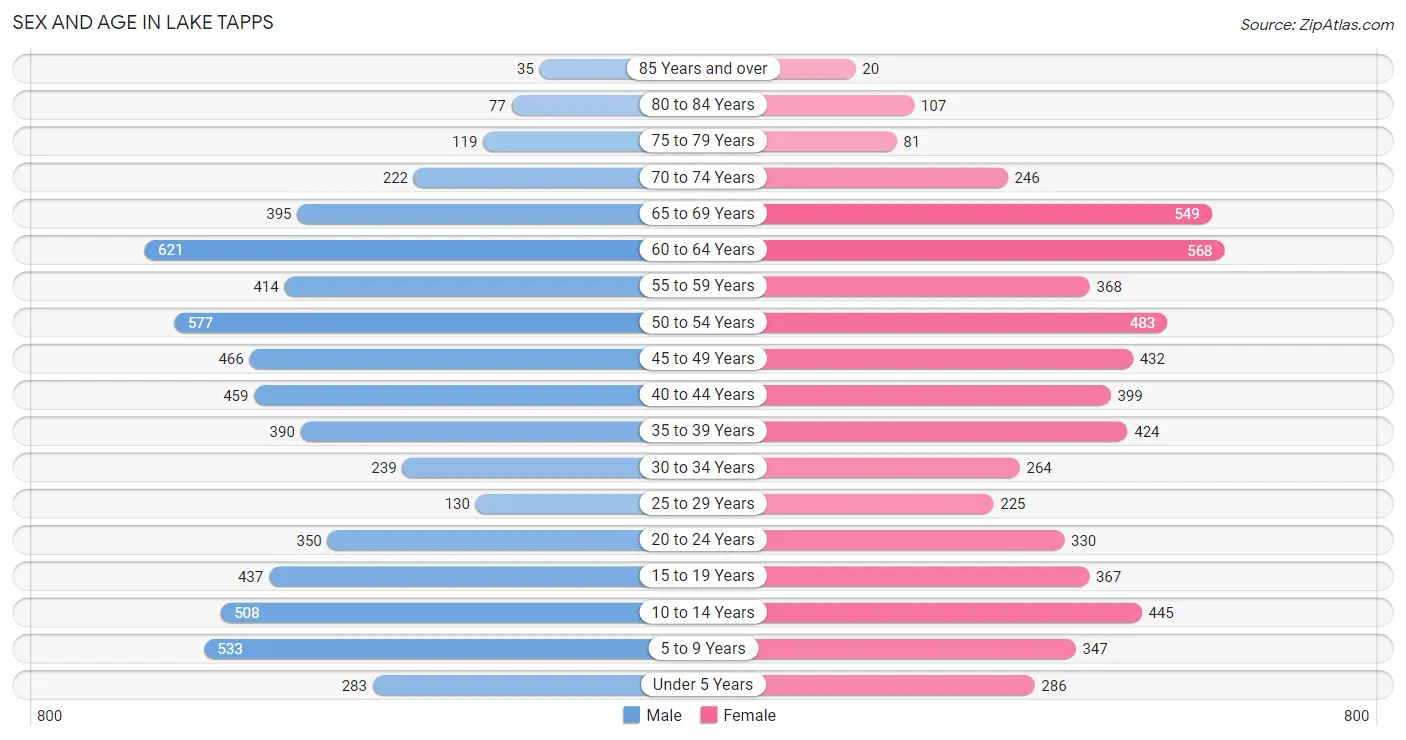
| Age Bracket | Male | Female |
| Under 5 Years | 283 (4.5%) | 286 (4.8%) |
| 5 to 9 Years | 533 (8.5%) | 347 (5.8%) |
| 10 to 14 Years | 508 (8.1%) | 445 (7.5%) |
| 15 to 19 Years | 437 (7.0%) | 367 (6.2%) |
| 20 to 24 Years | 350 (5.6%) | 330 (5.6%) |
| 25 to 29 Years | 130 (2.1%) | 225 (3.8%) |
| 30 to 34 Years | 239 (3.8%) | 264 (4.4%) |
| 35 to 39 Years | 390 (6.2%) | 424 (7.1%) |
| 40 to 44 Years | 459 (7.3%) | 399 (6.7%) |
| 45 to 49 Years | 466 (7.4%) | 432 (7.3%) |
| 50 to 54 Years | 577 (9.2%) | 483 (8.1%) |
| 55 to 59 Years | 414 (6.6%) | 368 (6.2%) |
| 60 to 64 Years | 621 (9.9%) | 568 (9.6%) |
| 65 to 69 Years | 395 (6.3%) | 549 (9.2%) |
| 70 to 74 Years | 222 (3.5%) | 246 (4.1%) |
| 75 to 79 Years | 119 (1.9%) | 81 (1.4%) |
| 80 to 84 Years | 77 (1.2%) | 107 (1.8%) |
| 85 Years and over | 35 (0.6%) | 20 (0.3%) |
| Total | 6,255 (100.0%) | 5,941 (100.0%) |
Families and Households in Lake Tapps
Median Family Size in Lake Tapps
The median family size in Lake Tapps is 3.12 persons per family, with single male/father families (165 | 4.8%) accounting for the largest median family size of 3.75 persons per family. On the other hand, single female/mother families (188 | 5.5%) represent the smallest median family size with 2.61 persons per family.
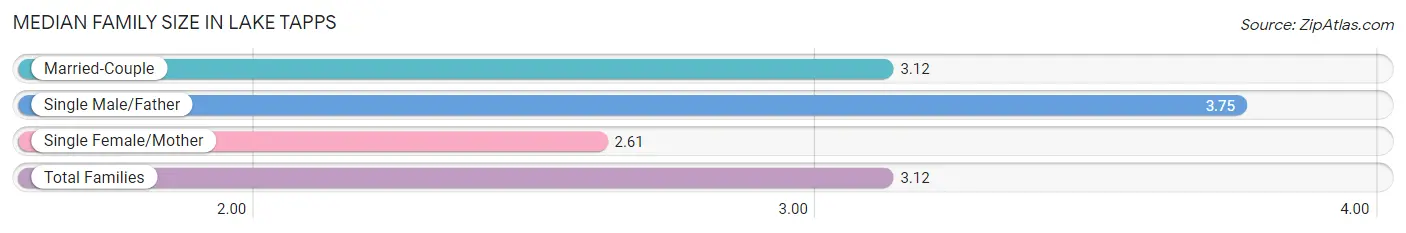
| Family Type | # Families | Family Size |
| Married-Couple | 3,065 (89.7%) | 3.12 |
| Single Male/Father | 165 (4.8%) | 3.75 |
| Single Female/Mother | 188 (5.5%) | 2.61 |
| Total Families | 3,418 (100.0%) | 3.12 |
Median Household Size in Lake Tapps
The median household size in Lake Tapps is 2.77 persons per household, with single male/father households (165 | 3.7%) accounting for the largest median household size of 4.07 persons per household. non-family households (985 | 22.4%) represent the smallest median household size with 1.26 persons per household.
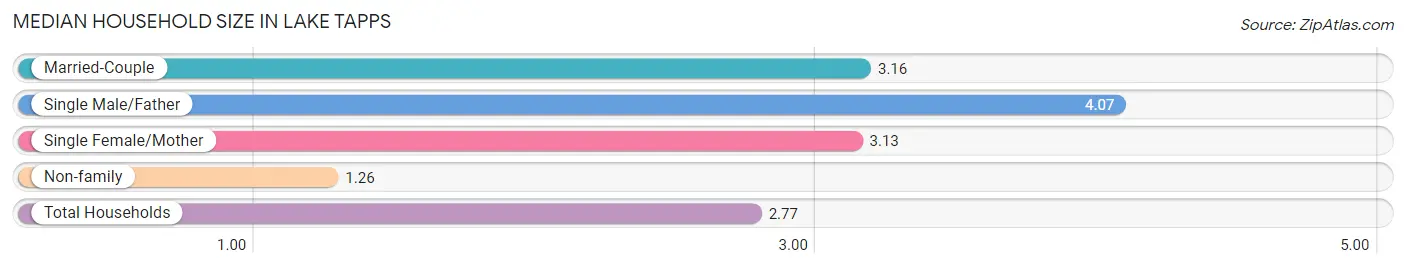
| Household Type | # Households | Household Size |
| Married-Couple | 3,065 (69.6%) | 3.16 |
| Single Male/Father | 165 (3.7%) | 4.07 |
| Single Female/Mother | 188 (4.3%) | 3.13 |
| Non-family | 985 (22.4%) | 1.26 |
| Total Households | 4,403 (100.0%) | 2.77 |
Household Size by Marriage Status in Lake Tapps
Out of a total of 4,403 households in Lake Tapps, 3,418 (77.6%) are family households, while 985 (22.4%) are nonfamily households. The most numerous type of family households are 2-person households, comprising 1,335, and the most common type of nonfamily households are 1-person households, comprising 840.
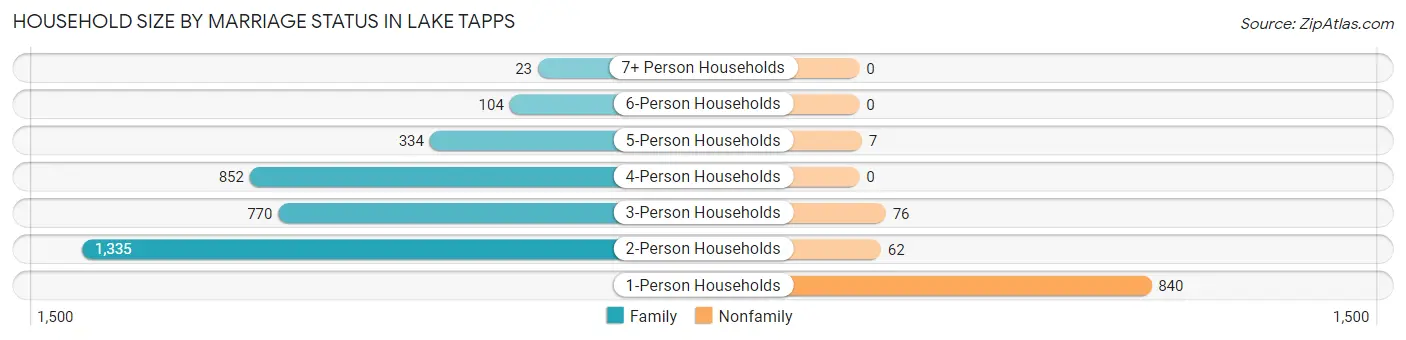
| Household Size | Family Households | Nonfamily Households |
| 1-Person Households | - | 840 (19.1%) |
| 2-Person Households | 1,335 (30.3%) | 62 (1.4%) |
| 3-Person Households | 770 (17.5%) | 76 (1.7%) |
| 4-Person Households | 852 (19.4%) | 0 (0.0%) |
| 5-Person Households | 334 (7.6%) | 7 (0.2%) |
| 6-Person Households | 104 (2.4%) | 0 (0.0%) |
| 7+ Person Households | 23 (0.5%) | 0 (0.0%) |
| Total | 3,418 (77.6%) | 985 (22.4%) |
Female Fertility in Lake Tapps
Fertility by Age in Lake Tapps
Average fertility rate in Lake Tapps is 74.0 births per 1,000 women. Women in the age bracket of 20 to 34 years have the highest fertility rate with 109.0 births per 1,000 women. Women in the age bracket of 35 to 50 years acount for 52.7% of all women with births.
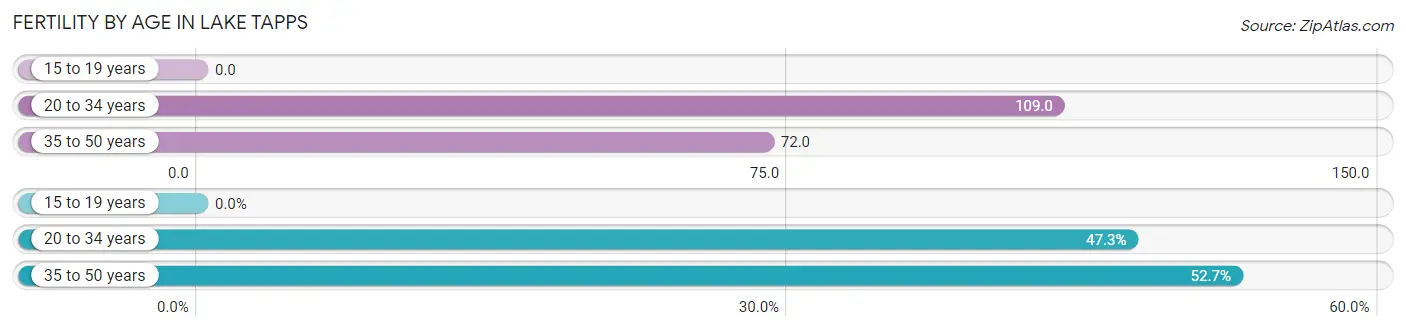
| Age Bracket | Women with Births | Births / 1,000 Women |
| 15 to 19 years | 0 (0.0%) | 0.0 |
| 20 to 34 years | 89 (47.3%) | 109.0 |
| 35 to 50 years | 99 (52.7%) | 72.0 |
| Total | 188 (100.0%) | 74.0 |
Fertility by Age by Marriage Status in Lake Tapps
71.3% of women with births (188) in Lake Tapps are married. The highest percentage of unmarried women with births falls into 20 to 34 years age bracket with 60.7% of them unmarried at the time of birth, while the lowest percentage of unmarried women with births belong to 35 to 50 years age bracket with 0.0% of them unmarried.
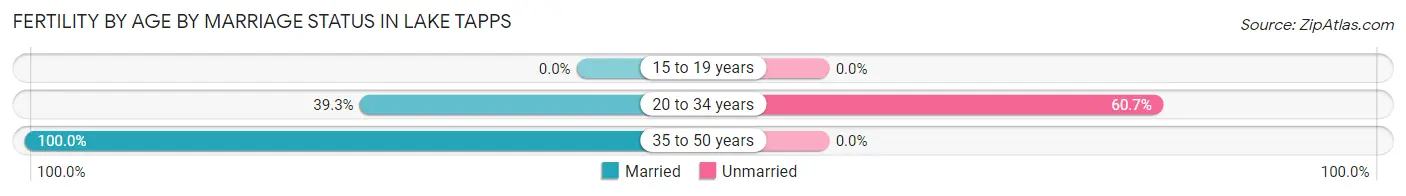
| Age Bracket | Married | Unmarried |
| 15 to 19 years | 0 (0.0%) | 0 (0.0%) |
| 20 to 34 years | 35 (39.3%) | 54 (60.7%) |
| 35 to 50 years | 99 (100.0%) | 0 (0.0%) |
| Total | 134 (71.3%) | 54 (28.7%) |
Fertility by Education in Lake Tapps
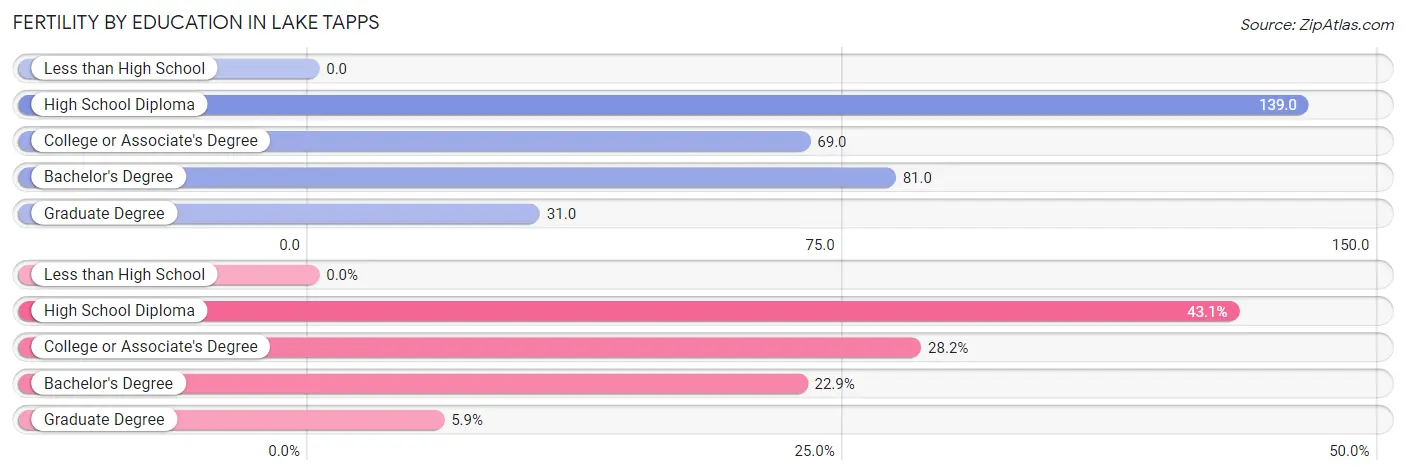
| Educational Attainment | Women with Births | Births / 1,000 Women |
| Less than High School | 0 (0.0%) | 0.0 |
| High School Diploma | 81 (43.1%) | 139.0 |
| College or Associate's Degree | 53 (28.2%) | 69.0 |
| Bachelor's Degree | 43 (22.9%) | 81.0 |
| Graduate Degree | 11 (5.9%) | 31.0 |
| Total | 188 (100.0%) | 74.0 |
Fertility by Education by Marriage Status in Lake Tapps
28.7% of women with births in Lake Tapps are unmarried. Women with the educational attainment of college or associate's degree are most likely to be married with 100.0% of them married at childbirth, while women with the educational attainment of high school diploma are least likely to be married with 66.7% of them unmarried at childbirth.
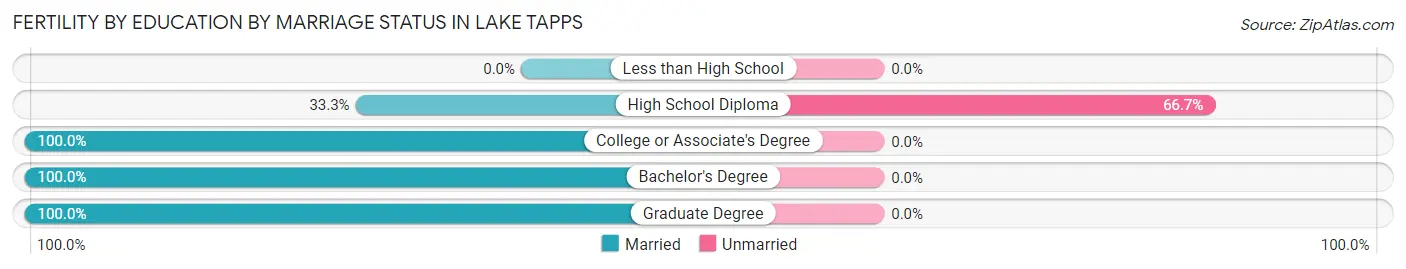
| Educational Attainment | Married | Unmarried |
| Less than High School | 0 (0.0%) | 0 (0.0%) |
| High School Diploma | 27 (33.3%) | 54 (66.7%) |
| College or Associate's Degree | 53 (100.0%) | 0 (0.0%) |
| Bachelor's Degree | 43 (100.0%) | 0 (0.0%) |
| Graduate Degree | 11 (100.0%) | 0 (0.0%) |
| Total | 134 (71.3%) | 54 (28.7%) |
Employment Characteristics in Lake Tapps
Employment by Class of Employer in Lake Tapps
Among the 5,975 employed individuals in Lake Tapps, private company employees (4,012 | 67.1%), local government employees (624 | 10.4%), and self-employed (incorporated) (355 | 5.9%) make up the most common classes of employment.
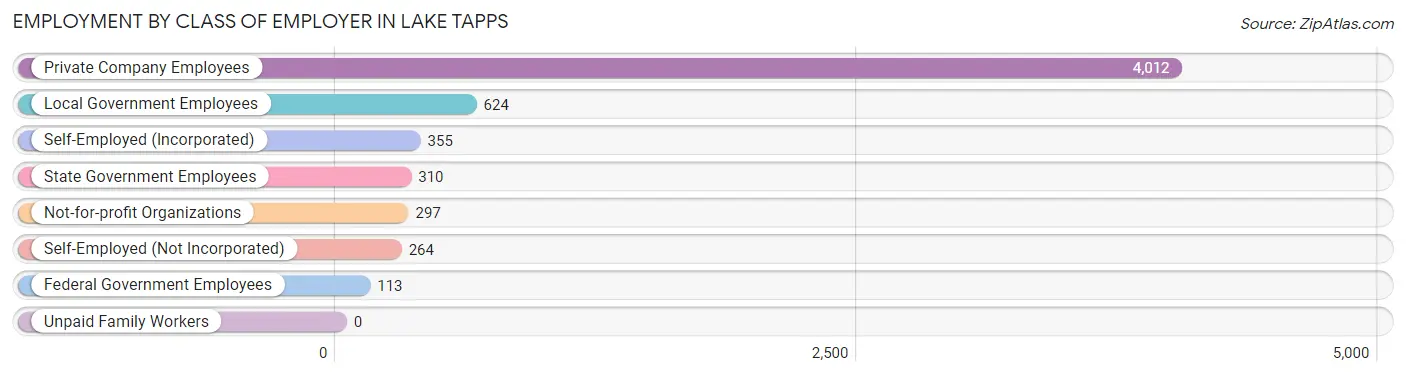
| Employer Class | # Employees | % Employees |
| Private Company Employees | 4,012 | 67.1% |
| Self-Employed (Incorporated) | 355 | 5.9% |
| Self-Employed (Not Incorporated) | 264 | 4.4% |
| Not-for-profit Organizations | 297 | 5.0% |
| Local Government Employees | 624 | 10.4% |
| State Government Employees | 310 | 5.2% |
| Federal Government Employees | 113 | 1.9% |
| Unpaid Family Workers | 0 | 0.0% |
| Total | 5,975 | 100.0% |
Employment Status by Age in Lake Tapps
According to the labor force statistics for Lake Tapps, out of the total population over 16 years of age (9,579), 68.3% or 6,542 individuals are in the labor force, with 3.6% or 236 of them unemployed. The age group with the highest labor force participation rate is 25 to 29 years, with 100.0% or 355 individuals in the labor force. Within the labor force, the 16 to 19 years age range has the highest percentage of unemployed individuals, with 21.0% or 52 of them being unemployed.
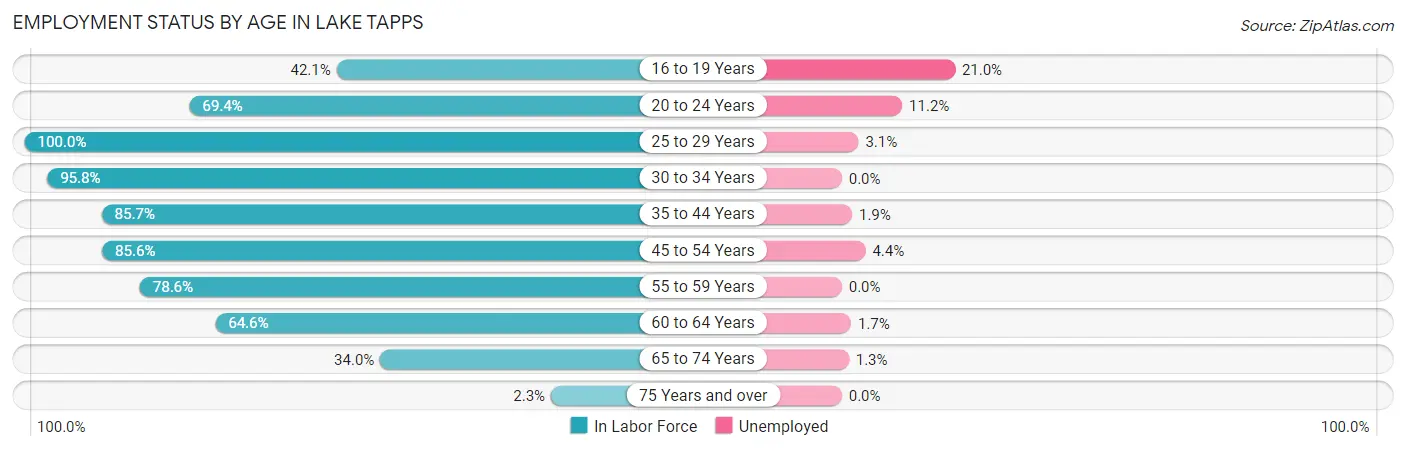
| Age Bracket | In Labor Force | Unemployed |
| 16 to 19 Years | 248 (42.1%) | 52 (21.0%) |
| 20 to 24 Years | 472 (69.4%) | 53 (11.2%) |
| 25 to 29 Years | 355 (100.0%) | 11 (3.1%) |
| 30 to 34 Years | 482 (95.8%) | 0 (0.0%) |
| 35 to 44 Years | 1,433 (85.7%) | 27 (1.9%) |
| 45 to 54 Years | 1,676 (85.6%) | 74 (4.4%) |
| 55 to 59 Years | 615 (78.6%) | 0 (0.0%) |
| 60 to 64 Years | 768 (64.6%) | 13 (1.7%) |
| 65 to 74 Years | 480 (34.0%) | 6 (1.3%) |
| 75 Years and over | 10 (2.3%) | 0 (0.0%) |
| Total | 6,542 (68.3%) | 236 (3.6%) |
Employment Status by Educational Attainment in Lake Tapps
According to labor force statistics for Lake Tapps, 82.5% of individuals (5,329) out of the total population between 25 and 64 years of age (6,459) are in the labor force, with 2.3% or 123 of them being unemployed. The group with the highest labor force participation rate are those with the educational attainment of bachelor's degree or higher, with 84.8% or 2,327 individuals in the labor force. Within the labor force, individuals with high school diploma education have the highest percentage of unemployment, with 3.3% or 33 of them being unemployed.
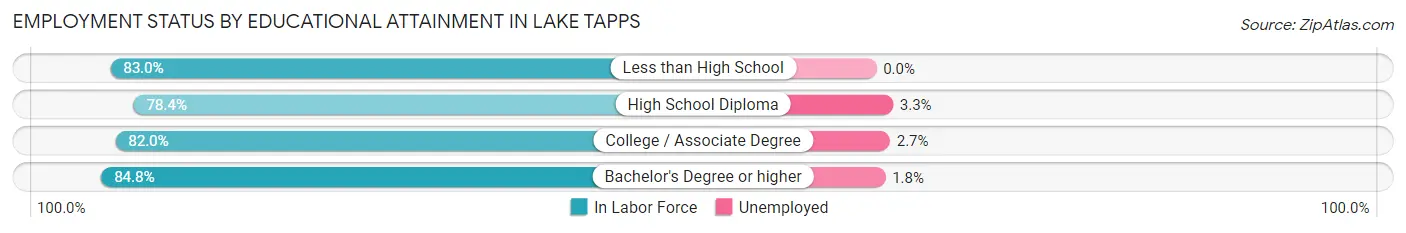
| Educational Attainment | In Labor Force | Unemployed |
| Less than High School | 185 (83.0%) | 0 (0.0%) |
| High School Diploma | 1,011 (78.4%) | 43 (3.3%) |
| College / Associate Degree | 1,806 (82.0%) | 59 (2.7%) |
| Bachelor's Degree or higher | 2,327 (84.8%) | 49 (1.8%) |
| Total | 5,329 (82.5%) | 149 (2.3%) |
Employment Occupations by Sex in Lake Tapps
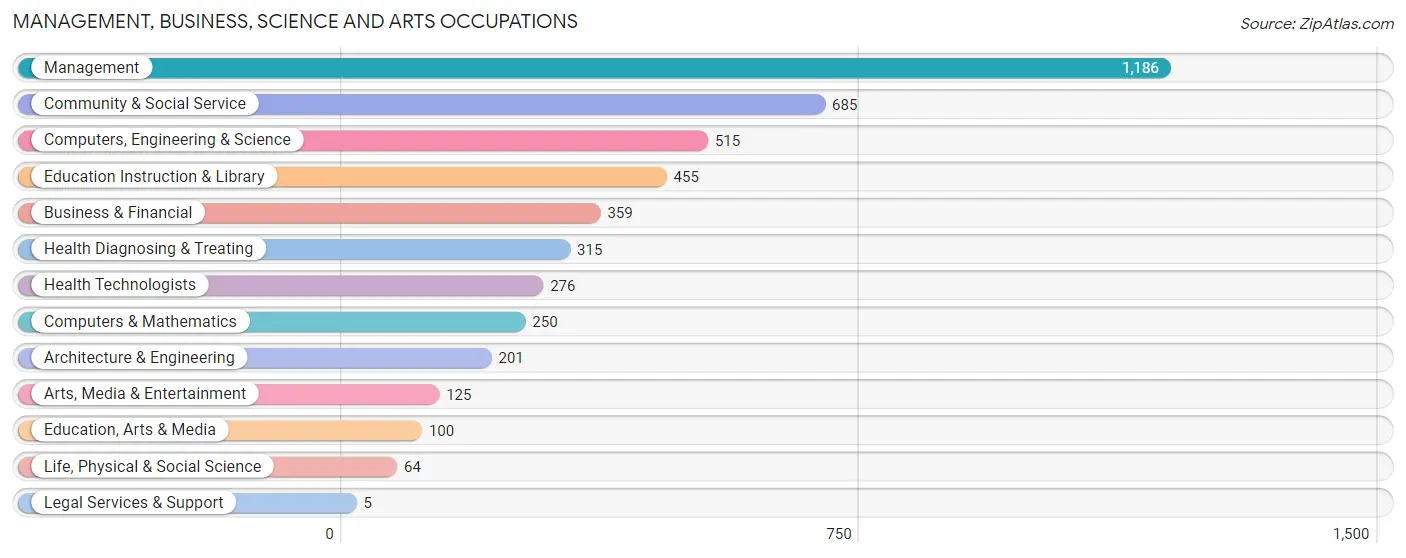
Management, Business, Science and Arts Occupations
The most common Management, Business, Science and Arts occupations in Lake Tapps are Management (1,186 | 18.8%), Community & Social Service (685 | 10.9%), Computers, Engineering & Science (515 | 8.2%), Education Instruction & Library (455 | 7.2%), and Business & Financial (359 | 5.7%).
Management, Business, Science and Arts Occupations by Sex
Within the Management, Business, Science and Arts occupations in Lake Tapps, the most male-oriented occupations are Arts, Media & Entertainment (100.0%), Architecture & Engineering (86.6%), and Computers, Engineering & Science (76.7%), while the most female-oriented occupations are Legal Services & Support (100.0%), Education, Arts & Media (80.0%), and Health Diagnosing & Treating (70.5%).
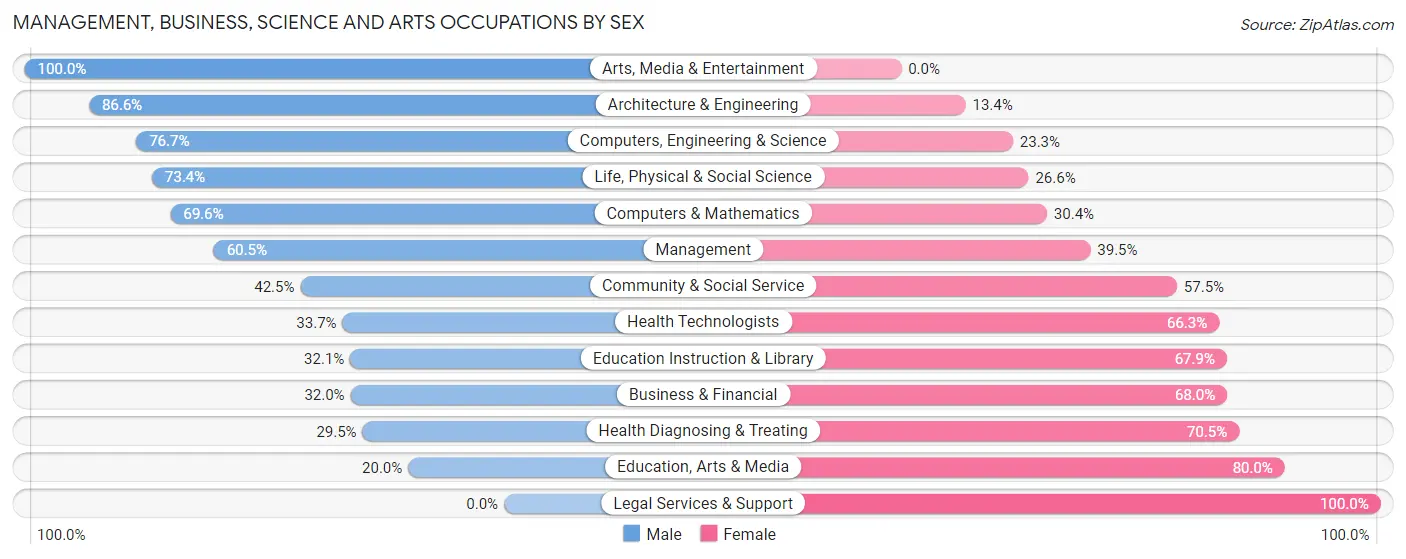
| Occupation | Male | Female |
| Management | 718 (60.5%) | 468 (39.5%) |
| Business & Financial | 115 (32.0%) | 244 (68.0%) |
| Computers, Engineering & Science | 395 (76.7%) | 120 (23.3%) |
| Computers & Mathematics | 174 (69.6%) | 76 (30.4%) |
| Architecture & Engineering | 174 (86.6%) | 27 (13.4%) |
| Life, Physical & Social Science | 47 (73.4%) | 17 (26.6%) |
| Community & Social Service | 291 (42.5%) | 394 (57.5%) |
| Education, Arts & Media | 20 (20.0%) | 80 (80.0%) |
| Legal Services & Support | 0 (0.0%) | 5 (100.0%) |
| Education Instruction & Library | 146 (32.1%) | 309 (67.9%) |
| Arts, Media & Entertainment | 125 (100.0%) | 0 (0.0%) |
| Health Diagnosing & Treating | 93 (29.5%) | 222 (70.5%) |
| Health Technologists | 93 (33.7%) | 183 (66.3%) |
| Total (Category) | 1,612 (52.7%) | 1,448 (47.3%) |
| Total (Overall) | 3,419 (54.2%) | 2,886 (45.8%) |
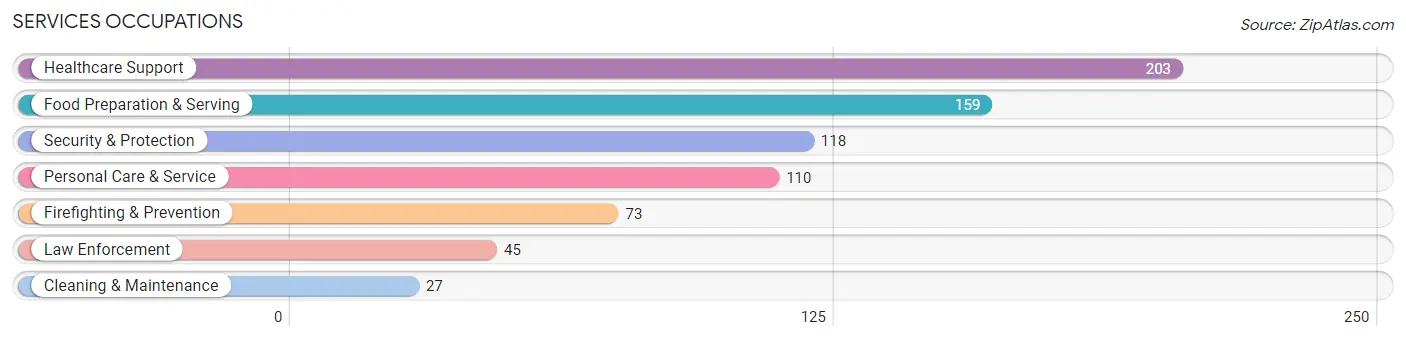
Services Occupations
The most common Services occupations in Lake Tapps are Healthcare Support (203 | 3.2%), Food Preparation & Serving (159 | 2.5%), Security & Protection (118 | 1.9%), Personal Care & Service (110 | 1.7%), and Firefighting & Prevention (73 | 1.2%).
Services Occupations by Sex
Within the Services occupations in Lake Tapps, the most male-oriented occupations are Firefighting & Prevention (94.5%), Security & Protection (91.5%), and Law Enforcement (86.7%), while the most female-oriented occupations are Healthcare Support (90.1%), Personal Care & Service (82.7%), and Food Preparation & Serving (55.3%).
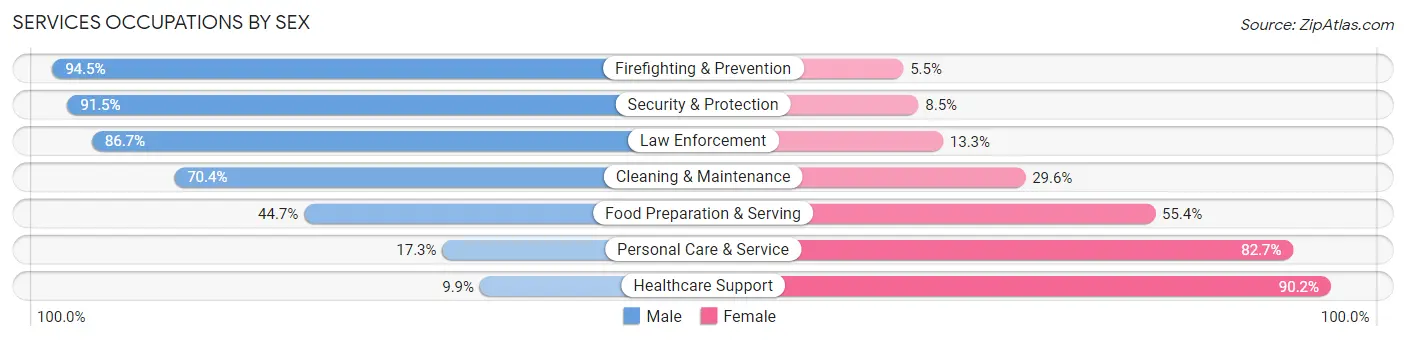
| Occupation | Male | Female |
| Healthcare Support | 20 (9.9%) | 183 (90.1%) |
| Security & Protection | 108 (91.5%) | 10 (8.5%) |
| Firefighting & Prevention | 69 (94.5%) | 4 (5.5%) |
| Law Enforcement | 39 (86.7%) | 6 (13.3%) |
| Food Preparation & Serving | 71 (44.7%) | 88 (55.3%) |
| Cleaning & Maintenance | 19 (70.4%) | 8 (29.6%) |
| Personal Care & Service | 19 (17.3%) | 91 (82.7%) |
| Total (Category) | 237 (38.4%) | 380 (61.6%) |
| Total (Overall) | 3,419 (54.2%) | 2,886 (45.8%) |
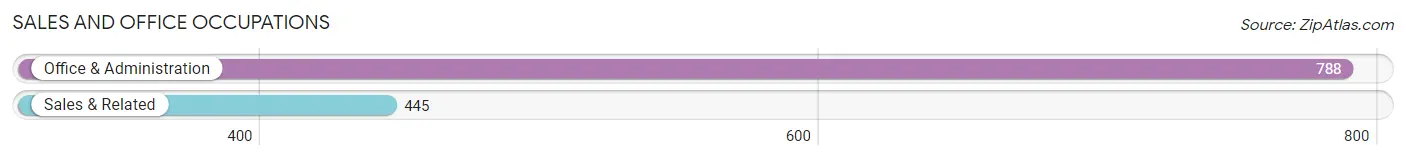
Sales and Office Occupations
The most common Sales and Office occupations in Lake Tapps are Office & Administration (788 | 12.5%), and Sales & Related (445 | 7.1%).
Sales and Office Occupations by Sex
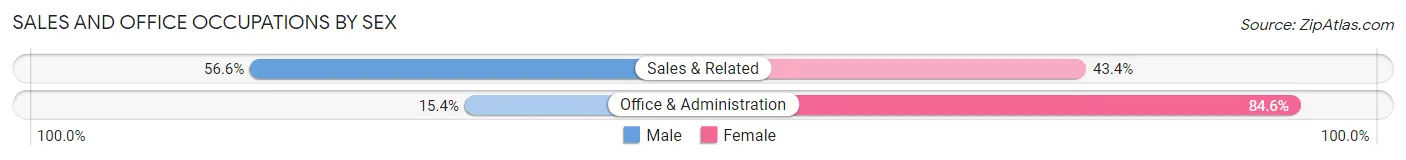
| Occupation | Male | Female |
| Sales & Related | 252 (56.6%) | 193 (43.4%) |
| Office & Administration | 121 (15.4%) | 667 (84.6%) |
| Total (Category) | 373 (30.2%) | 860 (69.8%) |
| Total (Overall) | 3,419 (54.2%) | 2,886 (45.8%) |
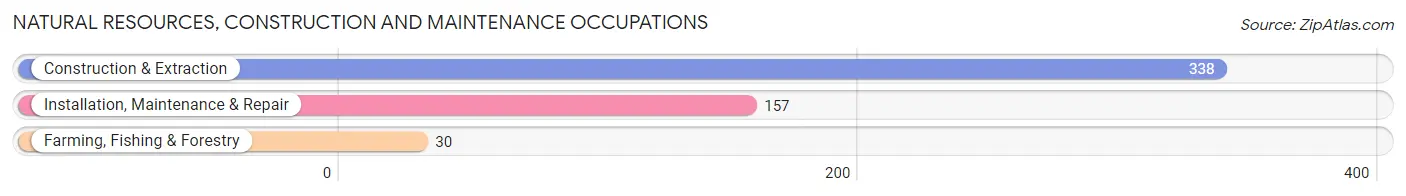
Natural Resources, Construction and Maintenance Occupations
The most common Natural Resources, Construction and Maintenance occupations in Lake Tapps are Construction & Extraction (338 | 5.4%), Installation, Maintenance & Repair (157 | 2.5%), and Farming, Fishing & Forestry (30 | 0.5%).
Natural Resources, Construction and Maintenance Occupations by Sex
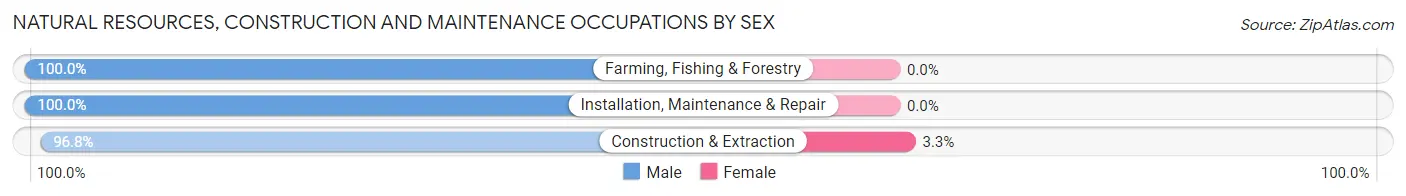
| Occupation | Male | Female |
| Farming, Fishing & Forestry | 30 (100.0%) | 0 (0.0%) |
| Construction & Extraction | 327 (96.8%) | 11 (3.3%) |
| Installation, Maintenance & Repair | 157 (100.0%) | 0 (0.0%) |
| Total (Category) | 514 (97.9%) | 11 (2.1%) |
| Total (Overall) | 3,419 (54.2%) | 2,886 (45.8%) |
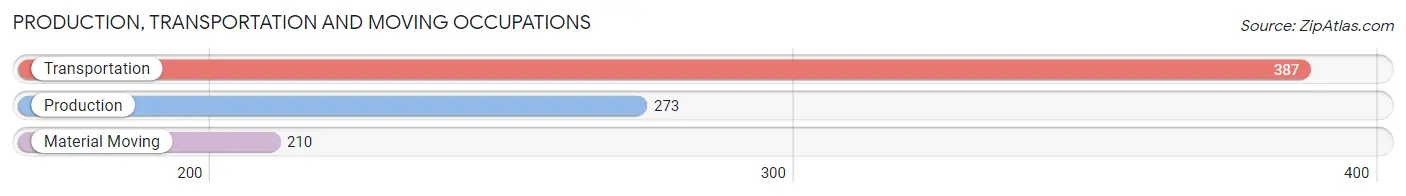
Production, Transportation and Moving Occupations
The most common Production, Transportation and Moving occupations in Lake Tapps are Transportation (387 | 6.1%), Production (273 | 4.3%), and Material Moving (210 | 3.3%).
Production, Transportation and Moving Occupations by Sex
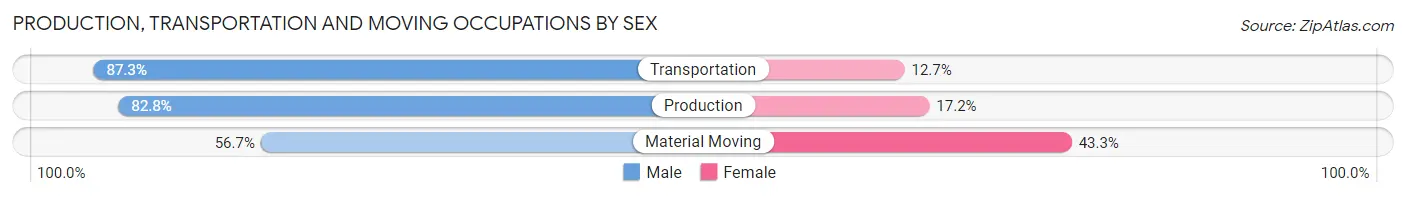
| Occupation | Male | Female |
| Production | 226 (82.8%) | 47 (17.2%) |
| Transportation | 338 (87.3%) | 49 (12.7%) |
| Material Moving | 119 (56.7%) | 91 (43.3%) |
| Total (Category) | 683 (78.5%) | 187 (21.5%) |
| Total (Overall) | 3,419 (54.2%) | 2,886 (45.8%) |
Employment Industries by Sex in Lake Tapps
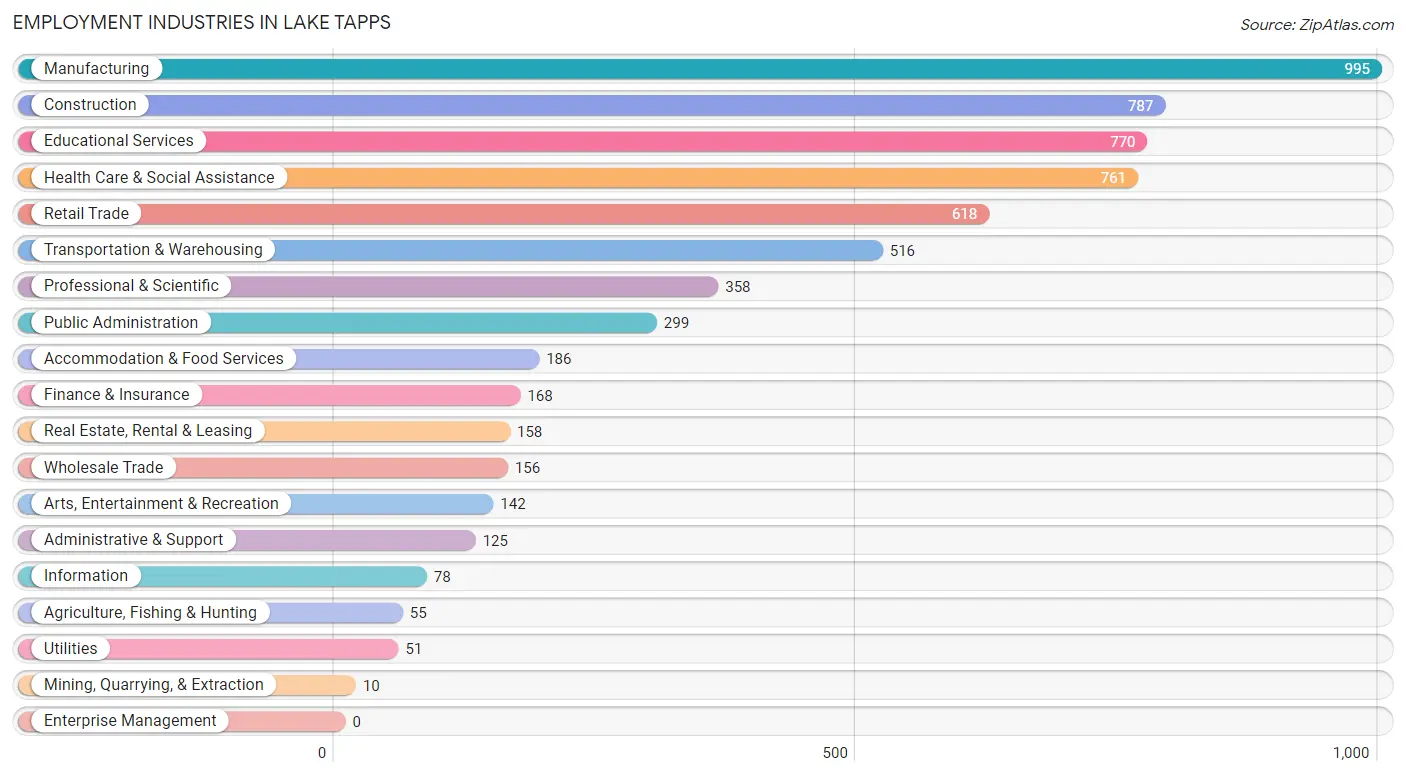
Employment Industries in Lake Tapps
The major employment industries in Lake Tapps include Manufacturing (995 | 15.8%), Construction (787 | 12.5%), Educational Services (770 | 12.2%), Health Care & Social Assistance (761 | 12.1%), and Retail Trade (618 | 9.8%).
Employment Industries by Sex in Lake Tapps
The Lake Tapps industries that see more men than women are Mining, Quarrying, & Extraction (100.0%), Information (87.2%), and Construction (86.4%), whereas the industries that tend to have a higher number of women are Health Care & Social Assistance (80.0%), Educational Services (64.7%), and Finance & Insurance (59.5%).
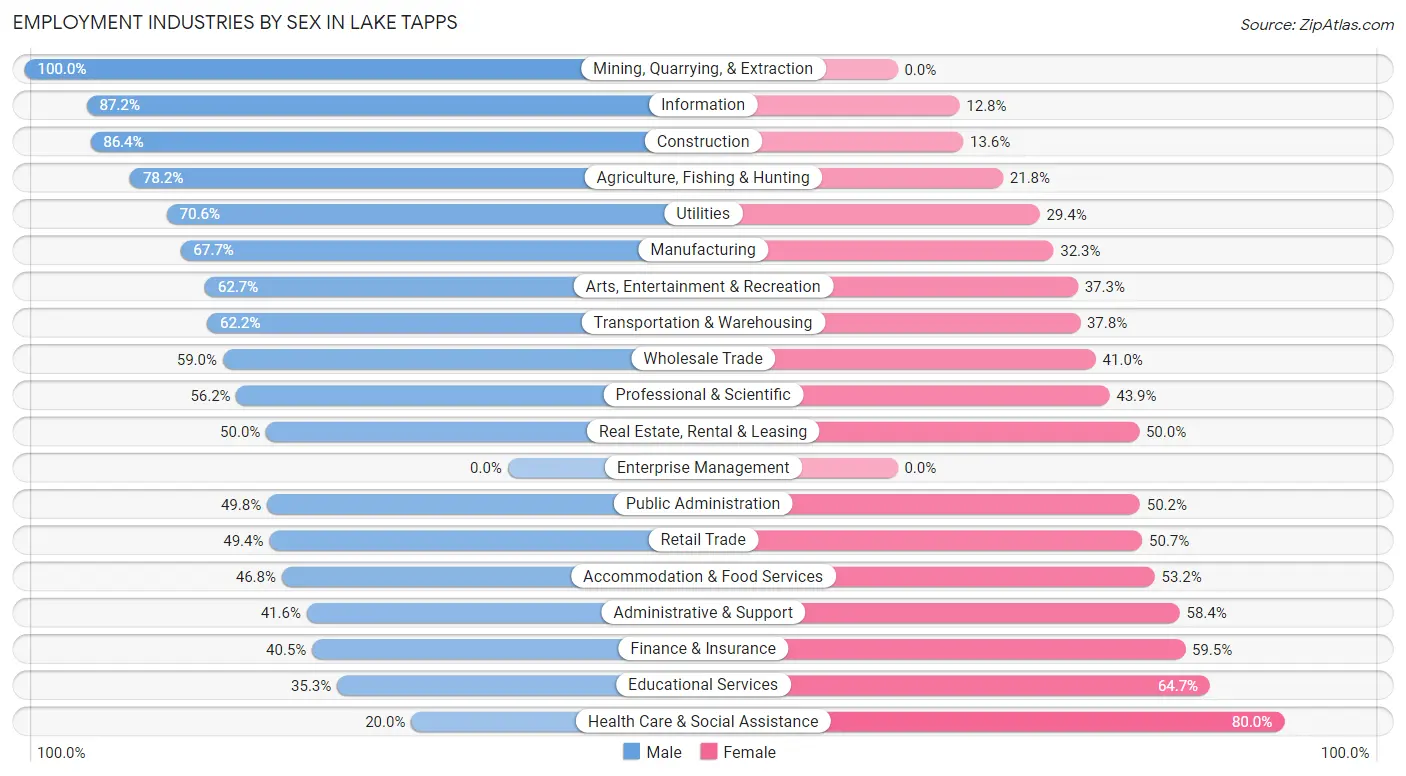
| Industry | Male | Female |
| Agriculture, Fishing & Hunting | 43 (78.2%) | 12 (21.8%) |
| Mining, Quarrying, & Extraction | 10 (100.0%) | 0 (0.0%) |
| Construction | 680 (86.4%) | 107 (13.6%) |
| Manufacturing | 674 (67.7%) | 321 (32.3%) |
| Wholesale Trade | 92 (59.0%) | 64 (41.0%) |
| Retail Trade | 305 (49.3%) | 313 (50.6%) |
| Transportation & Warehousing | 321 (62.2%) | 195 (37.8%) |
| Utilities | 36 (70.6%) | 15 (29.4%) |
| Information | 68 (87.2%) | 10 (12.8%) |
| Finance & Insurance | 68 (40.5%) | 100 (59.5%) |
| Real Estate, Rental & Leasing | 79 (50.0%) | 79 (50.0%) |
| Professional & Scientific | 201 (56.1%) | 157 (43.9%) |
| Enterprise Management | 0 (0.0%) | 0 (0.0%) |
| Administrative & Support | 52 (41.6%) | 73 (58.4%) |
| Educational Services | 272 (35.3%) | 498 (64.7%) |
| Health Care & Social Assistance | 152 (20.0%) | 609 (80.0%) |
| Arts, Entertainment & Recreation | 89 (62.7%) | 53 (37.3%) |
| Accommodation & Food Services | 87 (46.8%) | 99 (53.2%) |
| Public Administration | 149 (49.8%) | 150 (50.2%) |
| Total | 3,419 (54.2%) | 2,886 (45.8%) |
Education in Lake Tapps
School Enrollment in Lake Tapps
The most common levels of schooling among the 2,896 students in Lake Tapps are elementary school (831 | 28.7%), middle school (693 | 23.9%), and high school (685 | 23.6%).
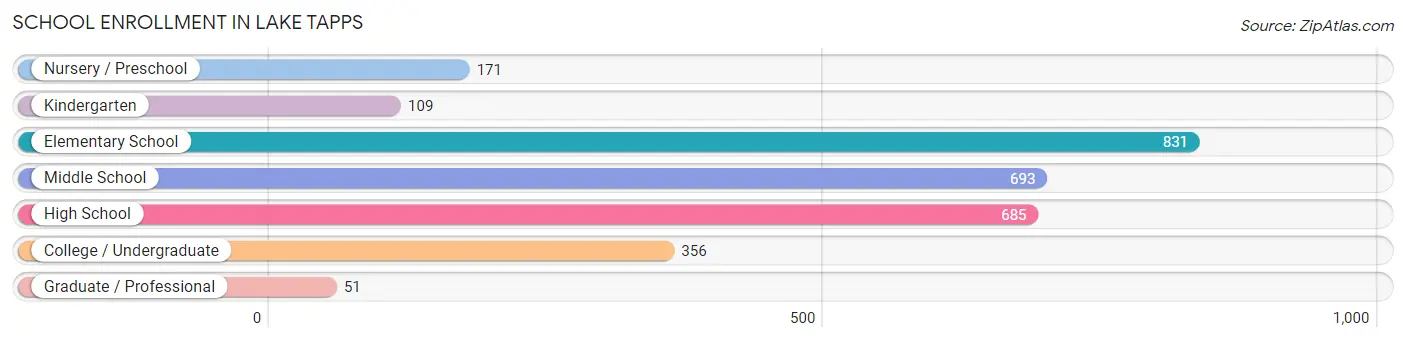
| School Level | # Students | % Students |
| Nursery / Preschool | 171 | 5.9% |
| Kindergarten | 109 | 3.8% |
| Elementary School | 831 | 28.7% |
| Middle School | 693 | 23.9% |
| High School | 685 | 23.6% |
| College / Undergraduate | 356 | 12.3% |
| Graduate / Professional | 51 | 1.8% |
| Total | 2,896 | 100.0% |
School Enrollment by Age by Funding Source in Lake Tapps
Out of a total of 2,896 students who are enrolled in schools in Lake Tapps, 148 (5.1%) attend a private institution, while the remaining 2,748 (94.9%) are enrolled in public schools. The age group of 3 to 4 year olds has the highest likelihood of being enrolled in private schools, with 61 (46.9% in the age bracket) enrolled. Conversely, the age group of 10 to 14 year olds has the lowest likelihood of being enrolled in a private school, with 909 (100.0% in the age bracket) attending a public institution.
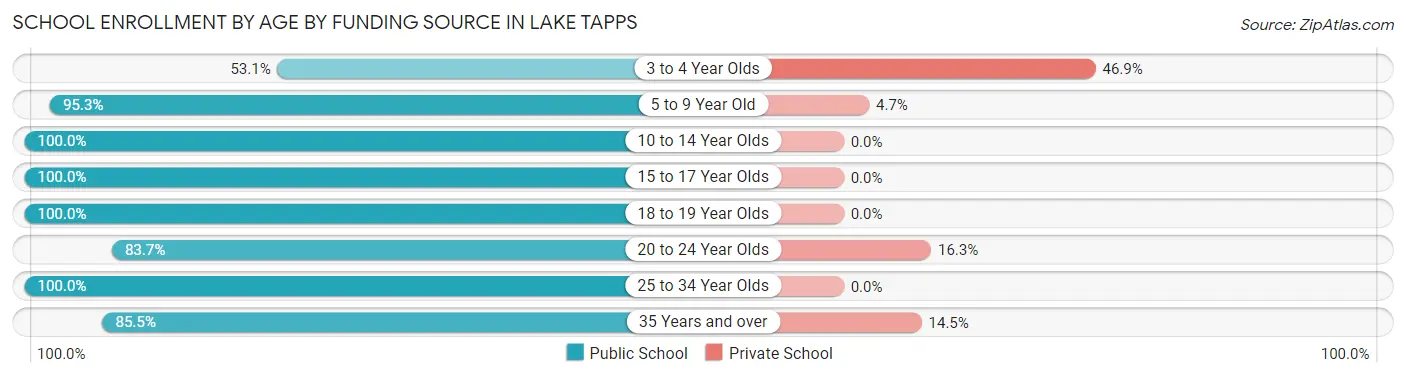
| Age Bracket | Public School | Private School |
| 3 to 4 Year Olds | 69 (53.1%) | 61 (46.9%) |
| 5 to 9 Year Old | 825 (95.3%) | 41 (4.7%) |
| 10 to 14 Year Olds | 909 (100.0%) | 0 (0.0%) |
| 15 to 17 Year Olds | 465 (100.0%) | 0 (0.0%) |
| 18 to 19 Year Olds | 211 (100.0%) | 0 (0.0%) |
| 20 to 24 Year Olds | 144 (83.7%) | 28 (16.3%) |
| 25 to 34 Year Olds | 19 (100.0%) | 0 (0.0%) |
| 35 Years and over | 106 (85.5%) | 18 (14.5%) |
| Total | 2,748 (94.9%) | 148 (5.1%) |
Educational Attainment by Field of Study in Lake Tapps
Business (693 | 19.4%), education (481 | 13.5%), social sciences (378 | 10.6%), engineering (304 | 8.5%), and bio, nature & agricultural (277 | 7.8%) are the most common fields of study among 3,570 individuals in Lake Tapps who have obtained a bachelor's degree or higher.
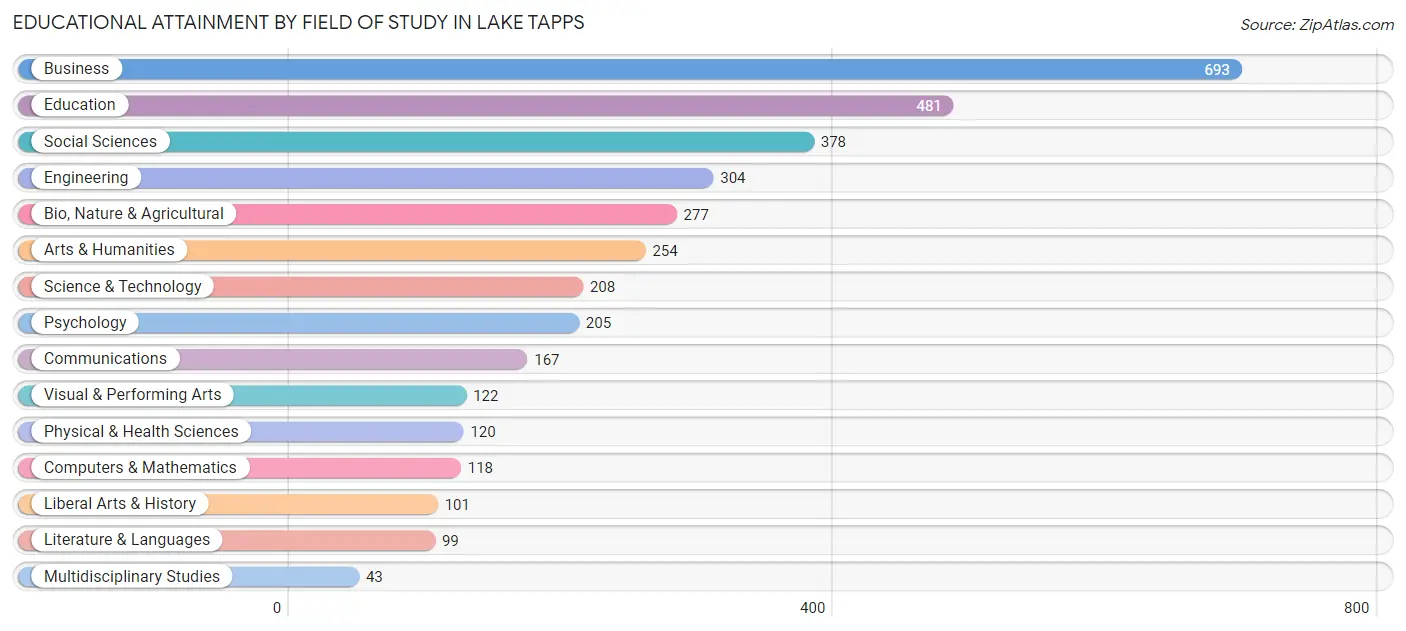
| Field of Study | # Graduates | % Graduates |
| Computers & Mathematics | 118 | 3.3% |
| Bio, Nature & Agricultural | 277 | 7.8% |
| Physical & Health Sciences | 120 | 3.4% |
| Psychology | 205 | 5.7% |
| Social Sciences | 378 | 10.6% |
| Engineering | 304 | 8.5% |
| Multidisciplinary Studies | 43 | 1.2% |
| Science & Technology | 208 | 5.8% |
| Business | 693 | 19.4% |
| Education | 481 | 13.5% |
| Literature & Languages | 99 | 2.8% |
| Liberal Arts & History | 101 | 2.8% |
| Visual & Performing Arts | 122 | 3.4% |
| Communications | 167 | 4.7% |
| Arts & Humanities | 254 | 7.1% |
| Total | 3,570 | 100.0% |
Transportation & Commute in Lake Tapps
Vehicle Availability by Sex in Lake Tapps
The most prevalent vehicle ownership categories in Lake Tapps are males with 3 vehicles (1,207, accounting for 36.5%) and females with 3 vehicles (989, making up 45.2%).
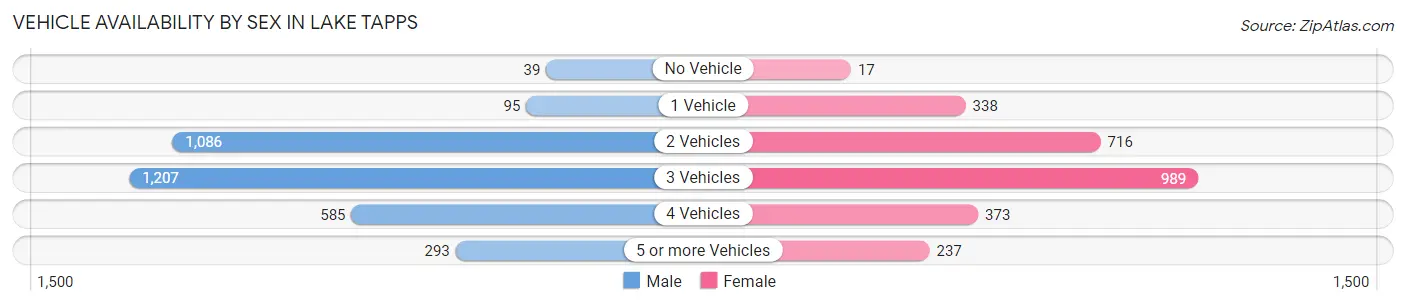
| Vehicles Available | Male | Female |
| No Vehicle | 39 (1.2%) | 17 (0.6%) |
| 1 Vehicle | 95 (2.9%) | 338 (12.7%) |
| 2 Vehicles | 1,086 (32.9%) | 716 (26.8%) |
| 3 Vehicles | 1,207 (36.5%) | 989 (37.0%) |
| 4 Vehicles | 585 (17.7%) | 373 (14.0%) |
| 5 or more Vehicles | 293 (8.9%) | 237 (8.9%) |
| Total | 3,305 (100.0%) | 2,670 (100.0%) |
Commute Time in Lake Tapps
The most frequently occuring commute durations in Lake Tapps are 30 to 34 minutes (754 commuters, 14.7%), 20 to 24 minutes (733 commuters, 14.3%), and 45 to 59 minutes (695 commuters, 13.6%).
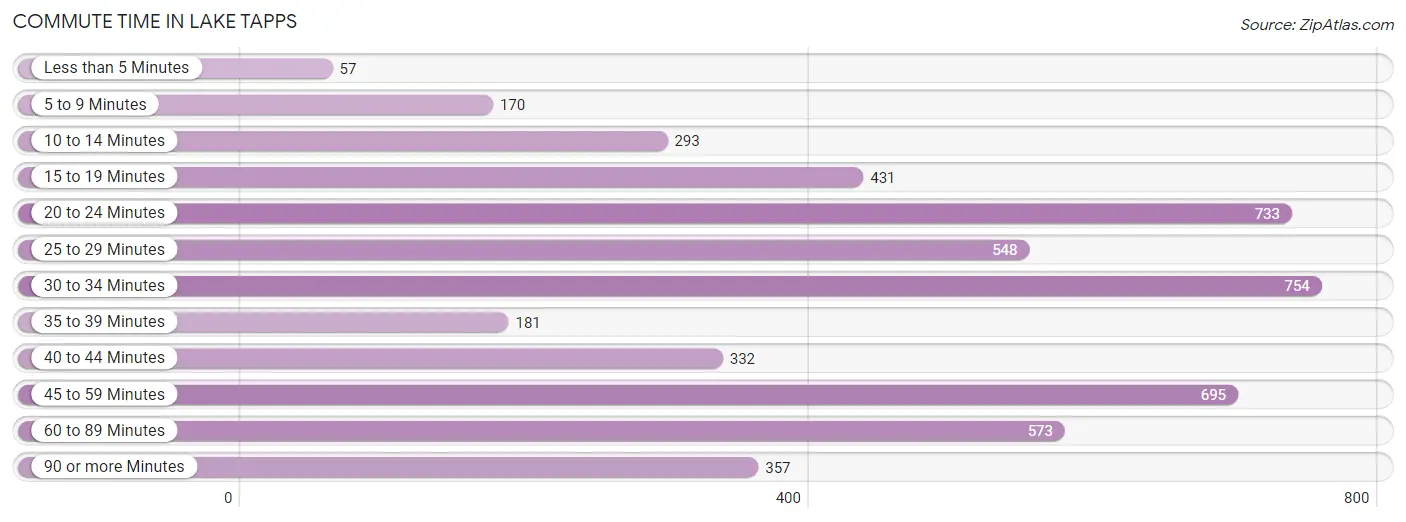
| Commute Time | # Commuters | % Commuters |
| Less than 5 Minutes | 57 | 1.1% |
| 5 to 9 Minutes | 170 | 3.3% |
| 10 to 14 Minutes | 293 | 5.7% |
| 15 to 19 Minutes | 431 | 8.4% |
| 20 to 24 Minutes | 733 | 14.3% |
| 25 to 29 Minutes | 548 | 10.7% |
| 30 to 34 Minutes | 754 | 14.7% |
| 35 to 39 Minutes | 181 | 3.5% |
| 40 to 44 Minutes | 332 | 6.5% |
| 45 to 59 Minutes | 695 | 13.6% |
| 60 to 89 Minutes | 573 | 11.2% |
| 90 or more Minutes | 357 | 7.0% |
Commute Time by Sex in Lake Tapps
The most common commute times in Lake Tapps are 45 to 59 minutes (479 commuters, 16.2%) for males and 30 to 34 minutes (385 commuters, 17.8%) for females.
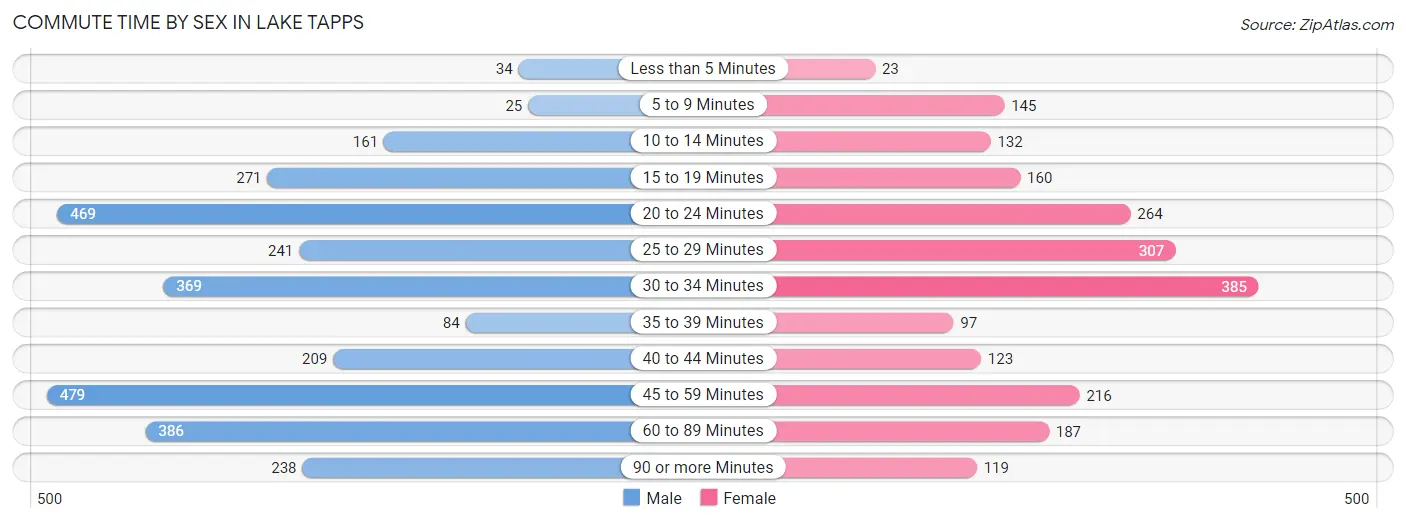
| Commute Time | Male | Female |
| Less than 5 Minutes | 34 (1.1%) | 23 (1.1%) |
| 5 to 9 Minutes | 25 (0.8%) | 145 (6.7%) |
| 10 to 14 Minutes | 161 (5.4%) | 132 (6.1%) |
| 15 to 19 Minutes | 271 (9.1%) | 160 (7.4%) |
| 20 to 24 Minutes | 469 (15.8%) | 264 (12.2%) |
| 25 to 29 Minutes | 241 (8.1%) | 307 (14.2%) |
| 30 to 34 Minutes | 369 (12.4%) | 385 (17.8%) |
| 35 to 39 Minutes | 84 (2.8%) | 97 (4.5%) |
| 40 to 44 Minutes | 209 (7.0%) | 123 (5.7%) |
| 45 to 59 Minutes | 479 (16.2%) | 216 (10.0%) |
| 60 to 89 Minutes | 386 (13.0%) | 187 (8.7%) |
| 90 or more Minutes | 238 (8.0%) | 119 (5.5%) |
Time of Departure to Work by Sex in Lake Tapps
The most frequent times of departure to work in Lake Tapps are 6:00 AM to 6:29 AM (508, 17.1%) for males and 8:00 AM to 8:29 AM (452, 20.9%) for females.
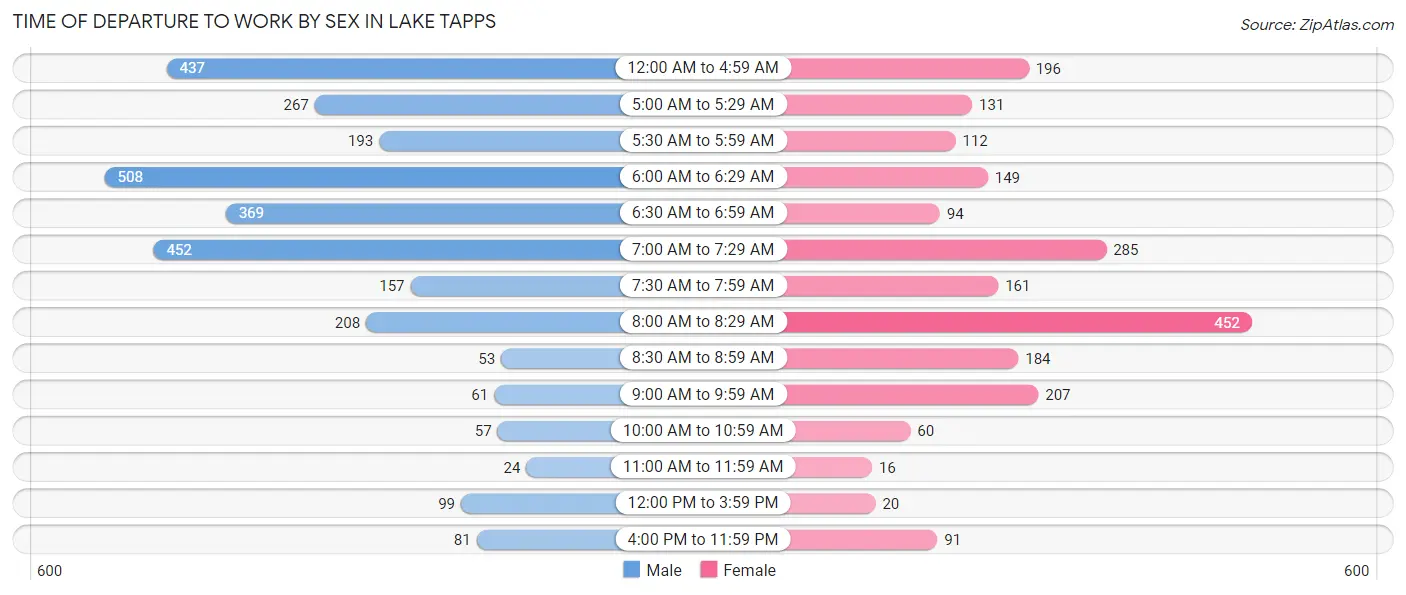
| Time of Departure | Male | Female |
| 12:00 AM to 4:59 AM | 437 (14.7%) | 196 (9.1%) |
| 5:00 AM to 5:29 AM | 267 (9.0%) | 131 (6.1%) |
| 5:30 AM to 5:59 AM | 193 (6.5%) | 112 (5.2%) |
| 6:00 AM to 6:29 AM | 508 (17.1%) | 149 (6.9%) |
| 6:30 AM to 6:59 AM | 369 (12.4%) | 94 (4.4%) |
| 7:00 AM to 7:29 AM | 452 (15.2%) | 285 (13.2%) |
| 7:30 AM to 7:59 AM | 157 (5.3%) | 161 (7.5%) |
| 8:00 AM to 8:29 AM | 208 (7.0%) | 452 (20.9%) |
| 8:30 AM to 8:59 AM | 53 (1.8%) | 184 (8.5%) |
| 9:00 AM to 9:59 AM | 61 (2.1%) | 207 (9.6%) |
| 10:00 AM to 10:59 AM | 57 (1.9%) | 60 (2.8%) |
| 11:00 AM to 11:59 AM | 24 (0.8%) | 16 (0.7%) |
| 12:00 PM to 3:59 PM | 99 (3.3%) | 20 (0.9%) |
| 4:00 PM to 11:59 PM | 81 (2.7%) | 91 (4.2%) |
| Total | 2,966 (100.0%) | 2,158 (100.0%) |
Housing Occupancy in Lake Tapps
Occupancy by Ownership in Lake Tapps
Of the total 4,403 dwellings in Lake Tapps, owner-occupied units account for 4,061 (92.2%), while renter-occupied units make up 342 (7.8%).
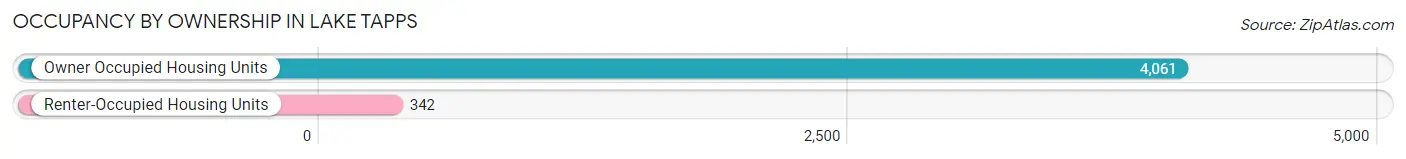
| Occupancy | # Housing Units | % Housing Units |
| Owner Occupied Housing Units | 4,061 | 92.2% |
| Renter-Occupied Housing Units | 342 | 7.8% |
| Total Occupied Housing Units | 4,403 | 100.0% |
Occupancy by Household Size in Lake Tapps
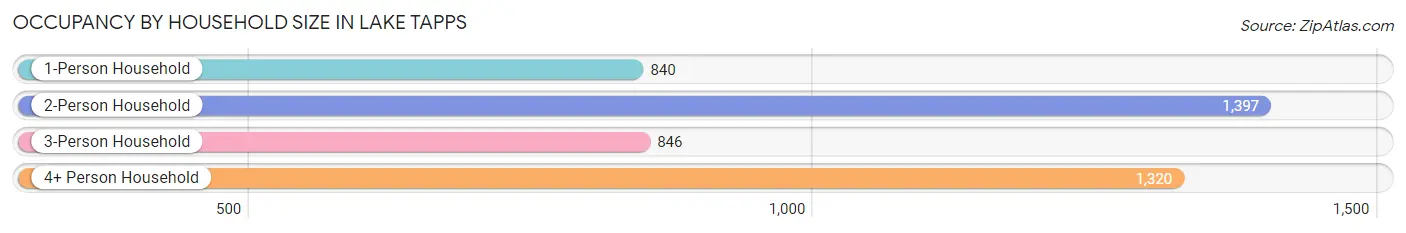
| Household Size | # Housing Units | % Housing Units |
| 1-Person Household | 840 | 19.1% |
| 2-Person Household | 1,397 | 31.7% |
| 3-Person Household | 846 | 19.2% |
| 4+ Person Household | 1,320 | 30.0% |
| Total Housing Units | 4,403 | 100.0% |
Occupancy by Ownership by Household Size in Lake Tapps
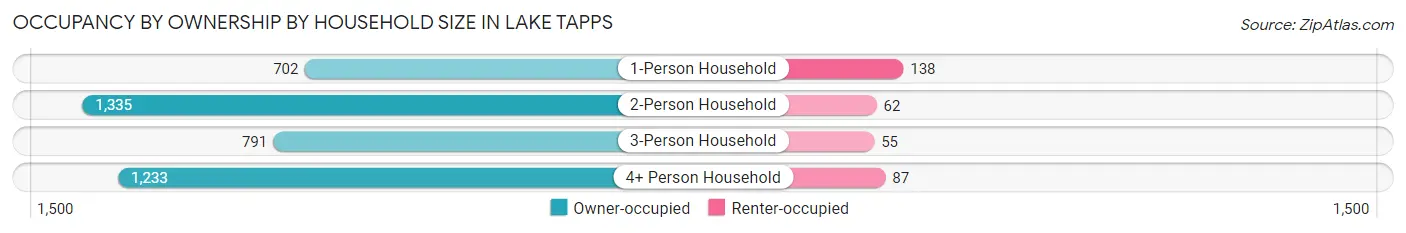
| Household Size | Owner-occupied | Renter-occupied |
| 1-Person Household | 702 (83.6%) | 138 (16.4%) |
| 2-Person Household | 1,335 (95.6%) | 62 (4.4%) |
| 3-Person Household | 791 (93.5%) | 55 (6.5%) |
| 4+ Person Household | 1,233 (93.4%) | 87 (6.6%) |
| Total Housing Units | 4,061 (92.2%) | 342 (7.8%) |
Occupancy by Educational Attainment in Lake Tapps
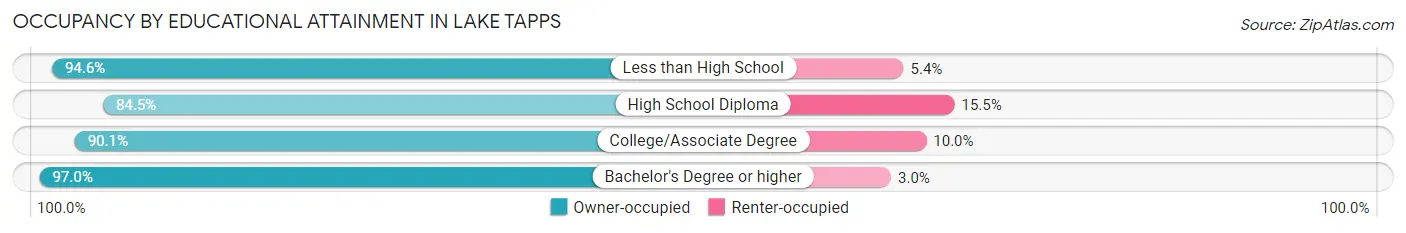
| Household Size | Owner-occupied | Renter-occupied |
| Less than High School | 122 (94.6%) | 7 (5.4%) |
| High School Diploma | 598 (84.5%) | 110 (15.5%) |
| College/Associate Degree | 1,538 (90.0%) | 170 (10.0%) |
| Bachelor's Degree or higher | 1,803 (97.0%) | 55 (3.0%) |
Occupancy by Age of Householder in Lake Tapps
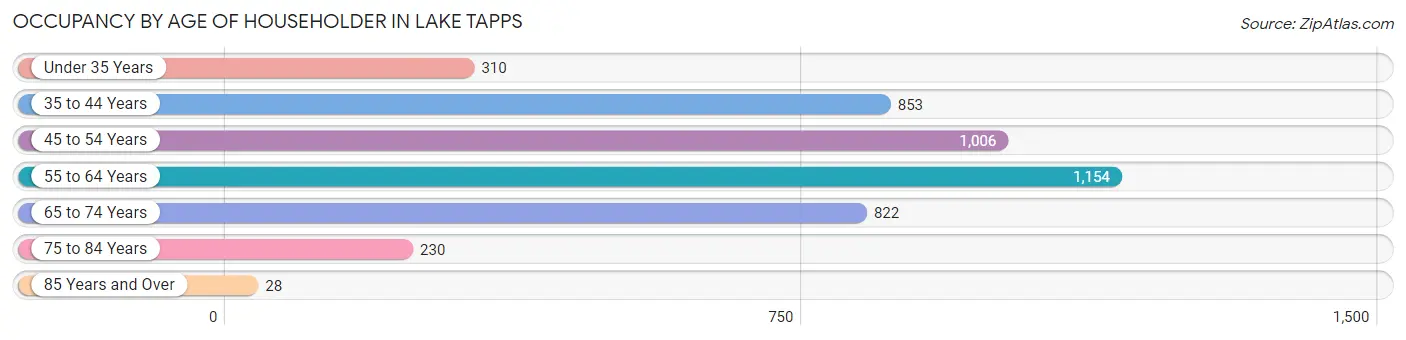
| Age Bracket | # Households | % Households |
| Under 35 Years | 310 | 7.0% |
| 35 to 44 Years | 853 | 19.4% |
| 45 to 54 Years | 1,006 | 22.9% |
| 55 to 64 Years | 1,154 | 26.2% |
| 65 to 74 Years | 822 | 18.7% |
| 75 to 84 Years | 230 | 5.2% |
| 85 Years and Over | 28 | 0.6% |
| Total | 4,403 | 100.0% |
Housing Finances in Lake Tapps
Median Income by Occupancy in Lake Tapps
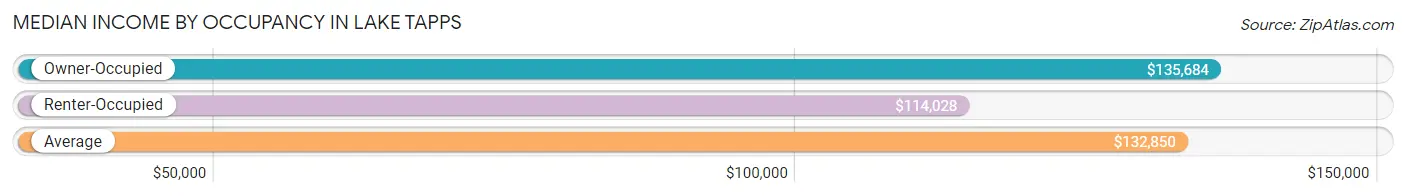
| Occupancy Type | # Households | Median Income |
| Owner-Occupied | 4,061 (92.2%) | $135,684 |
| Renter-Occupied | 342 (7.8%) | $114,028 |
| Average | 4,403 (100.0%) | $132,850 |
Occupancy by Householder Income Bracket in Lake Tapps
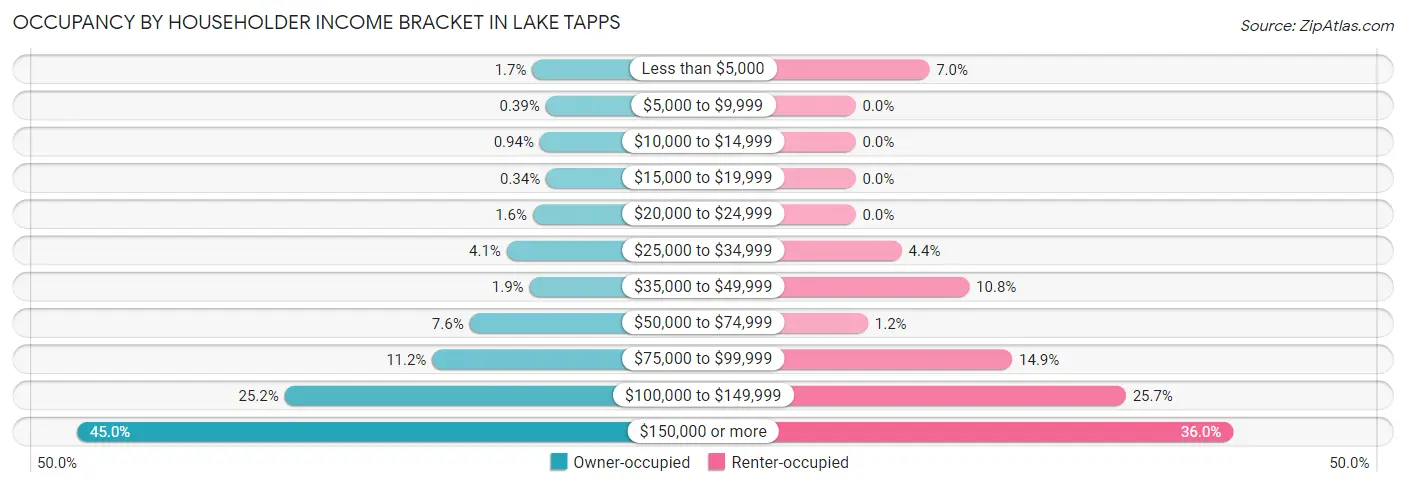
| Income Bracket | Owner-occupied | Renter-occupied |
| Less than $5,000 | 67 (1.7%) | 24 (7.0%) |
| $5,000 to $9,999 | 16 (0.4%) | 0 (0.0%) |
| $10,000 to $14,999 | 38 (0.9%) | 0 (0.0%) |
| $15,000 to $19,999 | 14 (0.3%) | 0 (0.0%) |
| $20,000 to $24,999 | 65 (1.6%) | 0 (0.0%) |
| $25,000 to $34,999 | 166 (4.1%) | 15 (4.4%) |
| $35,000 to $49,999 | 78 (1.9%) | 37 (10.8%) |
| $50,000 to $74,999 | 310 (7.6%) | 4 (1.2%) |
| $75,000 to $99,999 | 454 (11.2%) | 51 (14.9%) |
| $100,000 to $149,999 | 1,025 (25.2%) | 88 (25.7%) |
| $150,000 or more | 1,828 (45.0%) | 123 (36.0%) |
| Total | 4,061 (100.0%) | 342 (100.0%) |
Monthly Housing Cost Tiers in Lake Tapps
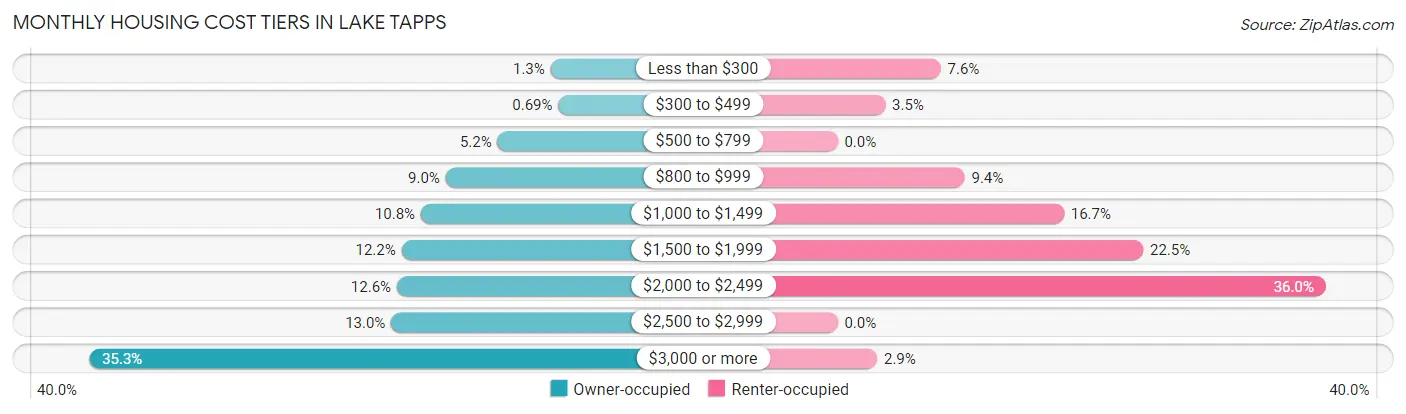
| Monthly Cost | Owner-occupied | Renter-occupied |
| Less than $300 | 51 (1.3%) | 26 (7.6%) |
| $300 to $499 | 28 (0.7%) | 12 (3.5%) |
| $500 to $799 | 210 (5.2%) | 0 (0.0%) |
| $800 to $999 | 365 (9.0%) | 32 (9.4%) |
| $1,000 to $1,499 | 439 (10.8%) | 57 (16.7%) |
| $1,500 to $1,999 | 497 (12.2%) | 77 (22.5%) |
| $2,000 to $2,499 | 511 (12.6%) | 123 (36.0%) |
| $2,500 to $2,999 | 528 (13.0%) | 0 (0.0%) |
| $3,000 or more | 1,432 (35.3%) | 10 (2.9%) |
| Total | 4,061 (100.0%) | 342 (100.0%) |
Physical Housing Characteristics in Lake Tapps
Housing Structures in Lake Tapps
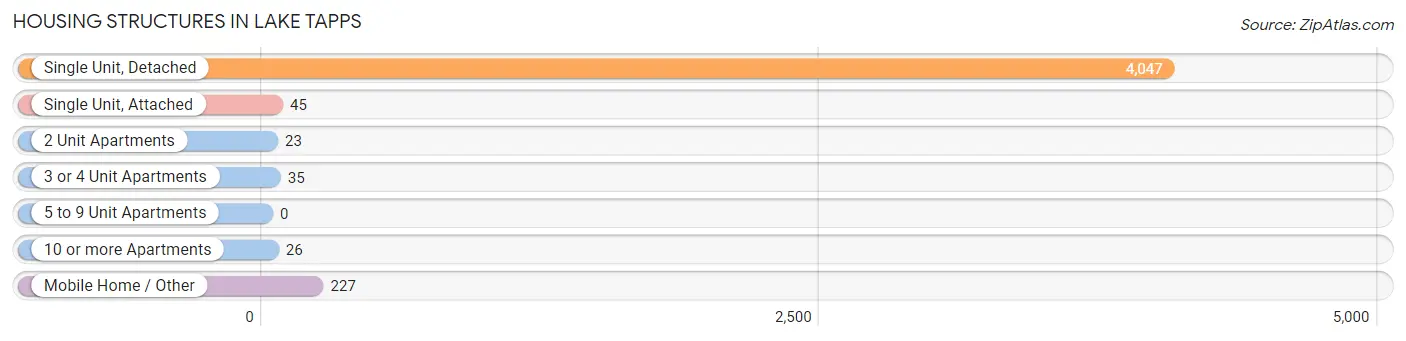
| Structure Type | # Housing Units | % Housing Units |
| Single Unit, Detached | 4,047 | 91.9% |
| Single Unit, Attached | 45 | 1.0% |
| 2 Unit Apartments | 23 | 0.5% |
| 3 or 4 Unit Apartments | 35 | 0.8% |
| 5 to 9 Unit Apartments | 0 | 0.0% |
| 10 or more Apartments | 26 | 0.6% |
| Mobile Home / Other | 227 | 5.2% |
| Total | 4,403 | 100.0% |
Housing Structures by Occupancy in Lake Tapps
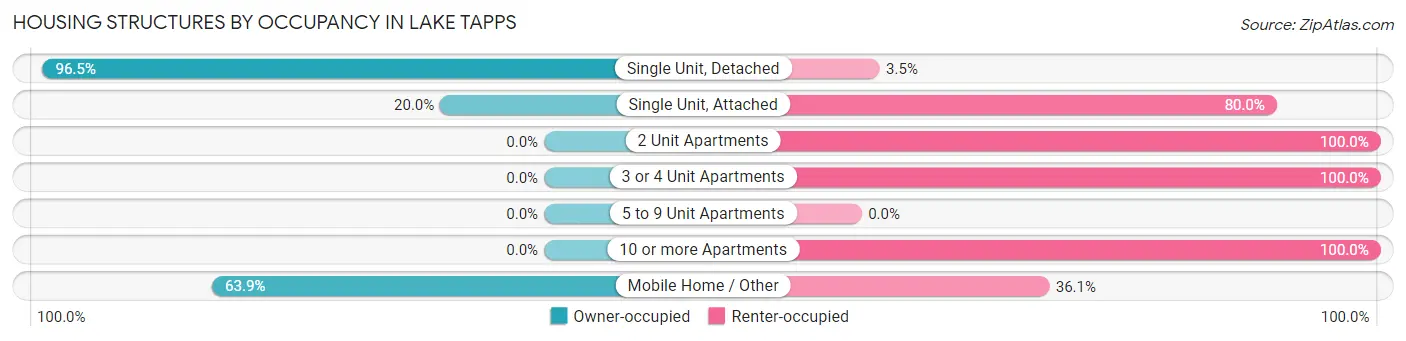
| Structure Type | Owner-occupied | Renter-occupied |
| Single Unit, Detached | 3,907 (96.5%) | 140 (3.5%) |
| Single Unit, Attached | 9 (20.0%) | 36 (80.0%) |
| 2 Unit Apartments | 0 (0.0%) | 23 (100.0%) |
| 3 or 4 Unit Apartments | 0 (0.0%) | 35 (100.0%) |
| 5 to 9 Unit Apartments | 0 (0.0%) | 0 (0.0%) |
| 10 or more Apartments | 0 (0.0%) | 26 (100.0%) |
| Mobile Home / Other | 145 (63.9%) | 82 (36.1%) |
| Total | 4,061 (92.2%) | 342 (7.8%) |
Housing Structures by Number of Rooms in Lake Tapps
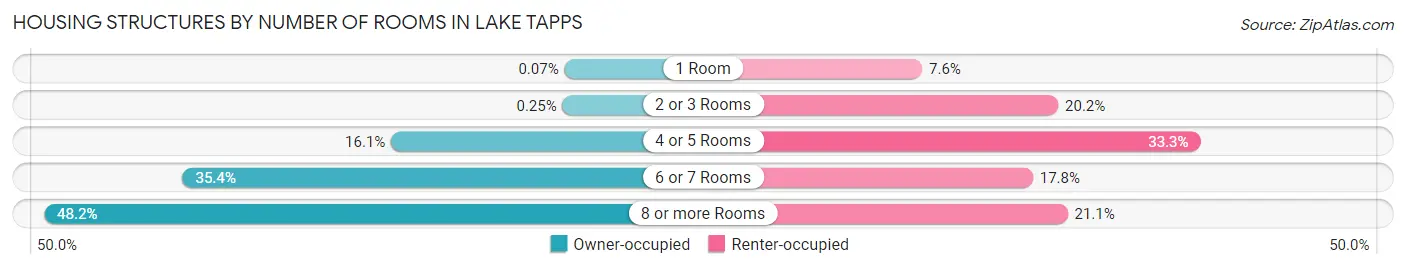
| Number of Rooms | Owner-occupied | Renter-occupied |
| 1 Room | 3 (0.1%) | 26 (7.6%) |
| 2 or 3 Rooms | 10 (0.3%) | 69 (20.2%) |
| 4 or 5 Rooms | 654 (16.1%) | 114 (33.3%) |
| 6 or 7 Rooms | 1,437 (35.4%) | 61 (17.8%) |
| 8 or more Rooms | 1,957 (48.2%) | 72 (21.0%) |
| Total | 4,061 (100.0%) | 342 (100.0%) |
Housing Structure by Heating Type in Lake Tapps
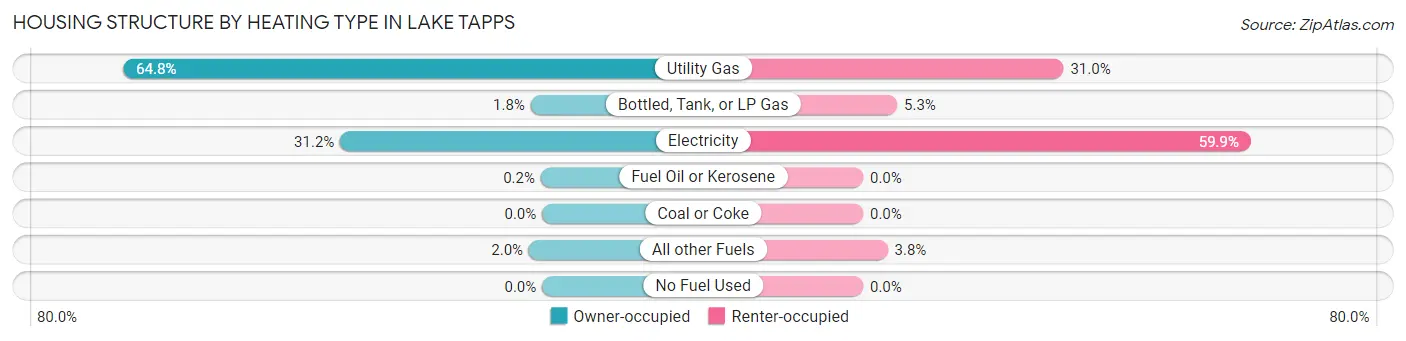
| Heating Type | Owner-occupied | Renter-occupied |
| Utility Gas | 2,630 (64.8%) | 106 (31.0%) |
| Bottled, Tank, or LP Gas | 72 (1.8%) | 18 (5.3%) |
| Electricity | 1,268 (31.2%) | 205 (59.9%) |
| Fuel Oil or Kerosene | 8 (0.2%) | 0 (0.0%) |
| Coal or Coke | 0 (0.0%) | 0 (0.0%) |
| All other Fuels | 83 (2.0%) | 13 (3.8%) |
| No Fuel Used | 0 (0.0%) | 0 (0.0%) |
| Total | 4,061 (100.0%) | 342 (100.0%) |
Household Vehicle Usage in Lake Tapps
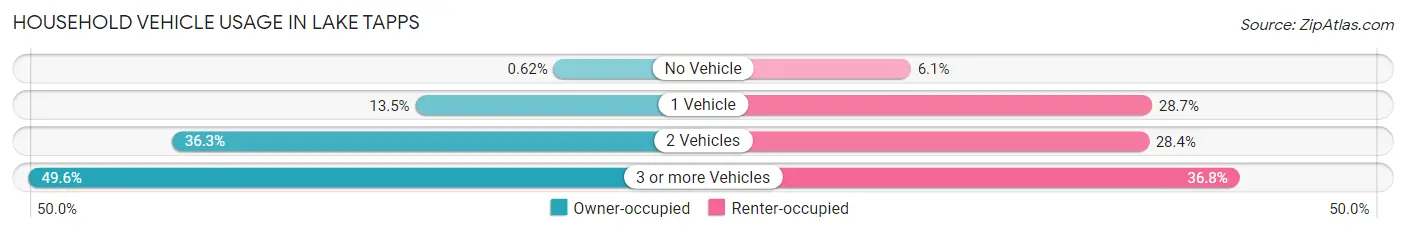
| Vehicles per Household | Owner-occupied | Renter-occupied |
| No Vehicle | 25 (0.6%) | 21 (6.1%) |
| 1 Vehicle | 549 (13.5%) | 98 (28.6%) |
| 2 Vehicles | 1,472 (36.2%) | 97 (28.4%) |
| 3 or more Vehicles | 2,015 (49.6%) | 126 (36.8%) |
| Total | 4,061 (100.0%) | 342 (100.0%) |
Real Estate & Mortgages in Lake Tapps
Real Estate and Mortgage Overview in Lake Tapps
| Characteristic | Without Mortgage | With Mortgage |
| Housing Units | 1,060 | 3,001 |
| Median Property Value | $676,400 | $619,000 |
| Median Household Income | $125,357 | $1,495 |
| Monthly Housing Costs | $955 | $1,422 |
| Real Estate Taxes | $7,746 | $35 |
Property Value by Mortgage Status in Lake Tapps
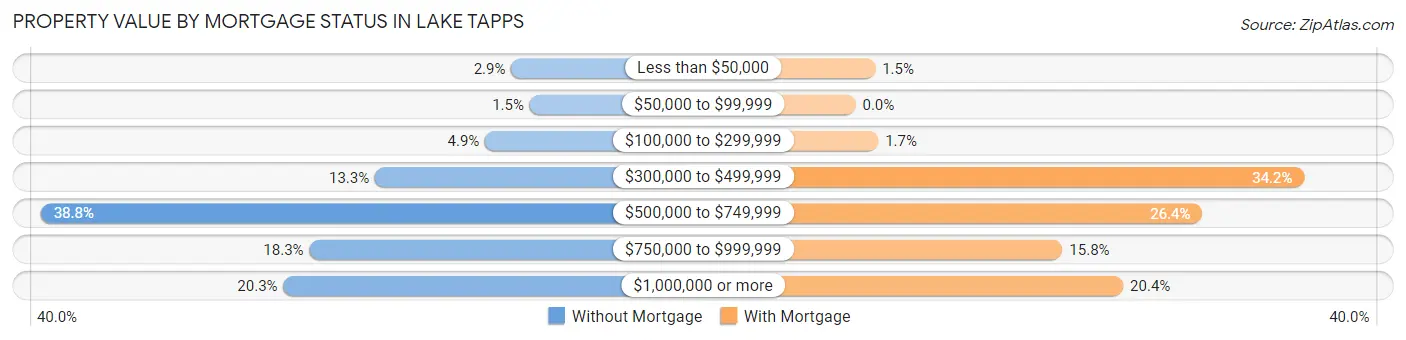
| Property Value | Without Mortgage | With Mortgage |
| Less than $50,000 | 31 (2.9%) | 45 (1.5%) |
| $50,000 to $99,999 | 16 (1.5%) | 0 (0.0%) |
| $100,000 to $299,999 | 52 (4.9%) | 52 (1.7%) |
| $300,000 to $499,999 | 141 (13.3%) | 1,026 (34.2%) |
| $500,000 to $749,999 | 411 (38.8%) | 793 (26.4%) |
| $750,000 to $999,999 | 194 (18.3%) | 473 (15.8%) |
| $1,000,000 or more | 215 (20.3%) | 612 (20.4%) |
| Total | 1,060 (100.0%) | 3,001 (100.0%) |
Household Income by Mortgage Status in Lake Tapps
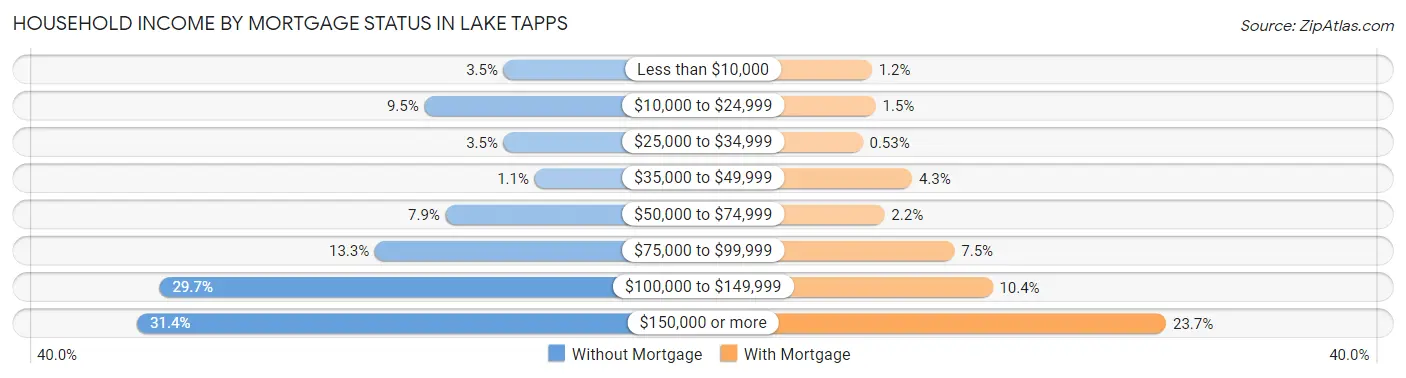
| Household Income | Without Mortgage | With Mortgage |
| Less than $10,000 | 37 (3.5%) | 37 (1.2%) |
| $10,000 to $24,999 | 101 (9.5%) | 46 (1.5%) |
| $25,000 to $34,999 | 37 (3.5%) | 16 (0.5%) |
| $35,000 to $49,999 | 12 (1.1%) | 129 (4.3%) |
| $50,000 to $74,999 | 84 (7.9%) | 66 (2.2%) |
| $75,000 to $99,999 | 141 (13.3%) | 226 (7.5%) |
| $100,000 to $149,999 | 315 (29.7%) | 313 (10.4%) |
| $150,000 or more | 333 (31.4%) | 710 (23.7%) |
| Total | 1,060 (100.0%) | 3,001 (100.0%) |
Property Value to Household Income Ratio in Lake Tapps
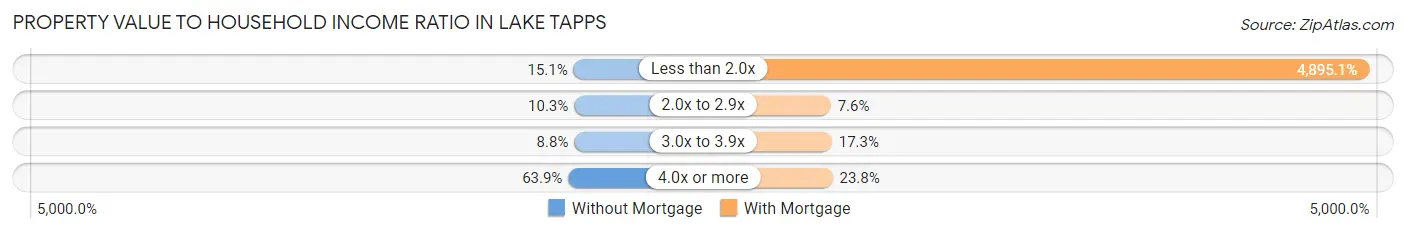
| Value-to-Income Ratio | Without Mortgage | With Mortgage |
| Less than 2.0x | 160 (15.1%) | 146,902 (4,895.1%) |
| 2.0x to 2.9x | 109 (10.3%) | 227 (7.6%) |
| 3.0x to 3.9x | 93 (8.8%) | 520 (17.3%) |
| 4.0x or more | 677 (63.9%) | 713 (23.8%) |
| Total | 1,060 (100.0%) | 3,001 (100.0%) |
Real Estate Taxes by Mortgage Status in Lake Tapps
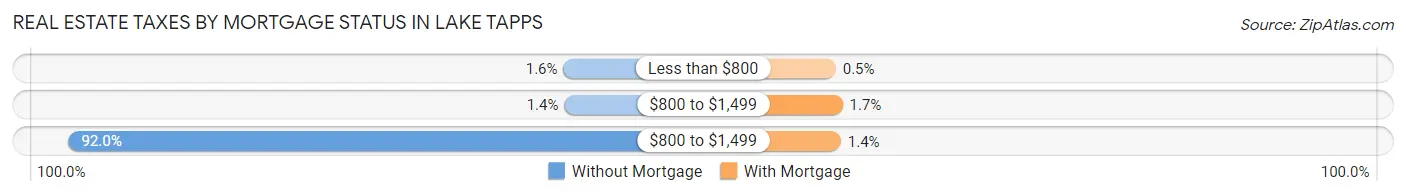
| Property Taxes | Without Mortgage | With Mortgage |
| Less than $800 | 17 (1.6%) | 15 (0.5%) |
| $800 to $1,499 | 15 (1.4%) | 52 (1.7%) |
| $800 to $1,499 | 975 (92.0%) | 43 (1.4%) |
| Total | 1,060 (100.0%) | 3,001 (100.0%) |
Health & Disability in Lake Tapps
Health Insurance Coverage by Age in Lake Tapps
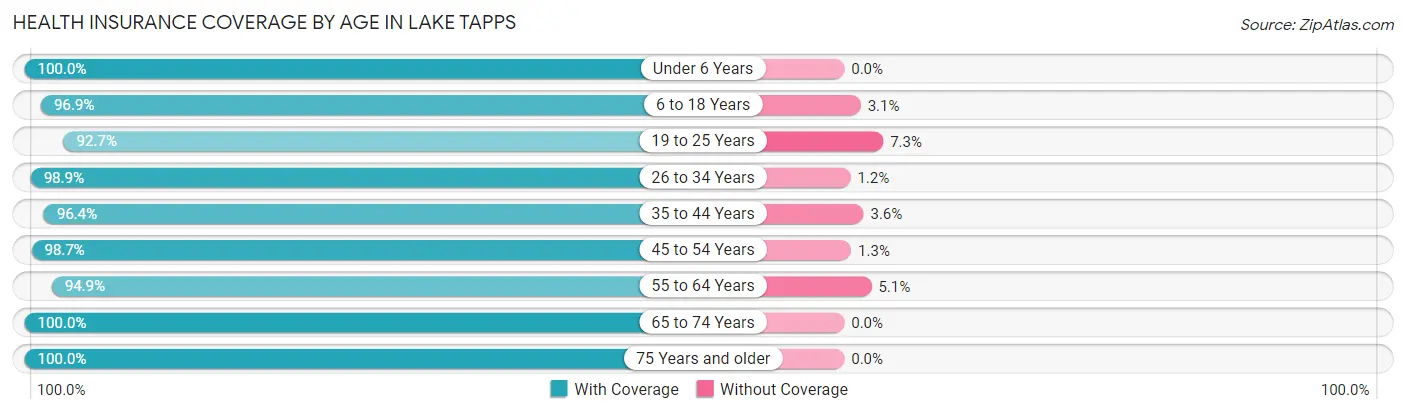
| Age Bracket | With Coverage | Without Coverage |
| Under 6 Years | 658 (100.0%) | 0 (0.0%) |
| 6 to 18 Years | 2,374 (96.9%) | 75 (3.1%) |
| 19 to 25 Years | 792 (92.7%) | 62 (7.3%) |
| 26 to 34 Years | 774 (98.9%) | 9 (1.1%) |
| 35 to 44 Years | 1,612 (96.4%) | 60 (3.6%) |
| 45 to 54 Years | 1,933 (98.7%) | 25 (1.3%) |
| 55 to 64 Years | 1,871 (94.9%) | 100 (5.1%) |
| 65 to 74 Years | 1,412 (100.0%) | 0 (0.0%) |
| 75 Years and older | 439 (100.0%) | 0 (0.0%) |
| Total | 11,865 (97.3%) | 331 (2.7%) |
Health Insurance Coverage by Citizenship Status in Lake Tapps
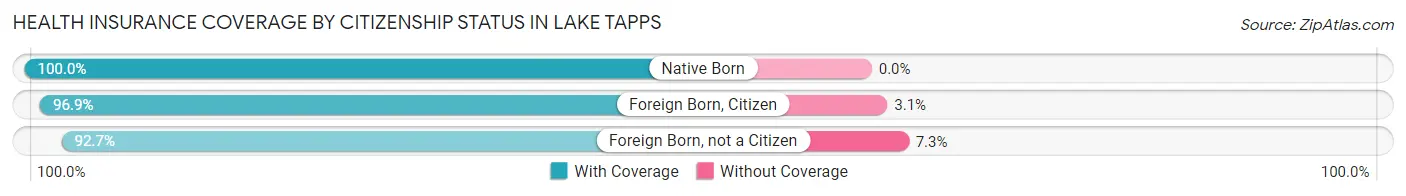
| Citizenship Status | With Coverage | Without Coverage |
| Native Born | 658 (100.0%) | 0 (0.0%) |
| Foreign Born, Citizen | 2,374 (96.9%) | 75 (3.1%) |
| Foreign Born, not a Citizen | 792 (92.7%) | 62 (7.3%) |
Health Insurance Coverage by Household Income in Lake Tapps
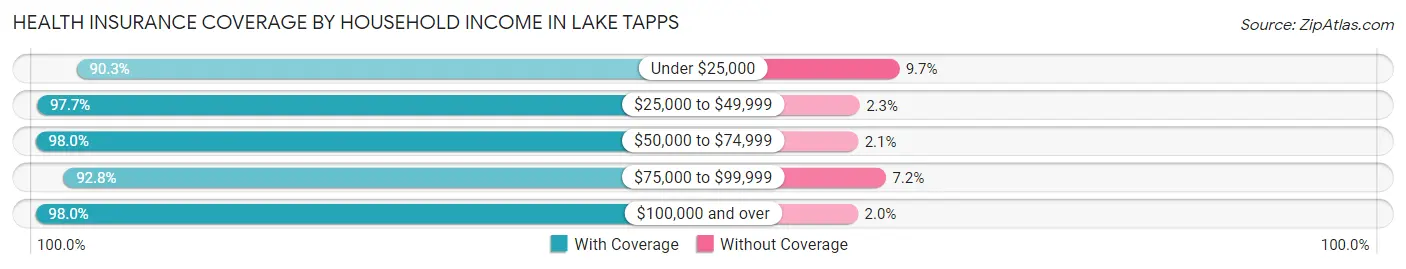
| Household Income | With Coverage | Without Coverage |
| Under $25,000 | 223 (90.3%) | 24 (9.7%) |
| $25,000 to $49,999 | 463 (97.7%) | 11 (2.3%) |
| $50,000 to $74,999 | 573 (98.0%) | 12 (2.1%) |
| $75,000 to $99,999 | 1,114 (92.8%) | 87 (7.2%) |
| $100,000 and over | 9,492 (98.0%) | 197 (2.0%) |
Public vs Private Health Insurance Coverage by Age in Lake Tapps
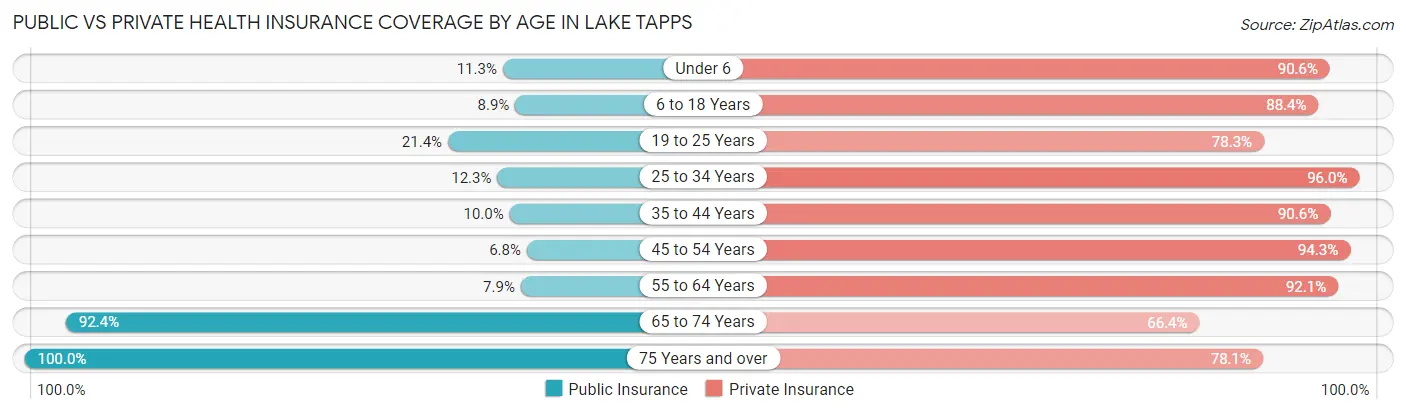
| Age Bracket | Public Insurance | Private Insurance |
| Under 6 | 74 (11.3%) | 596 (90.6%) |
| 6 to 18 Years | 219 (8.9%) | 2,166 (88.4%) |
| 19 to 25 Years | 183 (21.4%) | 669 (78.3%) |
| 25 to 34 Years | 96 (12.3%) | 752 (96.0%) |
| 35 to 44 Years | 167 (10.0%) | 1,515 (90.6%) |
| 45 to 54 Years | 133 (6.8%) | 1,847 (94.3%) |
| 55 to 64 Years | 156 (7.9%) | 1,815 (92.1%) |
| 65 to 74 Years | 1,304 (92.3%) | 937 (66.4%) |
| 75 Years and over | 439 (100.0%) | 343 (78.1%) |
| Total | 2,771 (22.7%) | 10,640 (87.2%) |
Disability Status by Sex by Age in Lake Tapps
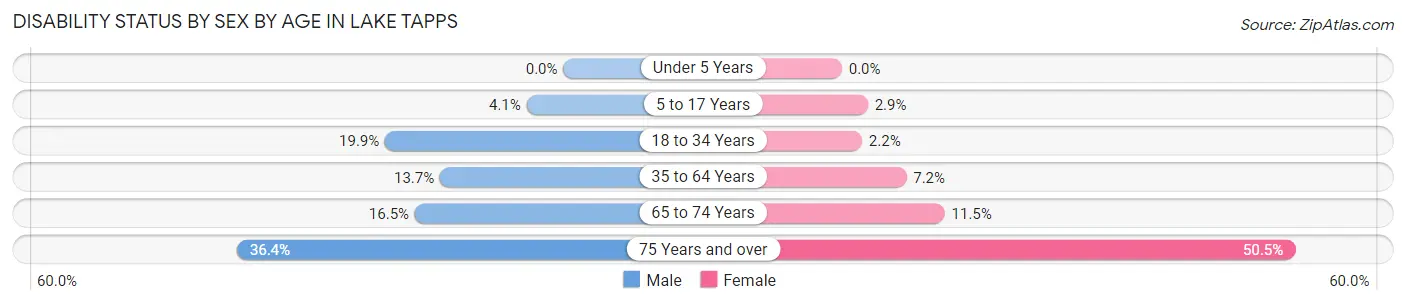
| Age Bracket | Male | Female |
| Under 5 Years | 0 (0.0%) | 0 (0.0%) |
| 5 to 17 Years | 52 (4.1%) | 30 (2.9%) |
| 18 to 34 Years | 184 (19.9%) | 21 (2.2%) |
| 35 to 64 Years | 402 (13.7%) | 192 (7.2%) |
| 65 to 74 Years | 102 (16.5%) | 91 (11.5%) |
| 75 Years and over | 84 (36.4%) | 105 (50.5%) |
Disability Class by Sex by Age in Lake Tapps
Disability Class: Hearing Difficulty
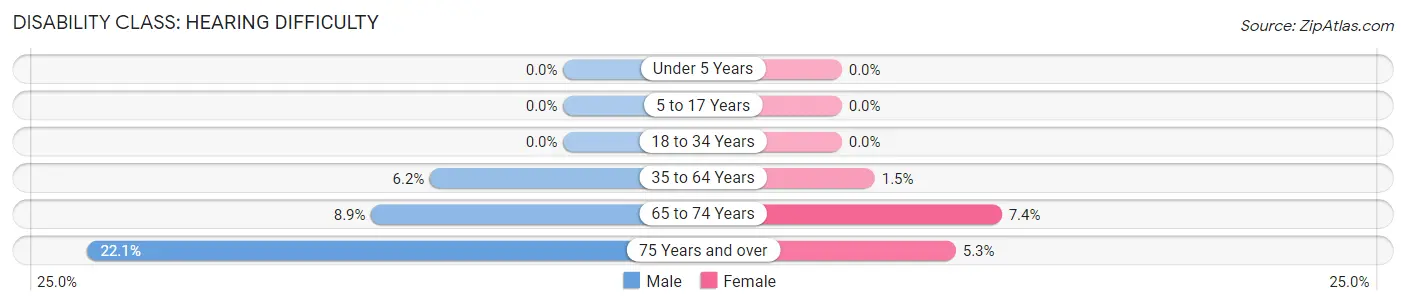
| Age Bracket | Male | Female |
| Under 5 Years | 0 (0.0%) | 0 (0.0%) |
| 5 to 17 Years | 0 (0.0%) | 0 (0.0%) |
| 18 to 34 Years | 0 (0.0%) | 0 (0.0%) |
| 35 to 64 Years | 181 (6.2%) | 41 (1.5%) |
| 65 to 74 Years | 55 (8.9%) | 59 (7.4%) |
| 75 Years and over | 51 (22.1%) | 11 (5.3%) |
Disability Class: Vision Difficulty
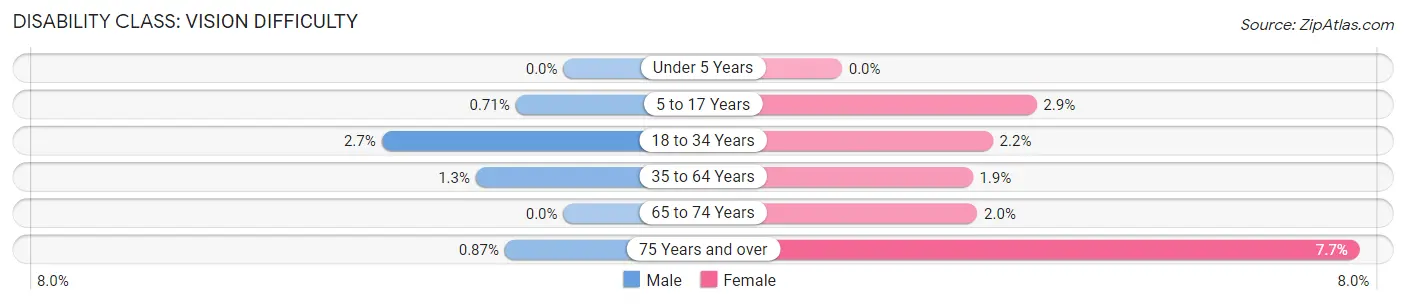
| Age Bracket | Male | Female |
| Under 5 Years | 0 (0.0%) | 0 (0.0%) |
| 5 to 17 Years | 9 (0.7%) | 30 (2.9%) |
| 18 to 34 Years | 25 (2.7%) | 21 (2.2%) |
| 35 to 64 Years | 38 (1.3%) | 52 (1.9%) |
| 65 to 74 Years | 0 (0.0%) | 16 (2.0%) |
| 75 Years and over | 2 (0.9%) | 16 (7.7%) |
Disability Class: Cognitive Difficulty
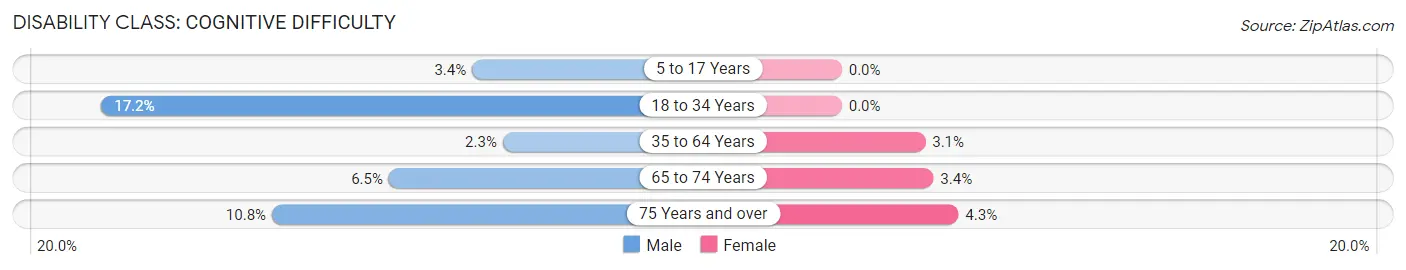
| Age Bracket | Male | Female |
| 5 to 17 Years | 43 (3.4%) | 0 (0.0%) |
| 18 to 34 Years | 159 (17.2%) | 0 (0.0%) |
| 35 to 64 Years | 66 (2.2%) | 83 (3.1%) |
| 65 to 74 Years | 40 (6.5%) | 27 (3.4%) |
| 75 Years and over | 25 (10.8%) | 9 (4.3%) |
Disability Class: Ambulatory Difficulty
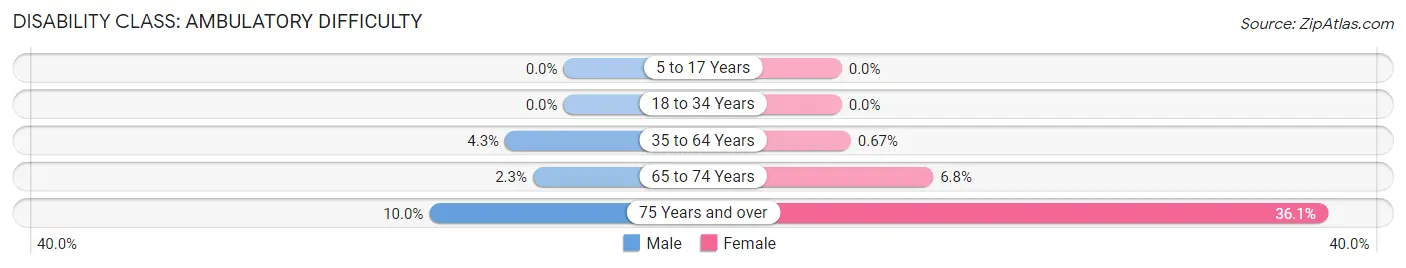
| Age Bracket | Male | Female |
| 5 to 17 Years | 0 (0.0%) | 0 (0.0%) |
| 18 to 34 Years | 0 (0.0%) | 0 (0.0%) |
| 35 to 64 Years | 127 (4.3%) | 18 (0.7%) |
| 65 to 74 Years | 14 (2.3%) | 54 (6.8%) |
| 75 Years and over | 23 (10.0%) | 75 (36.1%) |
Disability Class: Self-Care Difficulty
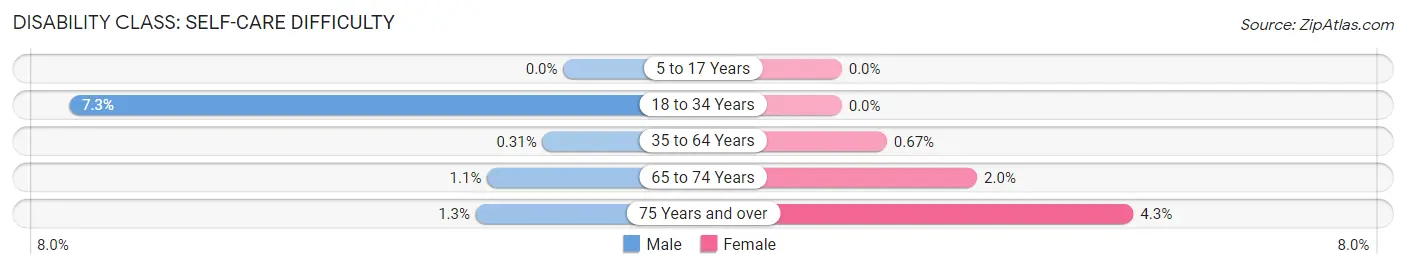
| Age Bracket | Male | Female |
| 5 to 17 Years | 0 (0.0%) | 0 (0.0%) |
| 18 to 34 Years | 68 (7.3%) | 0 (0.0%) |
| 35 to 64 Years | 9 (0.3%) | 18 (0.7%) |
| 65 to 74 Years | 7 (1.1%) | 16 (2.0%) |
| 75 Years and over | 3 (1.3%) | 9 (4.3%) |
Technology Access in Lake Tapps
Computing Device Access in Lake Tapps
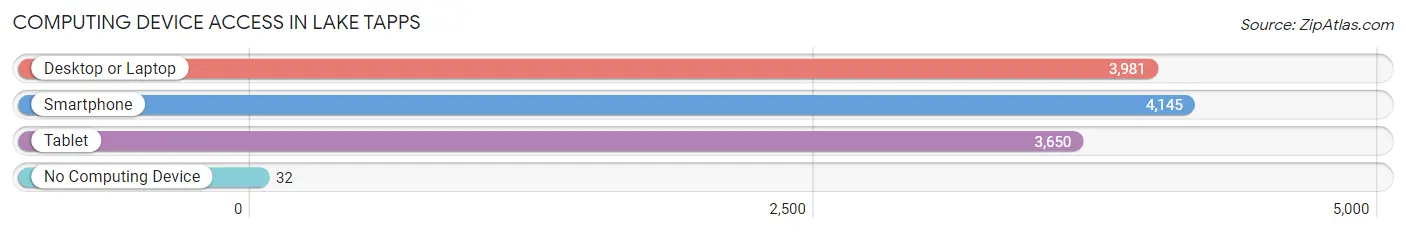
| Device Type | # Households | % Households |
| Desktop or Laptop | 3,981 | 90.4% |
| Smartphone | 4,145 | 94.1% |
| Tablet | 3,650 | 82.9% |
| No Computing Device | 32 | 0.7% |
| Total | 4,403 | 100.0% |
Internet Access in Lake Tapps
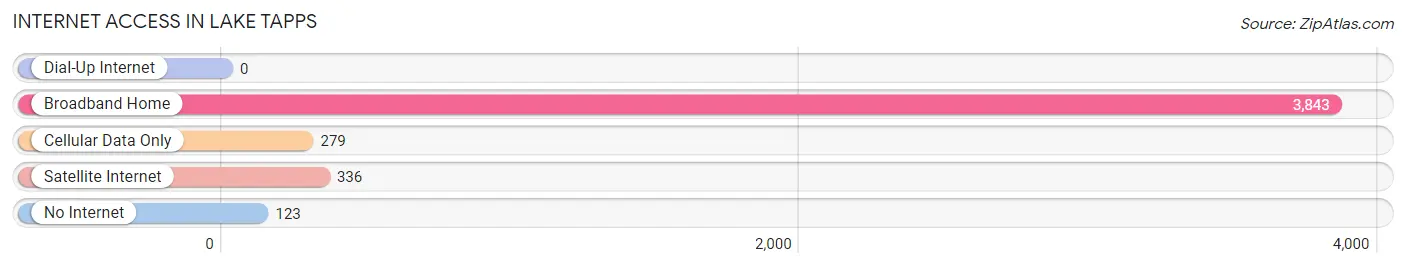
| Internet Type | # Households | % Households |
| Dial-Up Internet | 0 | 0.0% |
| Broadband Home | 3,843 | 87.3% |
| Cellular Data Only | 279 | 6.3% |
| Satellite Internet | 336 | 7.6% |
| No Internet | 123 | 2.8% |
| Total | 4,403 | 100.0% |
Lake Tapps Summary
Lake Tapps is a census-designated place located in Pierce County, Washington, United States. It is situated on the eastern shore of Lake Tapps, a reservoir created by the construction of the Lake Tapps Dam in 1911. The lake is fed by the White River and is a popular recreational destination for fishing, boating, and swimming. The population of Lake Tapps was 8,719 at the 2010 census.
History
The area around Lake Tapps was first inhabited by the Puyallup Tribe of Native Americans. The lake was named after Chief Tapps, a leader of the Puyallup Tribe. The lake was originally used for fishing and hunting by the tribe.
In 1911, the Lake Tapps Dam was built to provide hydroelectric power to the Puget Sound region. The dam created the lake, which was used for recreational activities such as fishing, boating, and swimming.
In the 1950s, the area around Lake Tapps began to be developed for residential use. The area was annexed by the City of Auburn in 1965. In the 1970s, the area was annexed by the City of Bonney Lake.
Geography
Lake Tapps is located at 47°14′N 122°13′W (47.23, -122.21). It is situated on the eastern shore of Lake Tapps, a reservoir created by the construction of the Lake Tapps Dam in 1911. The lake is fed by the White River and is a popular recreational destination for fishing, boating, and swimming.
The area around Lake Tapps is mostly rural, with some residential development. The nearest major city is Tacoma, which is located about 20 miles to the west.
Economy
The economy of Lake Tapps is largely based on tourism and recreation. The lake is a popular destination for fishing, boating, and swimming. There are also several marinas and boat launches located on the lake.
The area is also home to several businesses, including restaurants, retail stores, and professional services. The nearest major employers are located in Tacoma and Seattle.
Demographics
As of the 2010 census, the population of Lake Tapps was 8,719. The racial makeup of the population was 87.3% White, 4.2% Asian, 2.2% African American, 0.7% Native American, 0.2% Pacific Islander, and 4.6% from other races.
The median household income in Lake Tapps was $76,945 in 2010. The per capita income was $31,945. The median age of the population was 37.7 years.
Conclusion
Lake Tapps is a census-designated place located in Pierce County, Washington, United States. It is situated on the eastern shore of Lake Tapps, a reservoir created by the construction of the Lake Tapps Dam in 1911. The lake is a popular recreational destination for fishing, boating, and swimming. The population of Lake Tapps was 8,719 at the 2010 census. The economy of Lake Tapps is largely based on tourism and recreation. The racial makeup of the population was 87.3% White, 4.2% Asian, 2.2% African American, 0.7% Native American, 0.2% Pacific Islander, and 4.6% from other races. The median household income in Lake Tapps was $76,945 in 2010. The per capita income was $31,945. The median age of the population was 37.7 years.
Common Questions
What is Per Capita Income in Lake Tapps?
Per Capita income in Lake Tapps is $71,461.
What is the Median Family Income in Lake Tapps?
Median Family Income in Lake Tapps is $154,297.
What is the Median Household income in Lake Tapps?
Median Household Income in Lake Tapps is $132,850.
What is Income or Wage Gap in Lake Tapps?
Income or Wage Gap in Lake Tapps is 38.5%.
Women in Lake Tapps earn 61.5 cents for every dollar earned by a man.
What is Inequality or Gini Index in Lake Tapps?
Inequality or Gini Index in Lake Tapps is 0.47.
What is the Total Population of Lake Tapps?
Total Population of Lake Tapps is 12,196.
What is the Total Male Population of Lake Tapps?
Total Male Population of Lake Tapps is 6,255.
What is the Total Female Population of Lake Tapps?
Total Female Population of Lake Tapps is 5,941.
What is the Ratio of Males per 100 Females in Lake Tapps?
There are 105.29 Males per 100 Females in Lake Tapps.
What is the Ratio of Females per 100 Males in Lake Tapps?
There are 94.98 Females per 100 Males in Lake Tapps.
What is the Median Population Age in Lake Tapps?
Median Population Age in Lake Tapps is 43.3 Years.
What is the Average Family Size in Lake Tapps
Average Family Size in Lake Tapps is 3.1 People.
What is the Average Household Size in Lake Tapps
Average Household Size in Lake Tapps is 2.8 People.
How Large is the Labor Force in Lake Tapps?
There are 6,542 People in the Labor Forcein in Lake Tapps.
What is the Percentage of People in the Labor Force in Lake Tapps?
68.3% of People are in the Labor Force in Lake Tapps.
What is the Unemployment Rate in Lake Tapps?
Unemployment Rate in Lake Tapps is 3.6%.