Woodway, WA Map & Demographics
Woodway Map
Woodway Overview
$131,771
PER CAPITA INCOME
$214,632
AVG FAMILY INCOME
$204,167
AVG HOUSEHOLD INCOME
61.7%
WAGE / INCOME GAP [ % ]
38.3¢/ $1
WAGE / INCOME GAP [ $ ]
0.55
INEQUALITY / GINI INDEX
1,118
TOTAL POPULATION
541
MALE POPULATION
577
FEMALE POPULATION
93.76
MALES / 100 FEMALES
106.65
FEMALES / 100 MALES
50.8
MEDIAN AGE
2.8
AVG FAMILY SIZE
2.6
AVG HOUSEHOLD SIZE
507
LABOR FORCE [ PEOPLE ]
54.8%
PERCENT IN LABOR FORCE
1.2%
UNEMPLOYMENT RATE
Woodway Area Codes
Income in Woodway
Income Overview in Woodway
Per Capita Income in Woodway is $131,771, while median incomes of families and households are $214,632 and $204,167 respectively.
| Characteristic | Number | Measure |
| Per Capita Income | 1,118 | $131,771 |
| Median Family Income | 361 | $214,632 |
| Mean Family Income | 361 | $383,098 |
| Median Household Income | 424 | $204,167 |
| Mean Household Income | 424 | $344,325 |
| Income Deficit | 361 | $0 |
| Wage / Income Gap (%) | 1,118 | 61.69% |
| Wage / Income Gap ($) | 1,118 | 38.31¢ per $1 |
| Gini / Inequality Index | 1,118 | 0.55 |
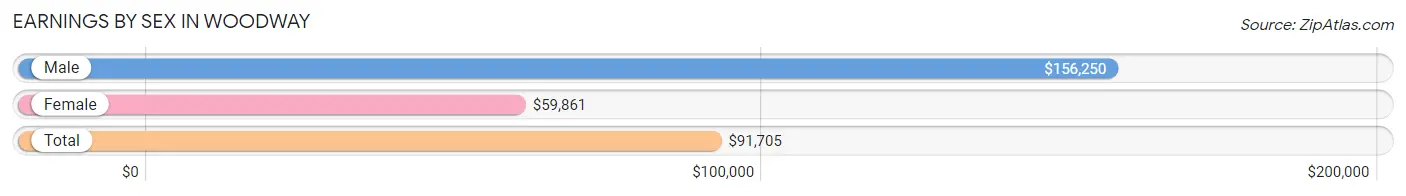
Earnings by Sex in Woodway
Average Earnings in Woodway are $91,705, $156,250 for men and $59,861 for women, a difference of 61.7%.
| Sex | Number | Average Earnings |
| Male | 292 (52.2%) | $156,250 |
| Female | 267 (47.8%) | $59,861 |
| Total | 559 (100.0%) | $91,705 |
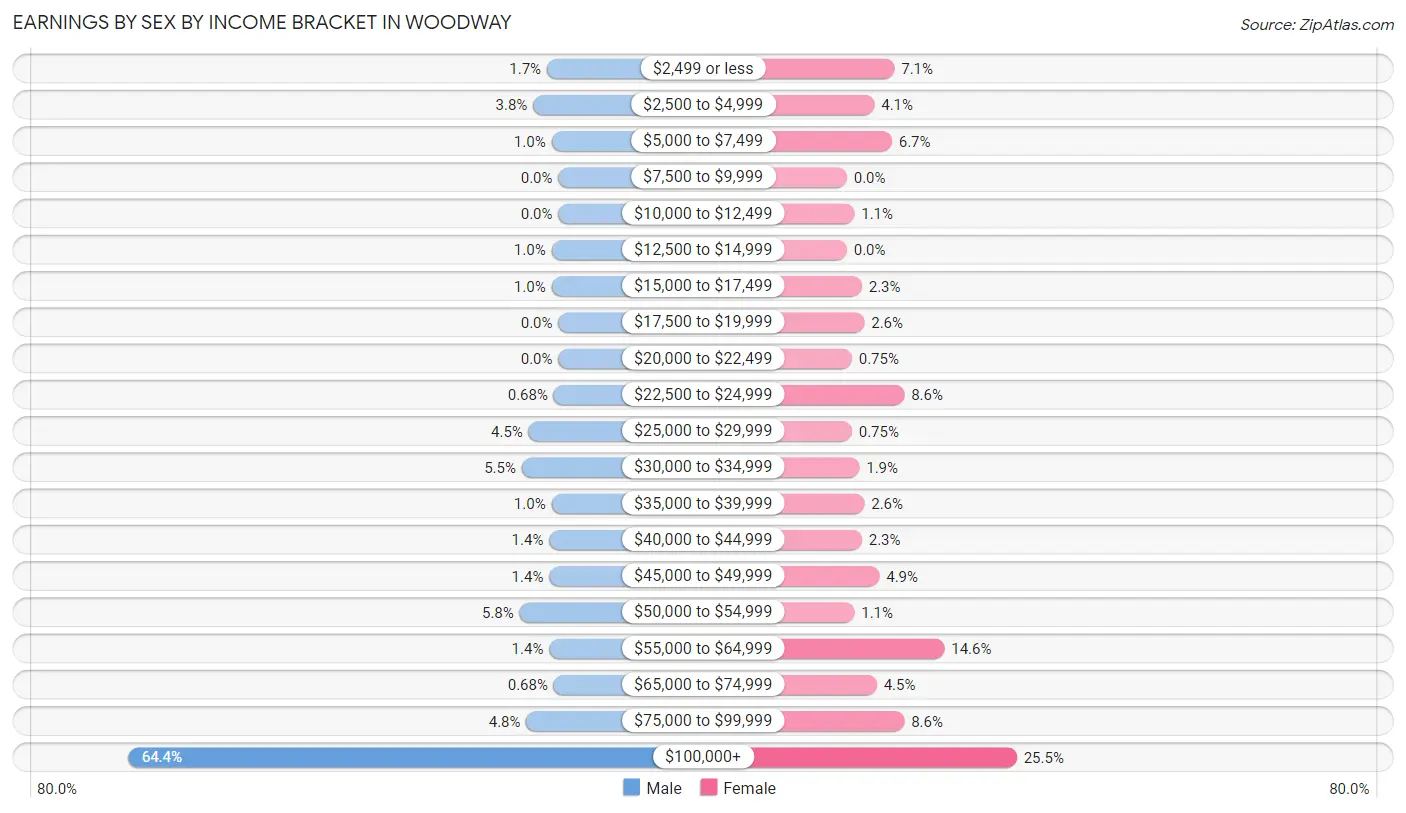
Earnings by Sex by Income Bracket in Woodway
The most common earnings brackets in Woodway are $100,000+ for men (188 | 64.4%) and $100,000+ for women (68 | 25.5%).
| Income | Male | Female |
| $2,499 or less | 5 (1.7%) | 19 (7.1%) |
| $2,500 to $4,999 | 11 (3.8%) | 11 (4.1%) |
| $5,000 to $7,499 | 3 (1.0%) | 18 (6.7%) |
| $7,500 to $9,999 | 0 (0.0%) | 0 (0.0%) |
| $10,000 to $12,499 | 0 (0.0%) | 3 (1.1%) |
| $12,500 to $14,999 | 3 (1.0%) | 0 (0.0%) |
| $15,000 to $17,499 | 3 (1.0%) | 6 (2.2%) |
| $17,500 to $19,999 | 0 (0.0%) | 7 (2.6%) |
| $20,000 to $22,499 | 0 (0.0%) | 2 (0.7%) |
| $22,500 to $24,999 | 2 (0.7%) | 23 (8.6%) |
| $25,000 to $29,999 | 13 (4.4%) | 2 (0.7%) |
| $30,000 to $34,999 | 16 (5.5%) | 5 (1.9%) |
| $35,000 to $39,999 | 3 (1.0%) | 7 (2.6%) |
| $40,000 to $44,999 | 4 (1.4%) | 6 (2.2%) |
| $45,000 to $49,999 | 4 (1.4%) | 13 (4.9%) |
| $50,000 to $54,999 | 17 (5.8%) | 3 (1.1%) |
| $55,000 to $64,999 | 4 (1.4%) | 39 (14.6%) |
| $65,000 to $74,999 | 2 (0.7%) | 12 (4.5%) |
| $75,000 to $99,999 | 14 (4.8%) | 23 (8.6%) |
| $100,000+ | 188 (64.4%) | 68 (25.5%) |
| Total | 292 (100.0%) | 267 (100.0%) |
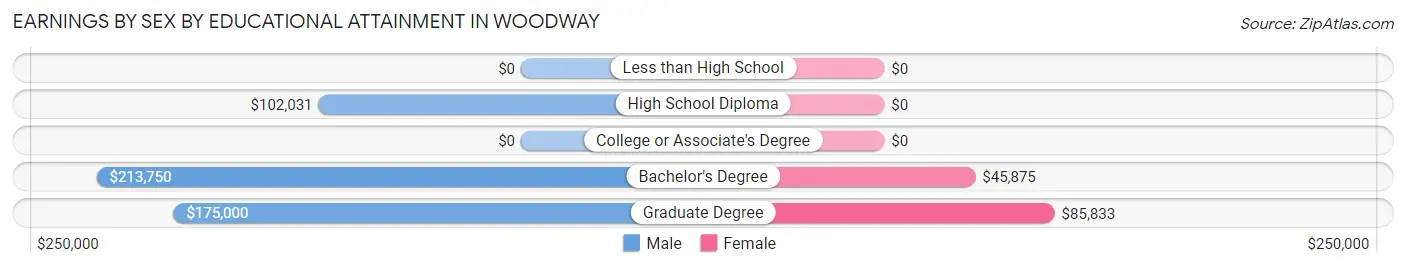
Earnings by Sex by Educational Attainment in Woodway
Average earnings in Woodway are $165,625 for men and $61,000 for women, a difference of 63.2%. Men with an educational attainment of bachelor's degree enjoy the highest average annual earnings of $213,750, while those with high school diploma education earn the least with $102,031. Women with an educational attainment of graduate degree earn the most with the average annual earnings of $85,833, while those with bachelor's degree education have the smallest earnings of $45,875.
| Educational Attainment | Male Income | Female Income |
| Less than High School | - | - |
| High School Diploma | $102,031 | $0 |
| College or Associate's Degree | - | - |
| Bachelor's Degree | $213,750 | $45,875 |
| Graduate Degree | $175,000 | $85,833 |
| Total | $165,625 | $61,000 |
Family Income in Woodway
Family Income Brackets in Woodway
According to the Woodway family income data, there are 204 families falling into the $200,000+ income range, which is the most common income bracket and makes up 56.5% of all families.
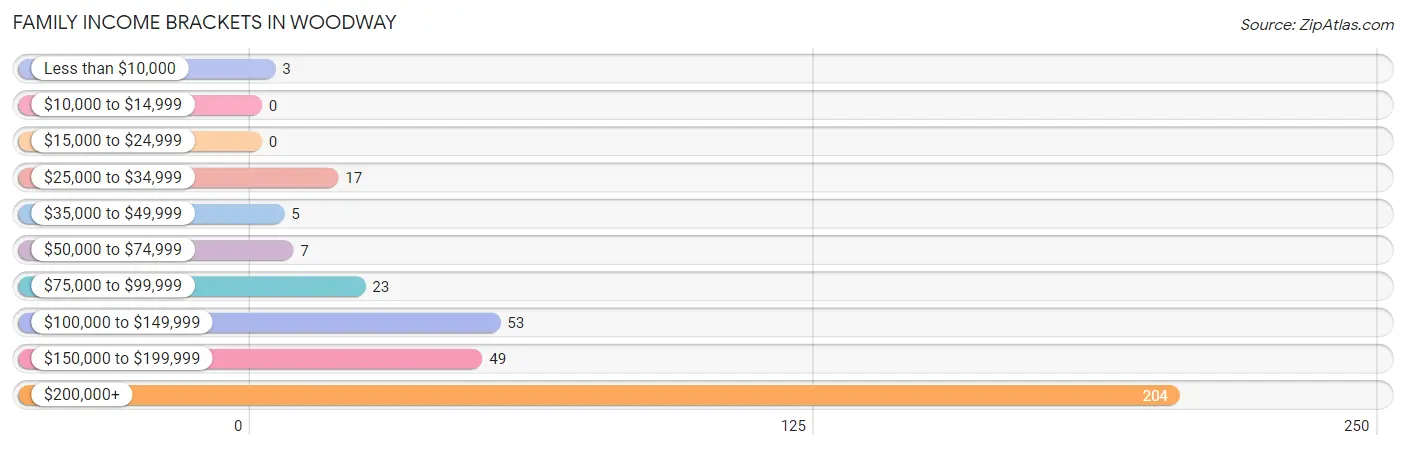
| Income Bracket | # Families | % Families |
| Less than $10,000 | 3 | 0.8% |
| $10,000 to $14,999 | 0 | 0.0% |
| $15,000 to $24,999 | 0 | 0.0% |
| $25,000 to $34,999 | 17 | 4.7% |
| $35,000 to $49,999 | 5 | 1.4% |
| $50,000 to $74,999 | 7 | 1.9% |
| $75,000 to $99,999 | 23 | 6.4% |
| $100,000 to $149,999 | 53 | 14.7% |
| $150,000 to $199,999 | 49 | 13.6% |
| $200,000+ | 204 | 56.5% |
Family Income by Famaliy Size in Woodway
4-person families (66 | 18.3%) account for the highest median family income in Woodway with $250,001 per family, while 2-person families (199 | 55.1%) have the highest median income of $95,208 per family member.
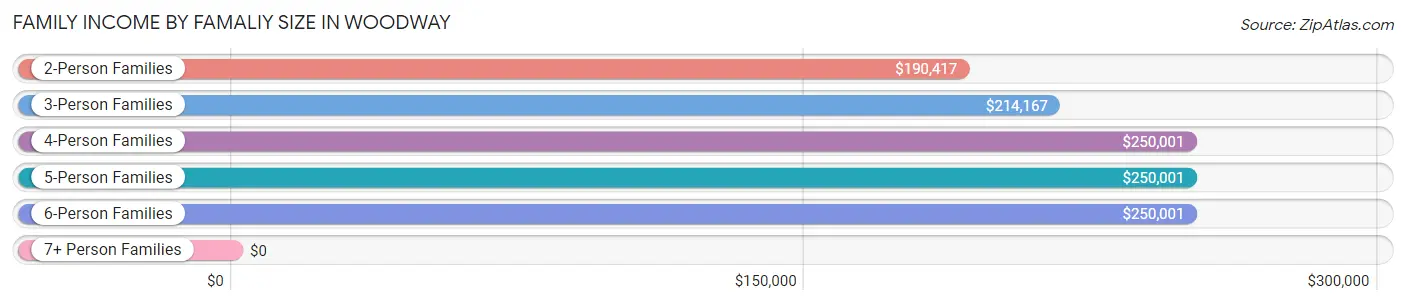
| Income Bracket | # Families | Median Income |
| 2-Person Families | 199 (55.1%) | $190,417 |
| 3-Person Families | 70 (19.4%) | $214,167 |
| 4-Person Families | 66 (18.3%) | $250,001 |
| 5-Person Families | 16 (4.4%) | $250,001 |
| 6-Person Families | 10 (2.8%) | $250,001 |
| 7+ Person Families | 0 (0.0%) | $0 |
| Total | 361 (100.0%) | $214,632 |
Family Income by Number of Earners in Woodway
The median family income in Woodway is $214,632, with families comprising 2 earners (115) having the highest median family income of $250,001, while families with no earners (62) have the lowest median family income of $128,750, accounting for 31.9% and 17.2% of families, respectively.
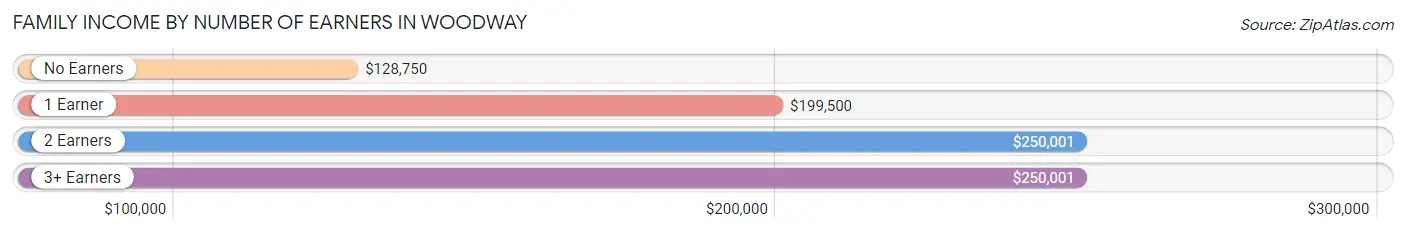
| Number of Earners | # Families | Median Income |
| No Earners | 62 (17.2%) | $128,750 |
| 1 Earner | 152 (42.1%) | $199,500 |
| 2 Earners | 115 (31.9%) | $250,001 |
| 3+ Earners | 32 (8.9%) | $250,001 |
| Total | 361 (100.0%) | $214,632 |
Household Income in Woodway
Household Income Brackets in Woodway
With 220 households falling in the category, the $200,000+ income range is the most frequent in Woodway, accounting for 51.9% of all households.
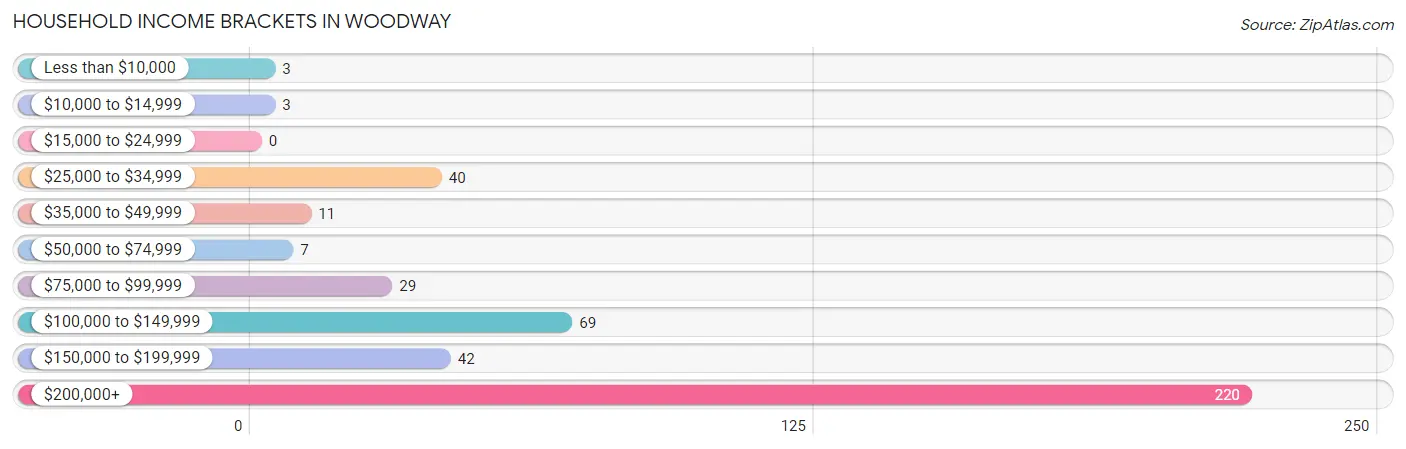
| Income Bracket | # Households | % Households |
| Less than $10,000 | 3 | 0.7% |
| $10,000 to $14,999 | 3 | 0.7% |
| $15,000 to $24,999 | 0 | 0.0% |
| $25,000 to $34,999 | 40 | 9.4% |
| $35,000 to $49,999 | 11 | 2.6% |
| $50,000 to $74,999 | 7 | 1.7% |
| $75,000 to $99,999 | 29 | 6.8% |
| $100,000 to $149,999 | 69 | 16.3% |
| $150,000 to $199,999 | 42 | 9.9% |
| $200,000+ | 220 | 51.9% |
Household Income by Householder Age in Woodway
The median household income in Woodway is $204,167, with the highest median household income of $242,500 found in the 25 to 44 years age bracket for the primary householder. A total of 54 households (12.7%) fall into this category.
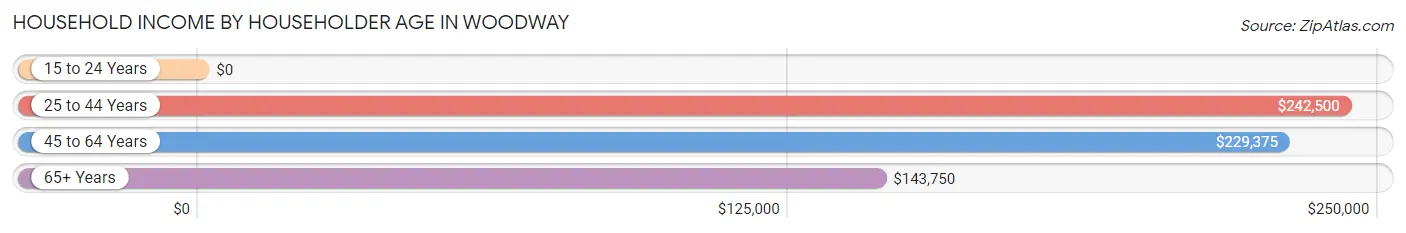
| Income Bracket | # Households | Median Income |
| 15 to 24 Years | 0 (0.0%) | $0 |
| 25 to 44 Years | 54 (12.7%) | $242,500 |
| 45 to 64 Years | 227 (53.5%) | $229,375 |
| 65+ Years | 143 (33.7%) | $143,750 |
| Total | 424 (100.0%) | $204,167 |
Poverty in Woodway
Income Below Poverty by Sex and Age in Woodway
With 0.4% poverty level for males and 2.5% for females among the residents of Woodway, 18 to 24 year old males and 18 to 24 year old females are the most vulnerable to poverty, with 2 males (5.4%) and 3 females (6.8%) in their respective age groups living below the poverty level.
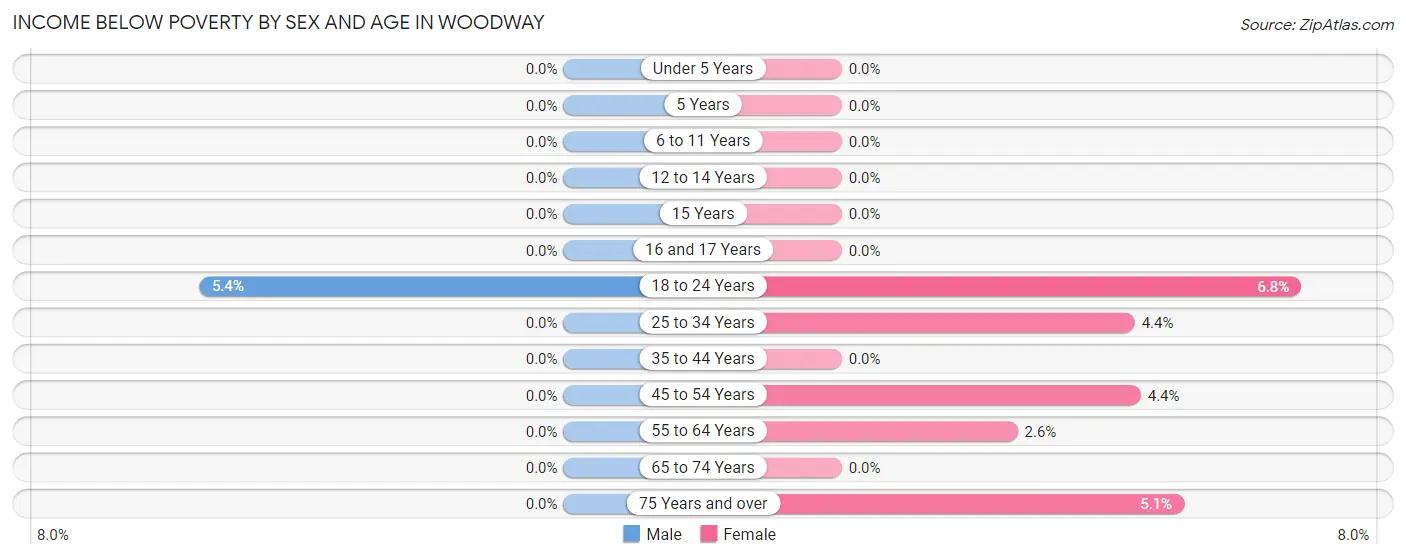
| Age Bracket | Male | Female |
| Under 5 Years | 0 (0.0%) | 0 (0.0%) |
| 5 Years | 0 (0.0%) | 0 (0.0%) |
| 6 to 11 Years | 0 (0.0%) | 0 (0.0%) |
| 12 to 14 Years | 0 (0.0%) | 0 (0.0%) |
| 15 Years | 0 (0.0%) | 0 (0.0%) |
| 16 and 17 Years | 0 (0.0%) | 0 (0.0%) |
| 18 to 24 Years | 2 (5.4%) | 3 (6.8%) |
| 25 to 34 Years | 0 (0.0%) | 1 (4.3%) |
| 35 to 44 Years | 0 (0.0%) | 0 (0.0%) |
| 45 to 54 Years | 0 (0.0%) | 4 (4.4%) |
| 55 to 64 Years | 0 (0.0%) | 3 (2.6%) |
| 65 to 74 Years | 0 (0.0%) | 0 (0.0%) |
| 75 Years and over | 0 (0.0%) | 3 (5.1%) |
| Total | 2 (0.4%) | 14 (2.5%) |
Income Above Poverty by Sex and Age in Woodway
According to the poverty statistics in Woodway, males aged under 5 years and females aged under 5 years are the age groups that are most secure financially, with 100.0% of males and 100.0% of females in these age groups living above the poverty line.
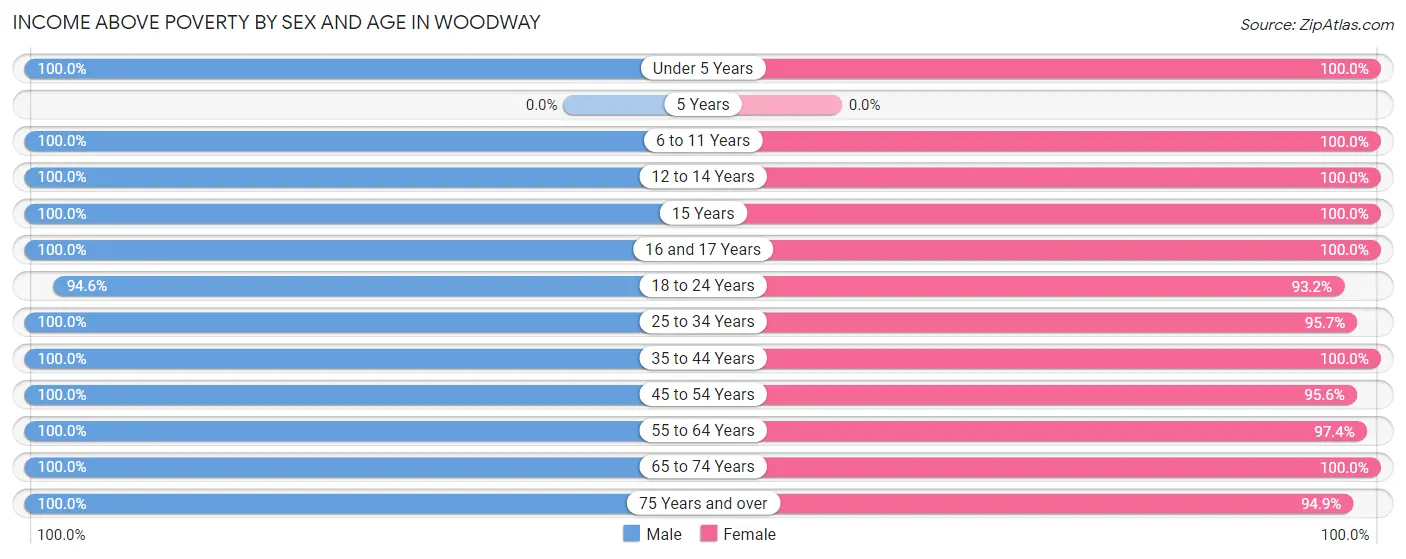
| Age Bracket | Male | Female |
| Under 5 Years | 23 (100.0%) | 12 (100.0%) |
| 5 Years | 0 (0.0%) | 0 (0.0%) |
| 6 to 11 Years | 36 (100.0%) | 41 (100.0%) |
| 12 to 14 Years | 18 (100.0%) | 27 (100.0%) |
| 15 Years | 17 (100.0%) | 5 (100.0%) |
| 16 and 17 Years | 18 (100.0%) | 19 (100.0%) |
| 18 to 24 Years | 35 (94.6%) | 41 (93.2%) |
| 25 to 34 Years | 17 (100.0%) | 22 (95.7%) |
| 35 to 44 Years | 41 (100.0%) | 60 (100.0%) |
| 45 to 54 Years | 110 (100.0%) | 86 (95.6%) |
| 55 to 64 Years | 91 (100.0%) | 112 (97.4%) |
| 65 to 74 Years | 64 (100.0%) | 75 (100.0%) |
| 75 Years and over | 62 (100.0%) | 56 (94.9%) |
| Total | 532 (99.6%) | 556 (97.5%) |
Income Below Poverty Among Married-Couple Families in Woodway
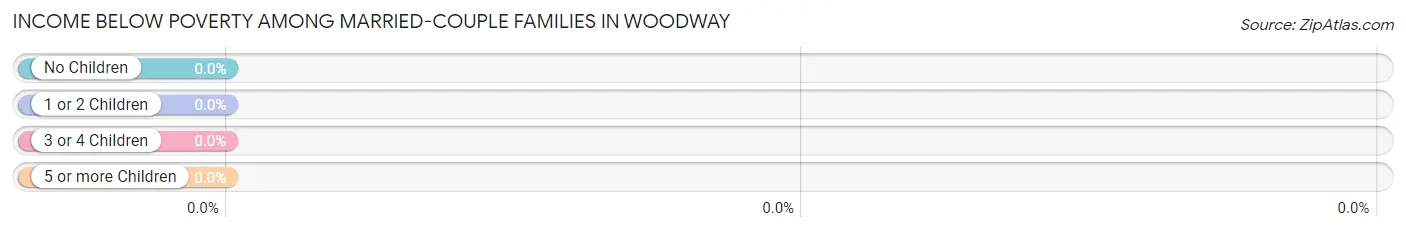
| Children | Above Poverty | Below Poverty |
| No Children | 206 (100.0%) | 0 (0.0%) |
| 1 or 2 Children | 84 (100.0%) | 0 (0.0%) |
| 3 or 4 Children | 8 (100.0%) | 0 (0.0%) |
| 5 or more Children | 0 (0.0%) | 0 (0.0%) |
| Total | 298 (100.0%) | 0 (0.0%) |
Income Below Poverty Among Single-Parent Households in Woodway
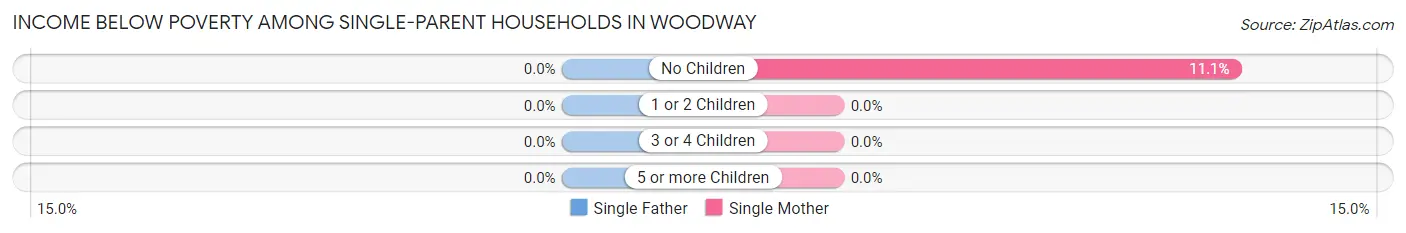
| Children | Single Father | Single Mother |
| No Children | 0 (0.0%) | 3 (11.1%) |
| 1 or 2 Children | 0 (0.0%) | 0 (0.0%) |
| 3 or 4 Children | 0 (0.0%) | 0 (0.0%) |
| 5 or more Children | 0 (0.0%) | 0 (0.0%) |
| Total | 0 (0.0%) | 3 (6.4%) |
Income Below Poverty Among Married-Couple vs Single-Parent Households in Woodway
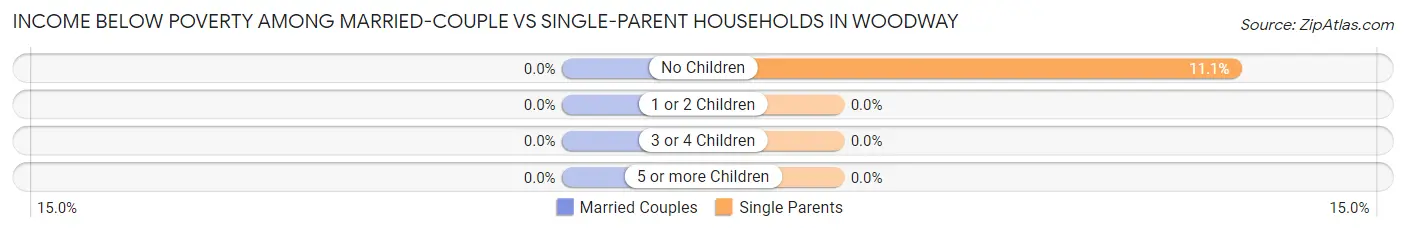
| Children | Married-Couple Families | Single-Parent Households |
| No Children | 0 (0.0%) | 3 (11.1%) |
| 1 or 2 Children | 0 (0.0%) | 0 (0.0%) |
| 3 or 4 Children | 0 (0.0%) | 0 (0.0%) |
| 5 or more Children | 0 (0.0%) | 0 (0.0%) |
| Total | 0 (0.0%) | 3 (4.8%) |
Race in Woodway
The most populous races in Woodway are White / Caucasian (975 | 87.2%), Asian (100 | 8.9%), and Two or more Races (42 | 3.8%).
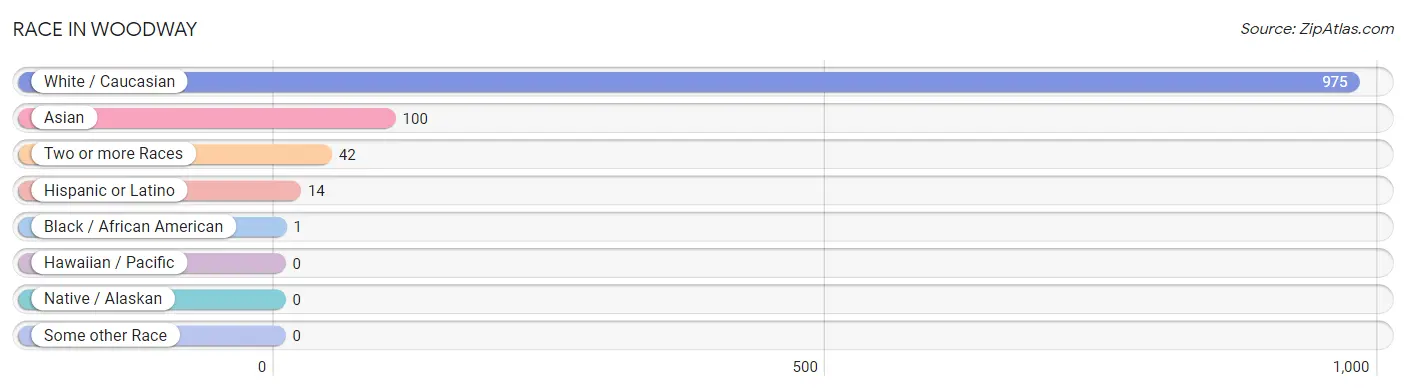
| Race | # Population | % Population |
| Asian | 100 | 8.9% |
| Black / African American | 1 | 0.1% |
| Hawaiian / Pacific | 0 | 0.0% |
| Hispanic or Latino | 14 | 1.3% |
| Native / Alaskan | 0 | 0.0% |
| White / Caucasian | 975 | 87.2% |
| Two or more Races | 42 | 3.8% |
| Some other Race | 0 | 0.0% |
| Total | 1,118 | 100.0% |
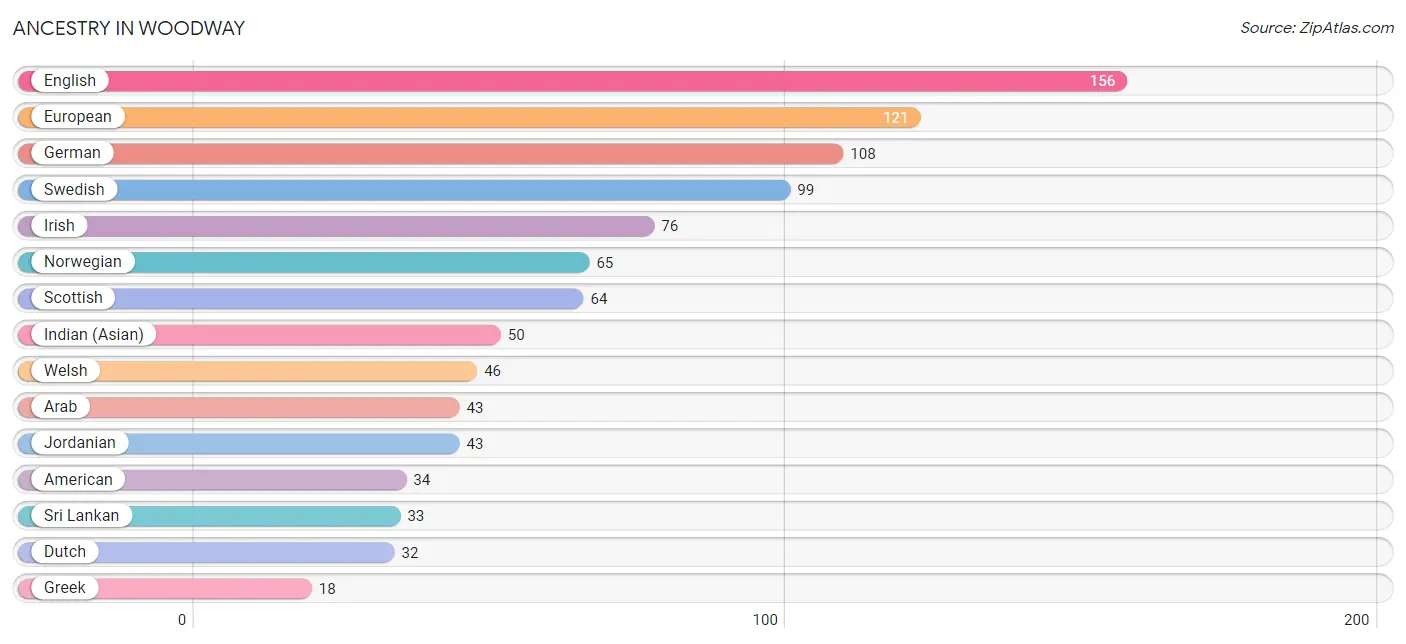
Ancestry in Woodway
The most populous ancestries reported in Woodway are English (156 | 14.0%), European (121 | 10.8%), German (108 | 9.7%), Swedish (99 | 8.9%), and Irish (76 | 6.8%), together accounting for 50.1% of all Woodway residents.
| Ancestry | # Population | % Population |
| American | 34 | 3.0% |
| Arab | 43 | 3.8% |
| Armenian | 8 | 0.7% |
| Austrian | 3 | 0.3% |
| Bhutanese | 15 | 1.3% |
| Blackfeet | 6 | 0.5% |
| British | 16 | 1.4% |
| Bulgarian | 3 | 0.3% |
| Burmese | 8 | 0.7% |
| Canadian | 3 | 0.3% |
| Czech | 3 | 0.3% |
| Danish | 5 | 0.4% |
| Dutch | 32 | 2.9% |
| Eastern European | 3 | 0.3% |
| English | 156 | 14.0% |
| European | 121 | 10.8% |
| French | 9 | 0.8% |
| German | 108 | 9.7% |
| Greek | 18 | 1.6% |
| Hungarian | 3 | 0.3% |
| Icelander | 2 | 0.2% |
| Indian (Asian) | 50 | 4.5% |
| Iranian | 3 | 0.3% |
| Irish | 76 | 6.8% |
| Israeli | 6 | 0.5% |
| Italian | 18 | 1.6% |
| Jordanian | 43 | 3.8% |
| Korean | 5 | 0.4% |
| Lithuanian | 2 | 0.2% |
| Mexican | 14 | 1.3% |
| Northern European | 5 | 0.4% |
| Norwegian | 65 | 5.8% |
| Polish | 3 | 0.3% |
| Portuguese | 2 | 0.2% |
| Russian | 12 | 1.1% |
| Scandinavian | 8 | 0.7% |
| Scotch-Irish | 14 | 1.3% |
| Scottish | 64 | 5.7% |
| Serbian | 8 | 0.7% |
| Slovak | 9 | 0.8% |
| Somali | 1 | 0.1% |
| Sri Lankan | 33 | 2.9% |
| Subsaharan African | 1 | 0.1% |
| Swedish | 99 | 8.9% |
| Swiss | 8 | 0.7% |
| Thai | 12 | 1.1% |
| Ukrainian | 8 | 0.7% |
| Welsh | 46 | 4.1% | View All 48 Rows |
Immigrants in Woodway
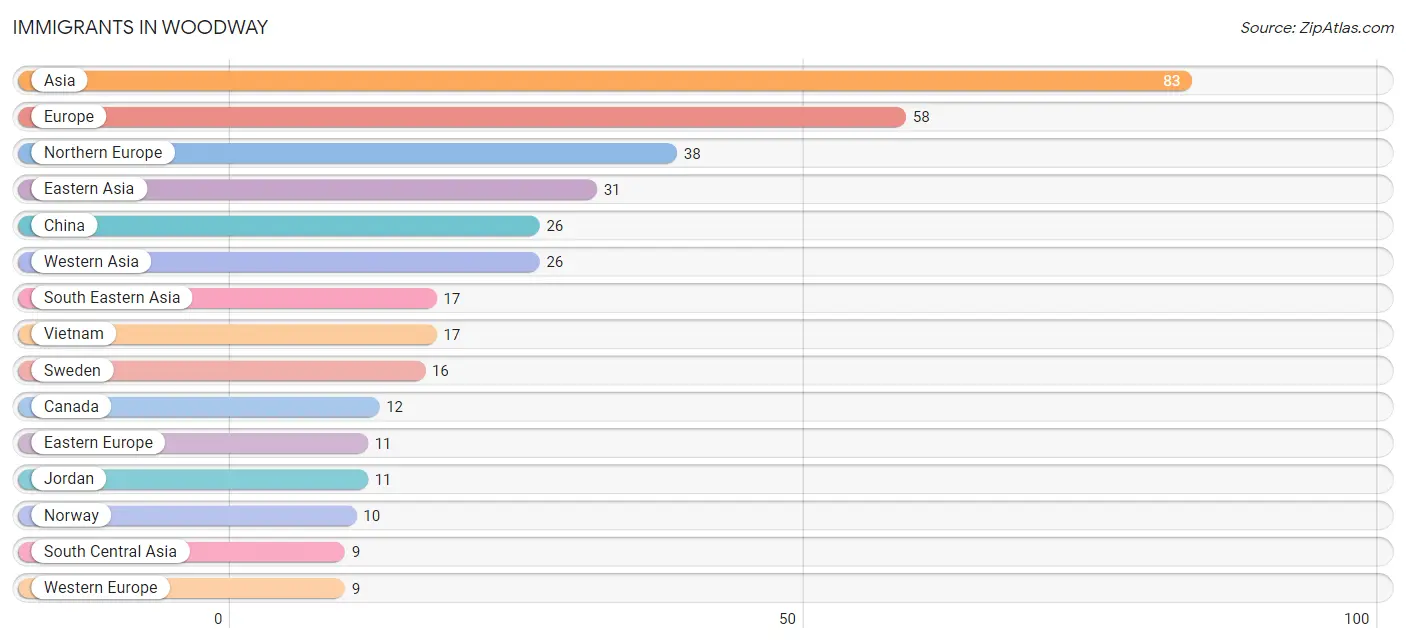
The most numerous immigrant groups reported in Woodway came from Asia (83 | 7.4%), Europe (58 | 5.2%), Northern Europe (38 | 3.4%), Eastern Asia (31 | 2.8%), and China (26 | 2.3%), together accounting for 21.1% of all Woodway residents.
| Immigration Origin | # Population | % Population |
| Africa | 1 | 0.1% |
| Asia | 83 | 7.4% |
| Bulgaria | 3 | 0.3% |
| Canada | 12 | 1.1% |
| China | 26 | 2.3% |
| Czechoslovakia | 2 | 0.2% |
| Eastern Africa | 1 | 0.1% |
| Eastern Asia | 31 | 2.8% |
| Eastern Europe | 11 | 1.0% |
| Europe | 58 | 5.2% |
| France | 4 | 0.4% |
| Germany | 2 | 0.2% |
| India | 6 | 0.5% |
| Iran | 3 | 0.3% |
| Israel | 7 | 0.6% |
| Jordan | 11 | 1.0% |
| Korea | 5 | 0.4% |
| Netherlands | 3 | 0.3% |
| Northern Europe | 38 | 3.4% |
| Norway | 10 | 0.9% |
| Russia | 6 | 0.5% |
| Somalia | 1 | 0.1% |
| South Central Asia | 9 | 0.8% |
| South Eastern Asia | 17 | 1.5% |
| Sweden | 16 | 1.4% |
| Vietnam | 17 | 1.5% |
| Western Asia | 26 | 2.3% |
| Western Europe | 9 | 0.8% | View All 28 Rows |
Sex and Age in Woodway
Sex and Age in Woodway
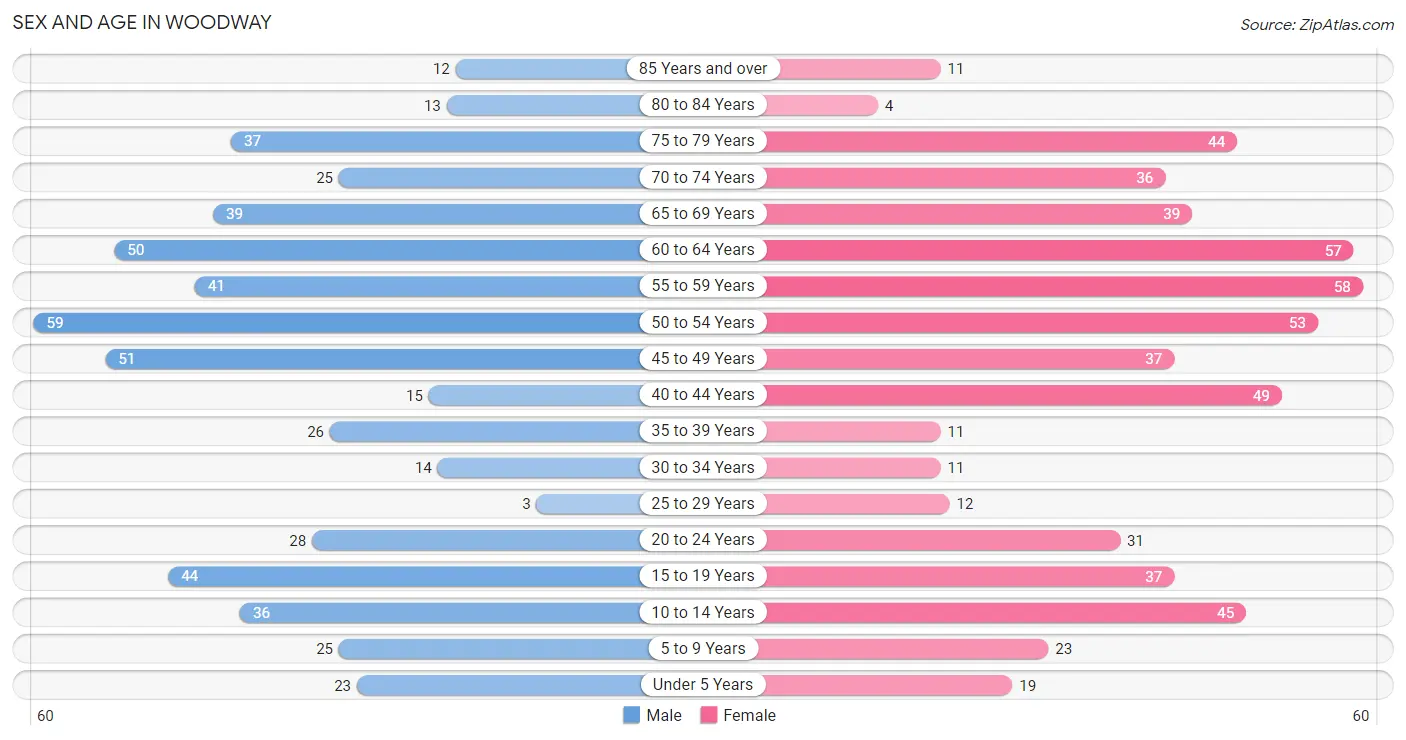
The most populous age groups in Woodway are 50 to 54 Years (59 | 10.9%) for men and 55 to 59 Years (58 | 10.1%) for women.
| Age Bracket | Male | Female |
| Under 5 Years | 23 (4.3%) | 19 (3.3%) |
| 5 to 9 Years | 25 (4.6%) | 23 (4.0%) |
| 10 to 14 Years | 36 (6.7%) | 45 (7.8%) |
| 15 to 19 Years | 44 (8.1%) | 37 (6.4%) |
| 20 to 24 Years | 28 (5.2%) | 31 (5.4%) |
| 25 to 29 Years | 3 (0.5%) | 12 (2.1%) |
| 30 to 34 Years | 14 (2.6%) | 11 (1.9%) |
| 35 to 39 Years | 26 (4.8%) | 11 (1.9%) |
| 40 to 44 Years | 15 (2.8%) | 49 (8.5%) |
| 45 to 49 Years | 51 (9.4%) | 37 (6.4%) |
| 50 to 54 Years | 59 (10.9%) | 53 (9.2%) |
| 55 to 59 Years | 41 (7.6%) | 58 (10.1%) |
| 60 to 64 Years | 50 (9.2%) | 57 (9.9%) |
| 65 to 69 Years | 39 (7.2%) | 39 (6.8%) |
| 70 to 74 Years | 25 (4.6%) | 36 (6.2%) |
| 75 to 79 Years | 37 (6.8%) | 44 (7.6%) |
| 80 to 84 Years | 13 (2.4%) | 4 (0.7%) |
| 85 Years and over | 12 (2.2%) | 11 (1.9%) |
| Total | 541 (100.0%) | 577 (100.0%) |
Families and Households in Woodway
Median Family Size in Woodway
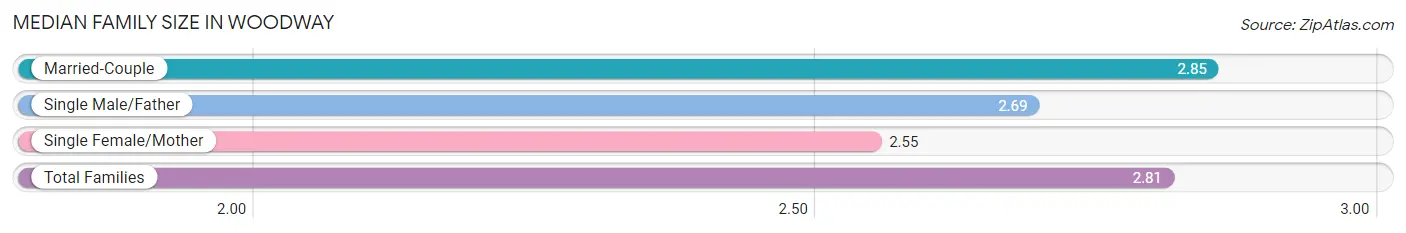
The median family size in Woodway is 2.81 persons per family, with married-couple families (298 | 82.6%) accounting for the largest median family size of 2.85 persons per family. On the other hand, single female/mother families (47 | 13.0%) represent the smallest median family size with 2.55 persons per family.
| Family Type | # Families | Family Size |
| Married-Couple | 298 (82.6%) | 2.85 |
| Single Male/Father | 16 (4.4%) | 2.69 |
| Single Female/Mother | 47 (13.0%) | 2.55 |
| Total Families | 361 (100.0%) | 2.81 |
Median Household Size in Woodway
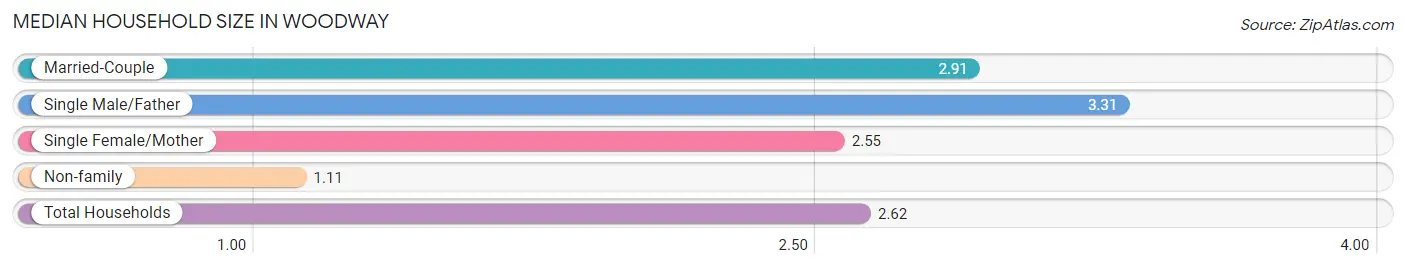
The median household size in Woodway is 2.62 persons per household, with single male/father households (16 | 3.8%) accounting for the largest median household size of 3.31 persons per household. non-family households (63 | 14.9%) represent the smallest median household size with 1.11 persons per household.
| Household Type | # Households | Household Size |
| Married-Couple | 298 (70.3%) | 2.91 |
| Single Male/Father | 16 (3.8%) | 3.31 |
| Single Female/Mother | 47 (11.1%) | 2.55 |
| Non-family | 63 (14.9%) | 1.11 |
| Total Households | 424 (100.0%) | 2.62 |
Household Size by Marriage Status in Woodway
Out of a total of 424 households in Woodway, 361 (85.1%) are family households, while 63 (14.9%) are nonfamily households. The most numerous type of family households are 2-person households, comprising 187, and the most common type of nonfamily households are 1-person households, comprising 57.
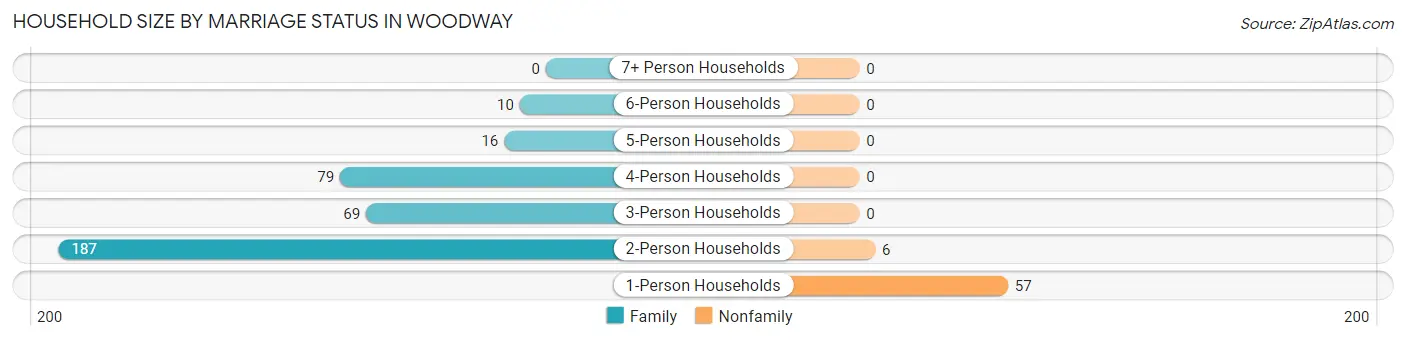
| Household Size | Family Households | Nonfamily Households |
| 1-Person Households | - | 57 (13.4%) |
| 2-Person Households | 187 (44.1%) | 6 (1.4%) |
| 3-Person Households | 69 (16.3%) | 0 (0.0%) |
| 4-Person Households | 79 (18.6%) | 0 (0.0%) |
| 5-Person Households | 16 (3.8%) | 0 (0.0%) |
| 6-Person Households | 10 (2.4%) | 0 (0.0%) |
| 7+ Person Households | 0 (0.0%) | 0 (0.0%) |
| Total | 361 (85.1%) | 63 (14.9%) |
Female Fertility in Woodway
Fertility by Age in Woodway
Average fertility rate in Woodway is 54.0 births per 1,000 women. Women in the age bracket of 35 to 50 years have the highest fertility rate with 70.0 births per 1,000 women. Women in the age bracket of 35 to 50 years acount for 72.7% of all women with births.
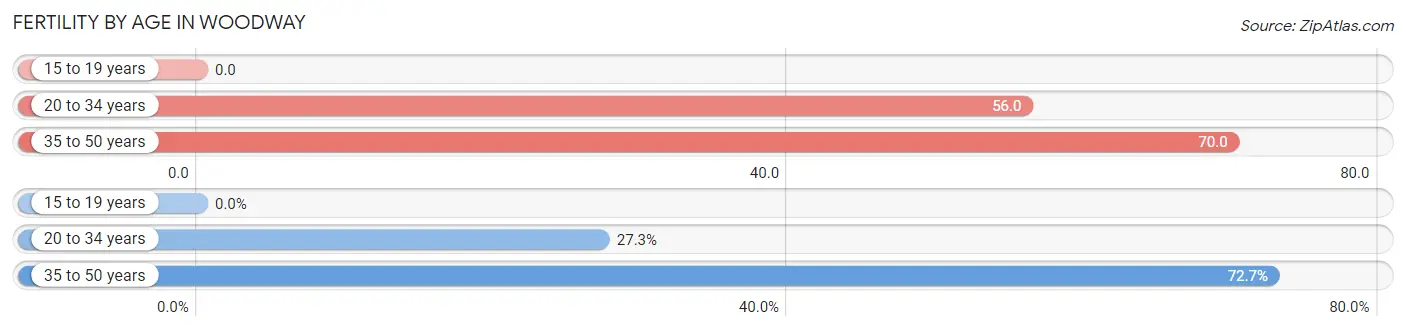
| Age Bracket | Women with Births | Births / 1,000 Women |
| 15 to 19 years | 0 (0.0%) | 0.0 |
| 20 to 34 years | 3 (27.3%) | 56.0 |
| 35 to 50 years | 8 (72.7%) | 70.0 |
| Total | 11 (100.0%) | 54.0 |
Fertility by Age by Marriage Status in Woodway
54.5% of women with births (11) in Woodway are married. The highest percentage of unmarried women with births falls into 20 to 34 years age bracket with 100.0% of them unmarried at the time of birth, while the lowest percentage of unmarried women with births belong to 35 to 50 years age bracket with 25.0% of them unmarried.
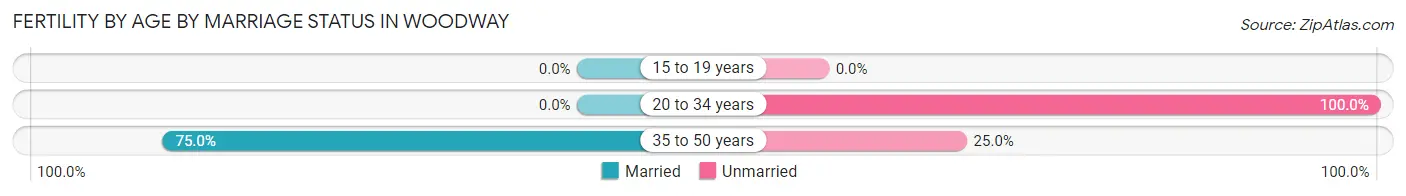
| Age Bracket | Married | Unmarried |
| 15 to 19 years | 0 (0.0%) | 0 (0.0%) |
| 20 to 34 years | 0 (0.0%) | 3 (100.0%) |
| 35 to 50 years | 6 (75.0%) | 2 (25.0%) |
| Total | 6 (54.5%) | 5 (45.5%) |
Fertility by Education in Woodway
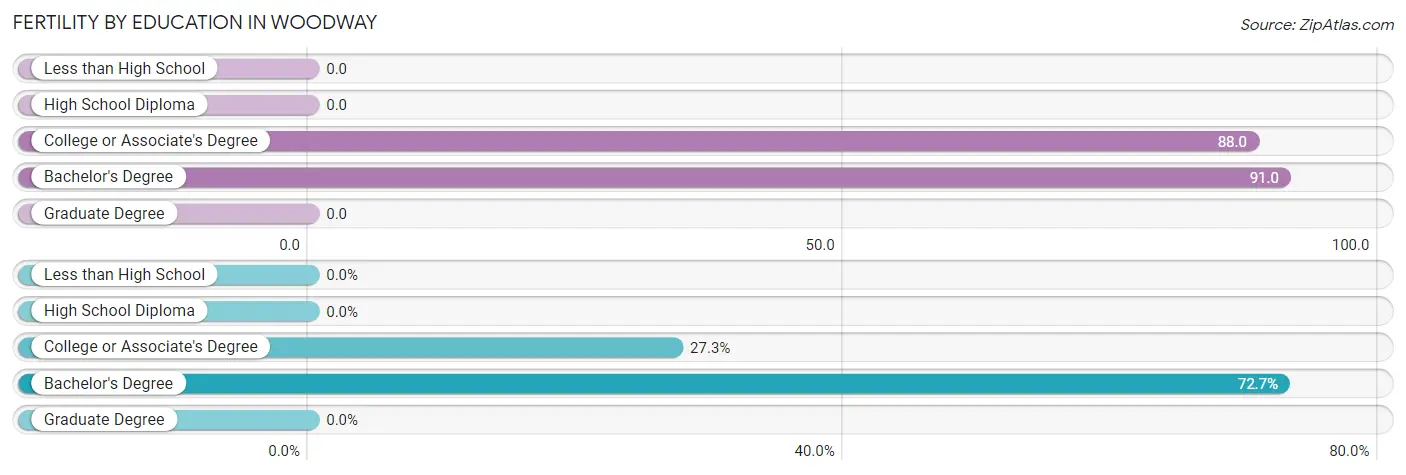
| Educational Attainment | Women with Births | Births / 1,000 Women |
| Less than High School | 0 (0.0%) | 0.0 |
| High School Diploma | 0 (0.0%) | 0.0 |
| College or Associate's Degree | 3 (27.3%) | 88.0 |
| Bachelor's Degree | 8 (72.7%) | 91.0 |
| Graduate Degree | 0 (0.0%) | 0.0 |
| Total | 11 (100.0%) | 54.0 |
Fertility by Education by Marriage Status in Woodway
45.5% of women with births in Woodway are unmarried. Women with the educational attainment of bachelor's degree are most likely to be married with 75.0% of them married at childbirth, while women with the educational attainment of college or associate's degree are least likely to be married with 100.0% of them unmarried at childbirth.
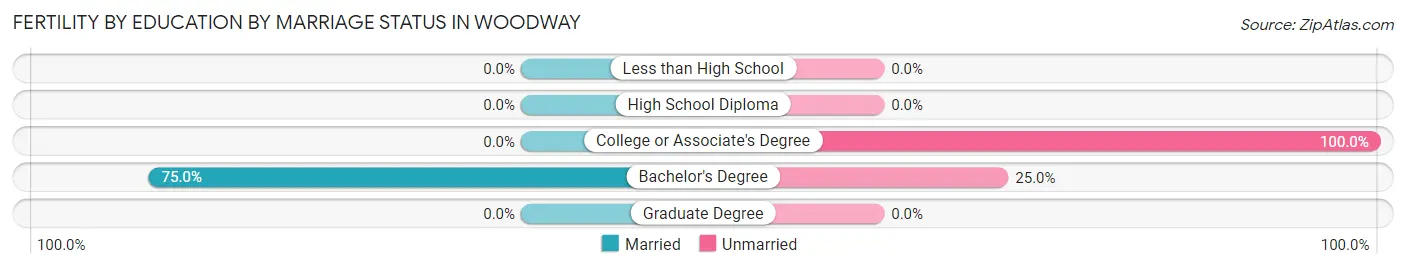
| Educational Attainment | Married | Unmarried |
| Less than High School | 0 (0.0%) | 0 (0.0%) |
| High School Diploma | 0 (0.0%) | 0 (0.0%) |
| College or Associate's Degree | 0 (0.0%) | 3 (100.0%) |
| Bachelor's Degree | 6 (75.0%) | 2 (25.0%) |
| Graduate Degree | 0 (0.0%) | 0 (0.0%) |
| Total | 6 (54.5%) | 5 (45.5%) |
Employment Characteristics in Woodway
Employment by Class of Employer in Woodway
Among the 501 employed individuals in Woodway, private company employees (268 | 53.5%), self-employed (incorporated) (81 | 16.2%), and self-employed (not incorporated) (66 | 13.2%) make up the most common classes of employment.
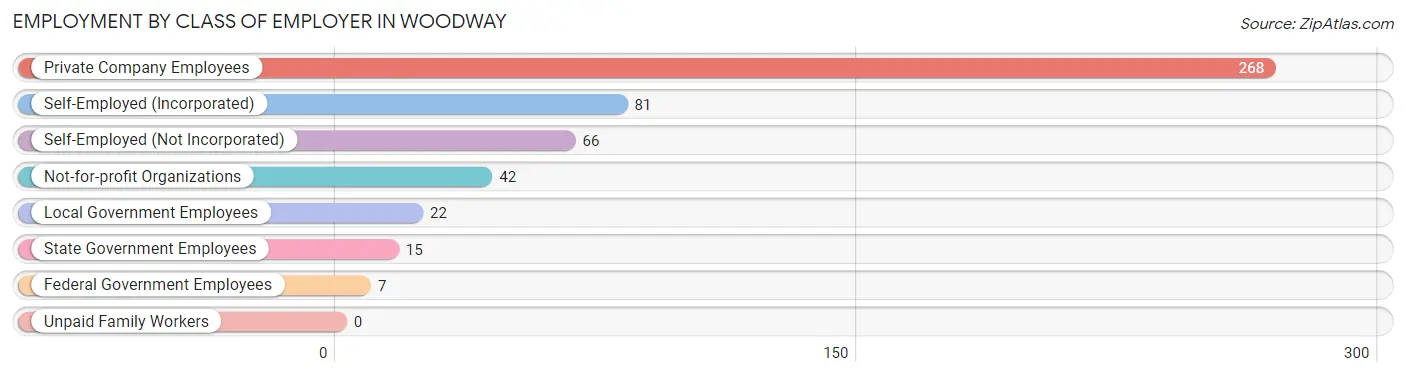
| Employer Class | # Employees | % Employees |
| Private Company Employees | 268 | 53.5% |
| Self-Employed (Incorporated) | 81 | 16.2% |
| Self-Employed (Not Incorporated) | 66 | 13.2% |
| Not-for-profit Organizations | 42 | 8.4% |
| Local Government Employees | 22 | 4.4% |
| State Government Employees | 15 | 3.0% |
| Federal Government Employees | 7 | 1.4% |
| Unpaid Family Workers | 0 | 0.0% |
| Total | 501 | 100.0% |
Employment Status by Age in Woodway
According to the labor force statistics for Woodway, out of the total population over 16 years of age (925), 54.8% or 507 individuals are in the labor force, with 1.2% or 6 of them unemployed. The age group with the highest labor force participation rate is 25 to 29 years, with 100.0% or 15 individuals in the labor force. Within the labor force, the 65 to 74 years age range has the highest percentage of unemployed individuals, with 8.6% or 3 of them being unemployed.
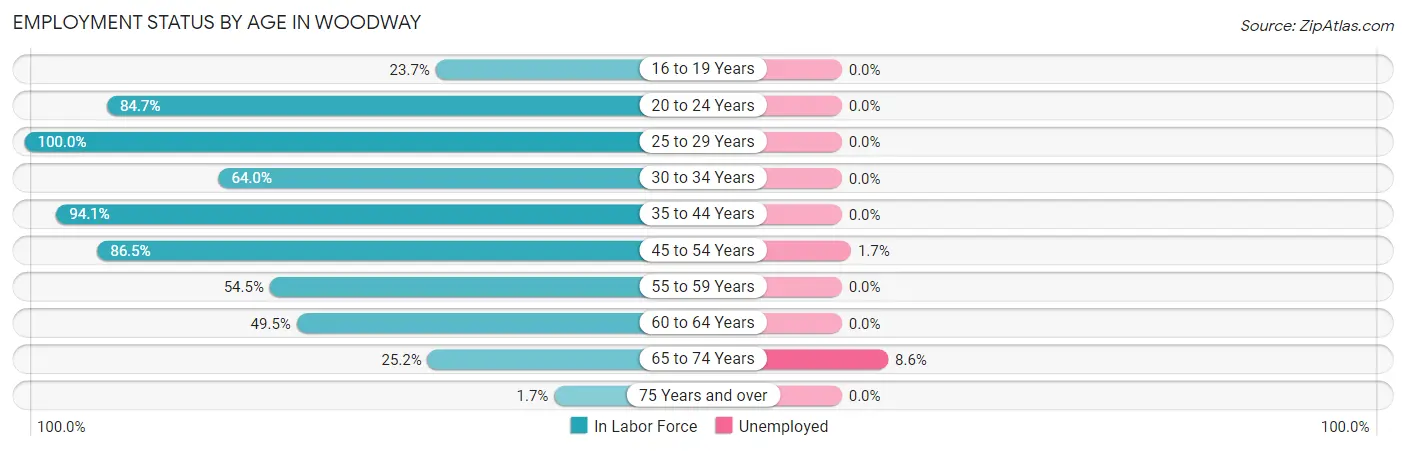
| Age Bracket | In Labor Force | Unemployed |
| 16 to 19 Years | 14 (23.7%) | 0 (0.0%) |
| 20 to 24 Years | 50 (84.7%) | 0 (0.0%) |
| 25 to 29 Years | 15 (100.0%) | 0 (0.0%) |
| 30 to 34 Years | 16 (64.0%) | 0 (0.0%) |
| 35 to 44 Years | 95 (94.1%) | 0 (0.0%) |
| 45 to 54 Years | 173 (86.5%) | 3 (1.7%) |
| 55 to 59 Years | 54 (54.5%) | 0 (0.0%) |
| 60 to 64 Years | 53 (49.5%) | 0 (0.0%) |
| 65 to 74 Years | 35 (25.2%) | 3 (8.6%) |
| 75 Years and over | 2 (1.7%) | 0 (0.0%) |
| Total | 507 (54.8%) | 6 (1.2%) |
Employment Status by Educational Attainment in Woodway
According to labor force statistics for Woodway, 74.2% of individuals (406) out of the total population between 25 and 64 years of age (547) are in the labor force, with 0.7% or 3 of them being unemployed. The group with the highest labor force participation rate are those with the educational attainment of less than high school, with 87.5% or 7 individuals in the labor force. Within the labor force, individuals with college / associate degree education have the highest percentage of unemployment, with 1.7% or 1 of them being unemployed.
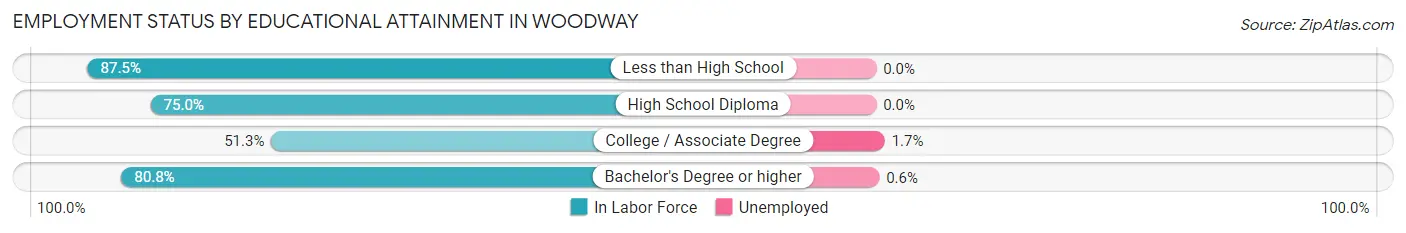
| Educational Attainment | In Labor Force | Unemployed |
| Less than High School | 7 (87.5%) | 0 (0.0%) |
| High School Diploma | 24 (75.0%) | 0 (0.0%) |
| College / Associate Degree | 60 (51.3%) | 2 (1.7%) |
| Bachelor's Degree or higher | 315 (80.8%) | 2 (0.6%) |
| Total | 406 (74.2%) | 4 (0.7%) |
Employment Occupations by Sex in Woodway
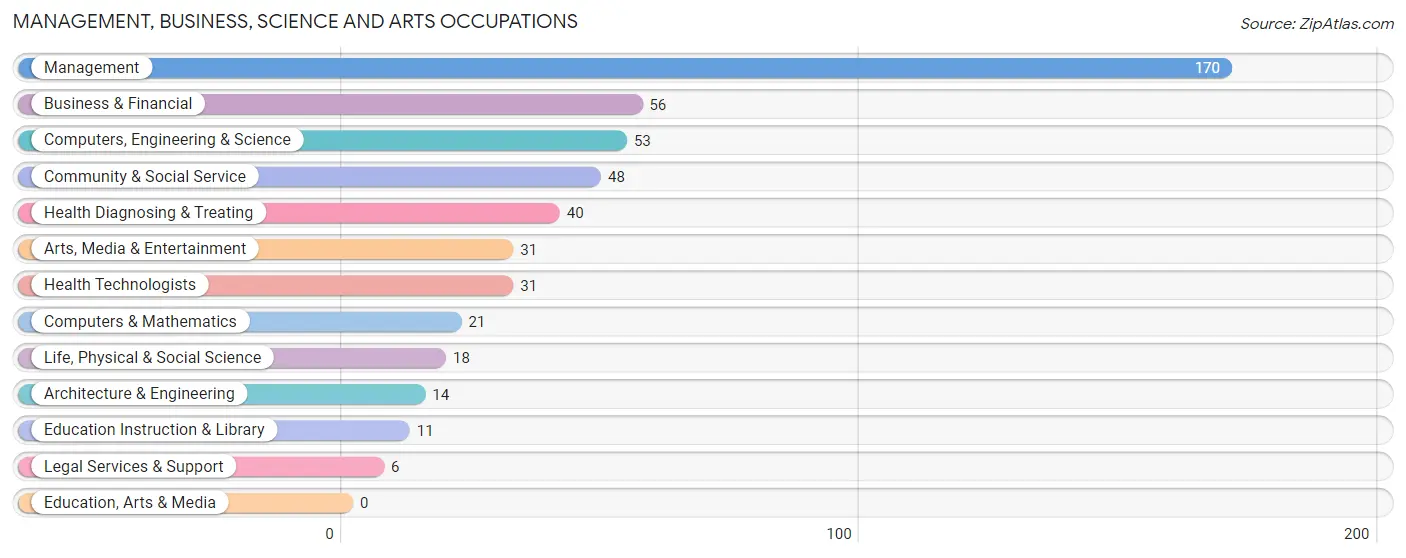
Management, Business, Science and Arts Occupations
The most common Management, Business, Science and Arts occupations in Woodway are Management (170 | 33.9%), Business & Financial (56 | 11.2%), Computers, Engineering & Science (53 | 10.6%), Community & Social Service (48 | 9.6%), and Health Diagnosing & Treating (40 | 8.0%).
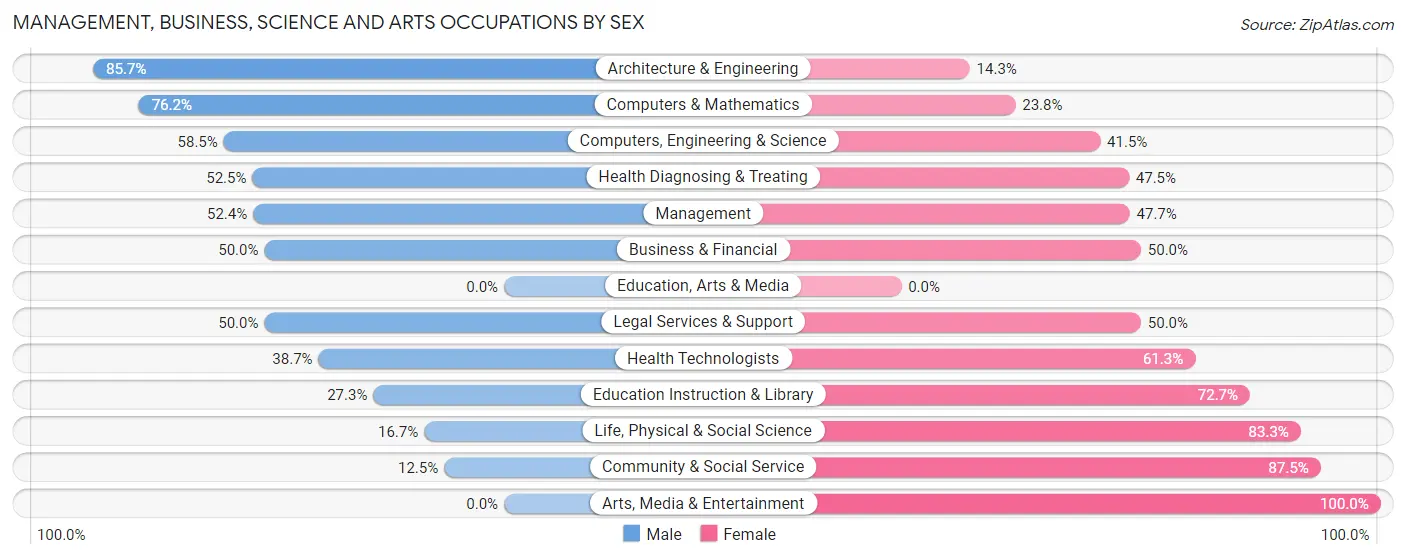
Management, Business, Science and Arts Occupations by Sex
Within the Management, Business, Science and Arts occupations in Woodway, the most male-oriented occupations are Architecture & Engineering (85.7%), Computers & Mathematics (76.2%), and Computers, Engineering & Science (58.5%), while the most female-oriented occupations are Arts, Media & Entertainment (100.0%), Community & Social Service (87.5%), and Life, Physical & Social Science (83.3%).
| Occupation | Male | Female |
| Management | 89 (52.3%) | 81 (47.6%) |
| Business & Financial | 28 (50.0%) | 28 (50.0%) |
| Computers, Engineering & Science | 31 (58.5%) | 22 (41.5%) |
| Computers & Mathematics | 16 (76.2%) | 5 (23.8%) |
| Architecture & Engineering | 12 (85.7%) | 2 (14.3%) |
| Life, Physical & Social Science | 3 (16.7%) | 15 (83.3%) |
| Community & Social Service | 6 (12.5%) | 42 (87.5%) |
| Education, Arts & Media | 0 (0.0%) | 0 (0.0%) |
| Legal Services & Support | 3 (50.0%) | 3 (50.0%) |
| Education Instruction & Library | 3 (27.3%) | 8 (72.7%) |
| Arts, Media & Entertainment | 0 (0.0%) | 31 (100.0%) |
| Health Diagnosing & Treating | 21 (52.5%) | 19 (47.5%) |
| Health Technologists | 12 (38.7%) | 19 (61.3%) |
| Total (Category) | 175 (47.7%) | 192 (52.3%) |
| Total (Overall) | 269 (53.7%) | 232 (46.3%) |
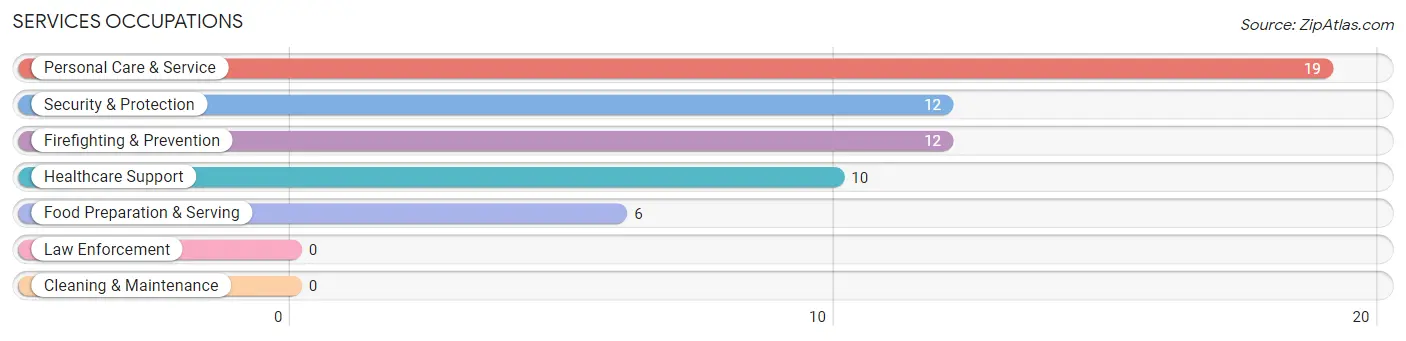
Services Occupations
The most common Services occupations in Woodway are Personal Care & Service (19 | 3.8%), Security & Protection (12 | 2.4%), Firefighting & Prevention (12 | 2.4%), Healthcare Support (10 | 2.0%), and Food Preparation & Serving (6 | 1.2%).
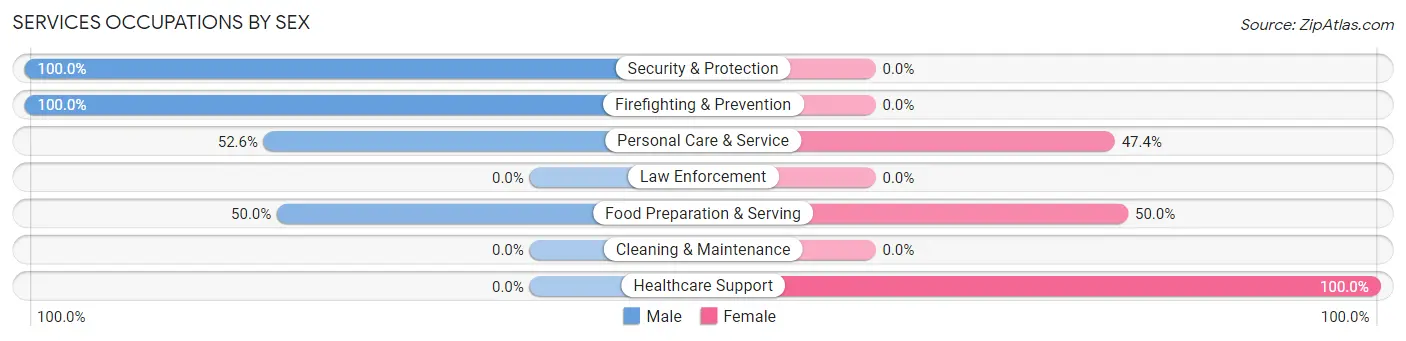
Services Occupations by Sex
Within the Services occupations in Woodway, the most male-oriented occupations are Security & Protection (100.0%), Firefighting & Prevention (100.0%), and Personal Care & Service (52.6%), while the most female-oriented occupations are Healthcare Support (100.0%), Food Preparation & Serving (50.0%), and Personal Care & Service (47.4%).
| Occupation | Male | Female |
| Healthcare Support | 0 (0.0%) | 10 (100.0%) |
| Security & Protection | 12 (100.0%) | 0 (0.0%) |
| Firefighting & Prevention | 12 (100.0%) | 0 (0.0%) |
| Law Enforcement | 0 (0.0%) | 0 (0.0%) |
| Food Preparation & Serving | 3 (50.0%) | 3 (50.0%) |
| Cleaning & Maintenance | 0 (0.0%) | 0 (0.0%) |
| Personal Care & Service | 10 (52.6%) | 9 (47.4%) |
| Total (Category) | 25 (53.2%) | 22 (46.8%) |
| Total (Overall) | 269 (53.7%) | 232 (46.3%) |
Sales and Office Occupations
The most common Sales and Office occupations in Woodway are Sales & Related (65 | 13.0%), and Office & Administration (9 | 1.8%).

Sales and Office Occupations by Sex

| Occupation | Male | Female |
| Sales & Related | 53 (81.5%) | 12 (18.5%) |
| Office & Administration | 3 (33.3%) | 6 (66.7%) |
| Total (Category) | 56 (75.7%) | 18 (24.3%) |
| Total (Overall) | 269 (53.7%) | 232 (46.3%) |
Natural Resources, Construction and Maintenance Occupations
The most common Natural Resources, Construction and Maintenance occupations in Woodway are Installation, Maintenance & Repair (6 | 1.2%), Farming, Fishing & Forestry (4 | 0.8%), and Construction & Extraction (3 | 0.6%).
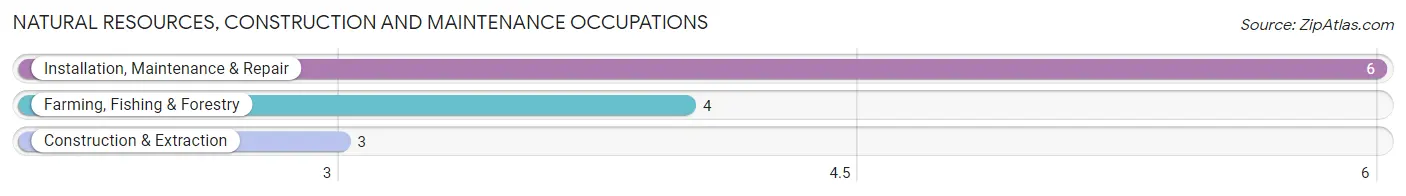
Natural Resources, Construction and Maintenance Occupations by Sex
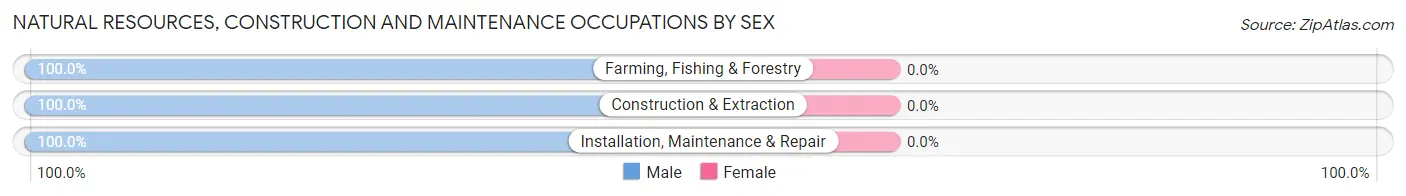
| Occupation | Male | Female |
| Farming, Fishing & Forestry | 4 (100.0%) | 0 (0.0%) |
| Construction & Extraction | 3 (100.0%) | 0 (0.0%) |
| Installation, Maintenance & Repair | 6 (100.0%) | 0 (0.0%) |
| Total (Category) | 13 (100.0%) | 0 (0.0%) |
| Total (Overall) | 269 (53.7%) | 232 (46.3%) |
Production, Transportation and Moving Occupations
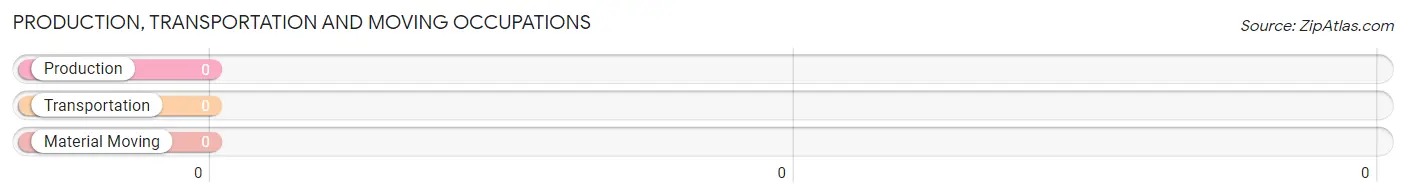
Production, Transportation and Moving Occupations by Sex
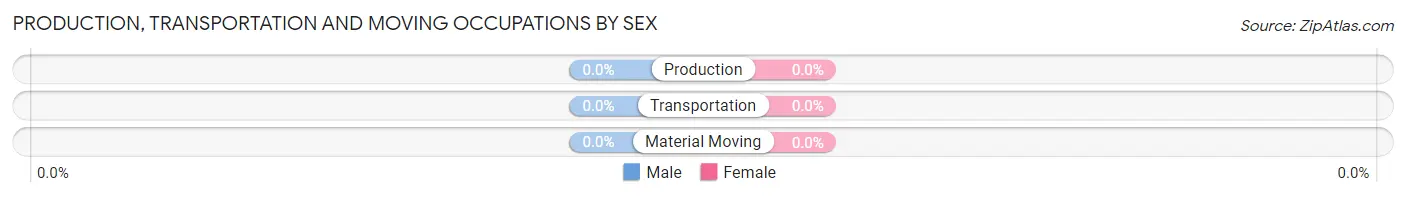
| Occupation | Male | Female |
| Production | 0 (0.0%) | 0 (0.0%) |
| Transportation | 0 (0.0%) | 0 (0.0%) |
| Material Moving | 0 (0.0%) | 0 (0.0%) |
| Total (Category) | 0 (0.0%) | 0 (0.0%) |
| Total (Overall) | 269 (53.7%) | 232 (46.3%) |
Employment Industries by Sex in Woodway
Employment Industries in Woodway
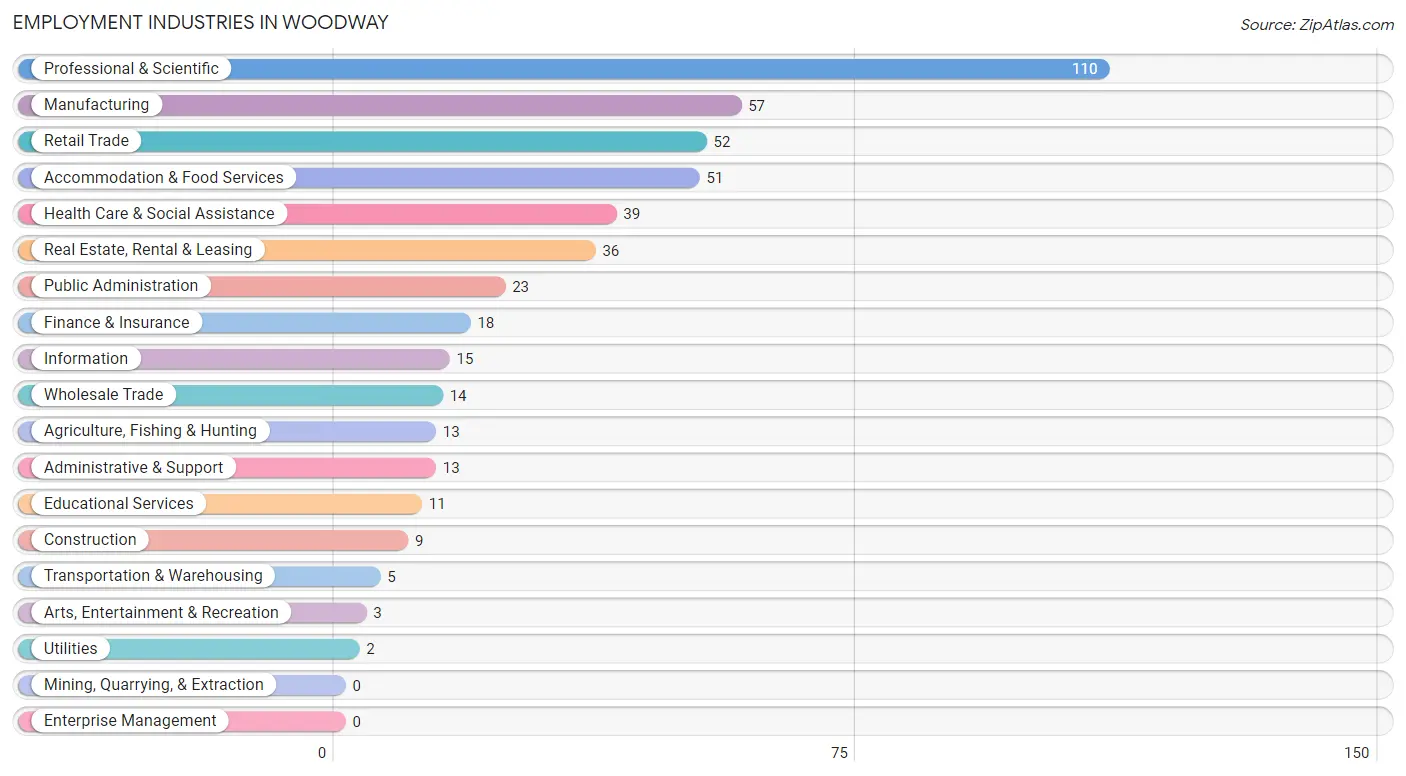
The major employment industries in Woodway include Professional & Scientific (110 | 22.0%), Manufacturing (57 | 11.4%), Retail Trade (52 | 10.4%), Accommodation & Food Services (51 | 10.2%), and Health Care & Social Assistance (39 | 7.8%).
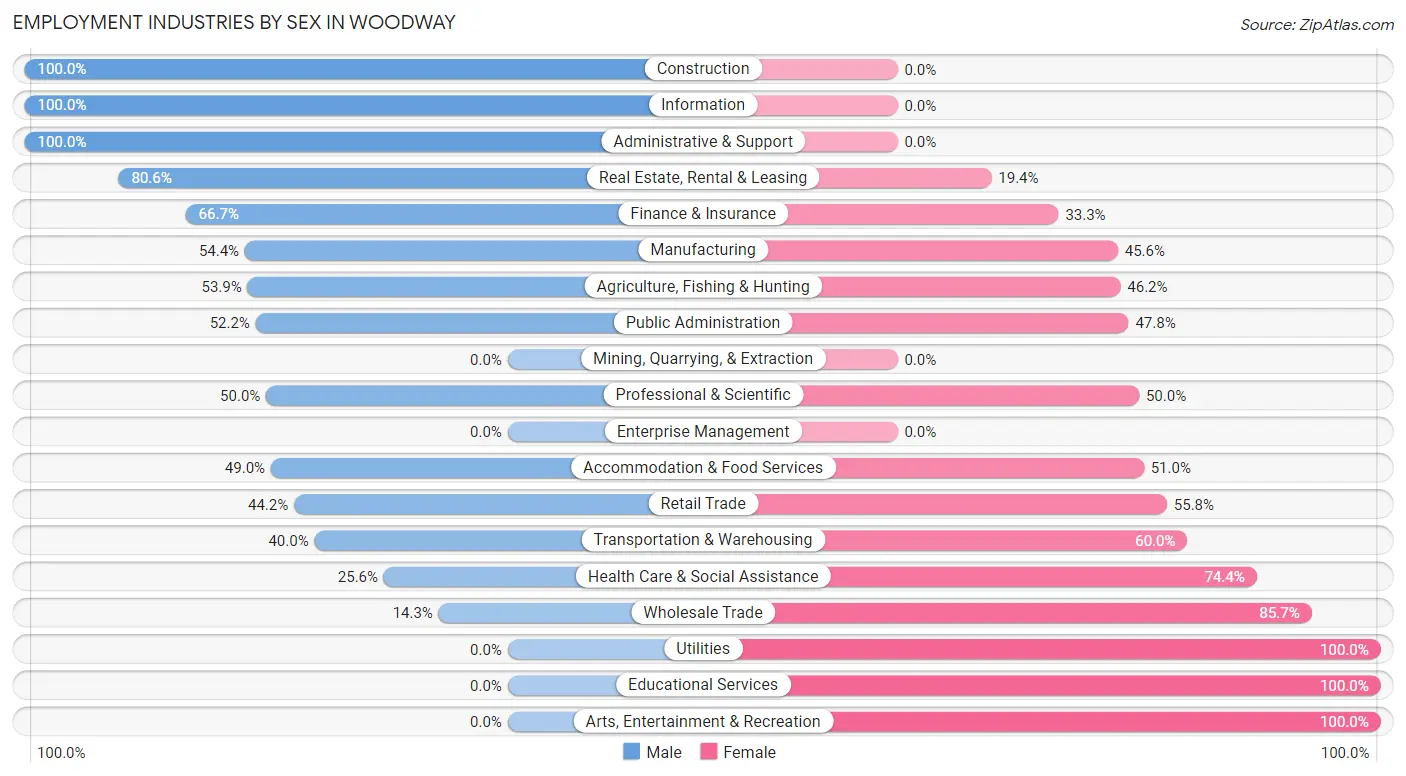
Employment Industries by Sex in Woodway
The Woodway industries that see more men than women are Construction (100.0%), Information (100.0%), and Administrative & Support (100.0%), whereas the industries that tend to have a higher number of women are Utilities (100.0%), Educational Services (100.0%), and Arts, Entertainment & Recreation (100.0%).
| Industry | Male | Female |
| Agriculture, Fishing & Hunting | 7 (53.8%) | 6 (46.2%) |
| Mining, Quarrying, & Extraction | 0 (0.0%) | 0 (0.0%) |
| Construction | 9 (100.0%) | 0 (0.0%) |
| Manufacturing | 31 (54.4%) | 26 (45.6%) |
| Wholesale Trade | 2 (14.3%) | 12 (85.7%) |
| Retail Trade | 23 (44.2%) | 29 (55.8%) |
| Transportation & Warehousing | 2 (40.0%) | 3 (60.0%) |
| Utilities | 0 (0.0%) | 2 (100.0%) |
| Information | 15 (100.0%) | 0 (0.0%) |
| Finance & Insurance | 12 (66.7%) | 6 (33.3%) |
| Real Estate, Rental & Leasing | 29 (80.6%) | 7 (19.4%) |
| Professional & Scientific | 55 (50.0%) | 55 (50.0%) |
| Enterprise Management | 0 (0.0%) | 0 (0.0%) |
| Administrative & Support | 13 (100.0%) | 0 (0.0%) |
| Educational Services | 0 (0.0%) | 11 (100.0%) |
| Health Care & Social Assistance | 10 (25.6%) | 29 (74.4%) |
| Arts, Entertainment & Recreation | 0 (0.0%) | 3 (100.0%) |
| Accommodation & Food Services | 25 (49.0%) | 26 (51.0%) |
| Public Administration | 12 (52.2%) | 11 (47.8%) |
| Total | 269 (53.7%) | 232 (46.3%) |
Education in Woodway
School Enrollment in Woodway
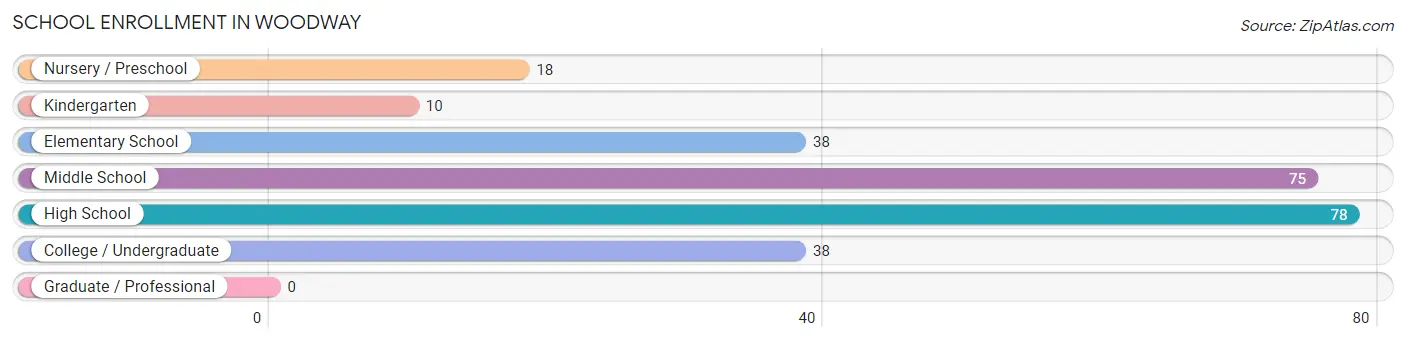
The most common levels of schooling among the 257 students in Woodway are high school (78 | 30.3%), middle school (75 | 29.2%), and elementary school (38 | 14.8%).
| School Level | # Students | % Students |
| Nursery / Preschool | 18 | 7.0% |
| Kindergarten | 10 | 3.9% |
| Elementary School | 38 | 14.8% |
| Middle School | 75 | 29.2% |
| High School | 78 | 30.3% |
| College / Undergraduate | 38 | 14.8% |
| Graduate / Professional | 0 | 0.0% |
| Total | 257 | 100.0% |
School Enrollment by Age by Funding Source in Woodway
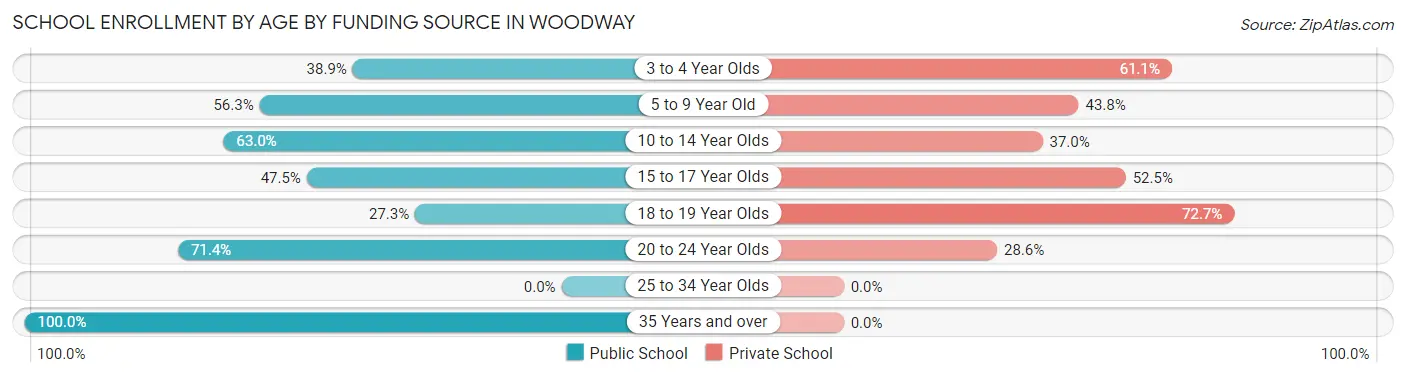
Out of a total of 257 students who are enrolled in schools in Woodway, 115 (44.7%) attend a private institution, while the remaining 142 (55.3%) are enrolled in public schools. The age group of 18 to 19 year olds has the highest likelihood of being enrolled in private schools, with 16 (72.7% in the age bracket) enrolled. Conversely, the age group of 35 years and over has the lowest likelihood of being enrolled in a private school, with 8 (100.0% in the age bracket) attending a public institution.
| Age Bracket | Public School | Private School |
| 3 to 4 Year Olds | 7 (38.9%) | 11 (61.1%) |
| 5 to 9 Year Old | 27 (56.2%) | 21 (43.8%) |
| 10 to 14 Year Olds | 51 (63.0%) | 30 (37.0%) |
| 15 to 17 Year Olds | 28 (47.5%) | 31 (52.5%) |
| 18 to 19 Year Olds | 6 (27.3%) | 16 (72.7%) |
| 20 to 24 Year Olds | 15 (71.4%) | 6 (28.6%) |
| 25 to 34 Year Olds | 0 (0.0%) | 0 (0.0%) |
| 35 Years and over | 8 (100.0%) | 0 (0.0%) |
| Total | 142 (55.3%) | 115 (44.7%) |
Educational Attainment by Field of Study in Woodway
Business (138 | 21.5%), education (71 | 11.1%), bio, nature & agricultural (65 | 10.1%), engineering (57 | 8.9%), and science & technology (56 | 8.7%) are the most common fields of study among 642 individuals in Woodway who have obtained a bachelor's degree or higher.
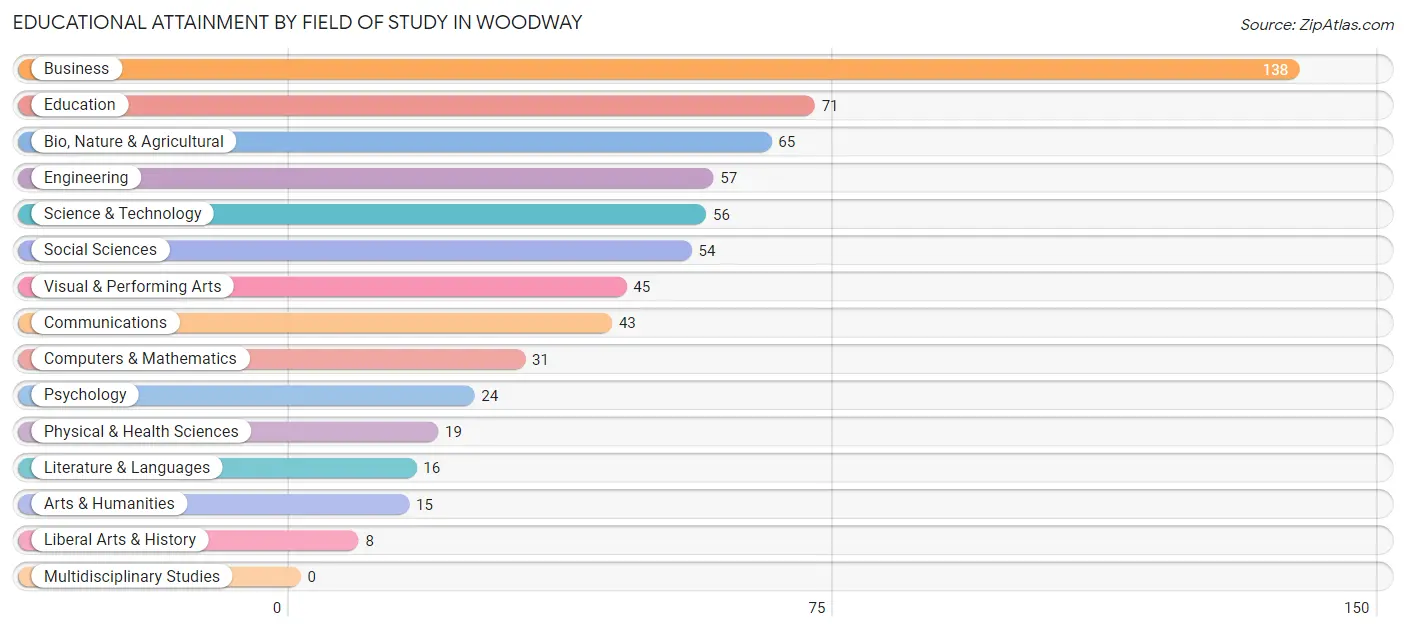
| Field of Study | # Graduates | % Graduates |
| Computers & Mathematics | 31 | 4.8% |
| Bio, Nature & Agricultural | 65 | 10.1% |
| Physical & Health Sciences | 19 | 3.0% |
| Psychology | 24 | 3.7% |
| Social Sciences | 54 | 8.4% |
| Engineering | 57 | 8.9% |
| Multidisciplinary Studies | 0 | 0.0% |
| Science & Technology | 56 | 8.7% |
| Business | 138 | 21.5% |
| Education | 71 | 11.1% |
| Literature & Languages | 16 | 2.5% |
| Liberal Arts & History | 8 | 1.3% |
| Visual & Performing Arts | 45 | 7.0% |
| Communications | 43 | 6.7% |
| Arts & Humanities | 15 | 2.3% |
| Total | 642 | 100.0% |
Transportation & Commute in Woodway
Vehicle Availability by Sex in Woodway
The most prevalent vehicle ownership categories in Woodway are males with 2 vehicles (119, accounting for 44.2%) and females with 2 vehicles (79, making up 51.3%).
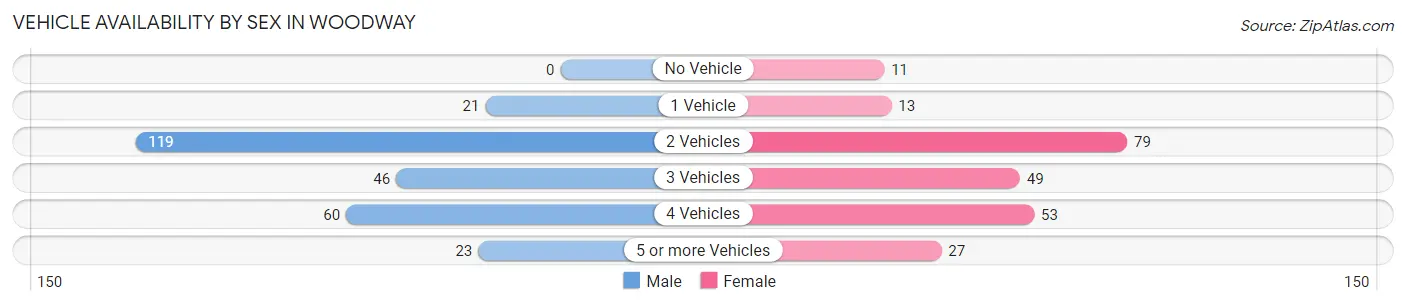
| Vehicles Available | Male | Female |
| No Vehicle | 0 (0.0%) | 11 (4.7%) |
| 1 Vehicle | 21 (7.8%) | 13 (5.6%) |
| 2 Vehicles | 119 (44.2%) | 79 (34.1%) |
| 3 Vehicles | 46 (17.1%) | 49 (21.1%) |
| 4 Vehicles | 60 (22.3%) | 53 (22.8%) |
| 5 or more Vehicles | 23 (8.6%) | 27 (11.6%) |
| Total | 269 (100.0%) | 232 (100.0%) |
Commute Time in Woodway
The most frequently occuring commute durations in Woodway are 10 to 14 minutes (57 commuters, 16.9%), 45 to 59 minutes (57 commuters, 16.9%), and 30 to 34 minutes (43 commuters, 12.7%).
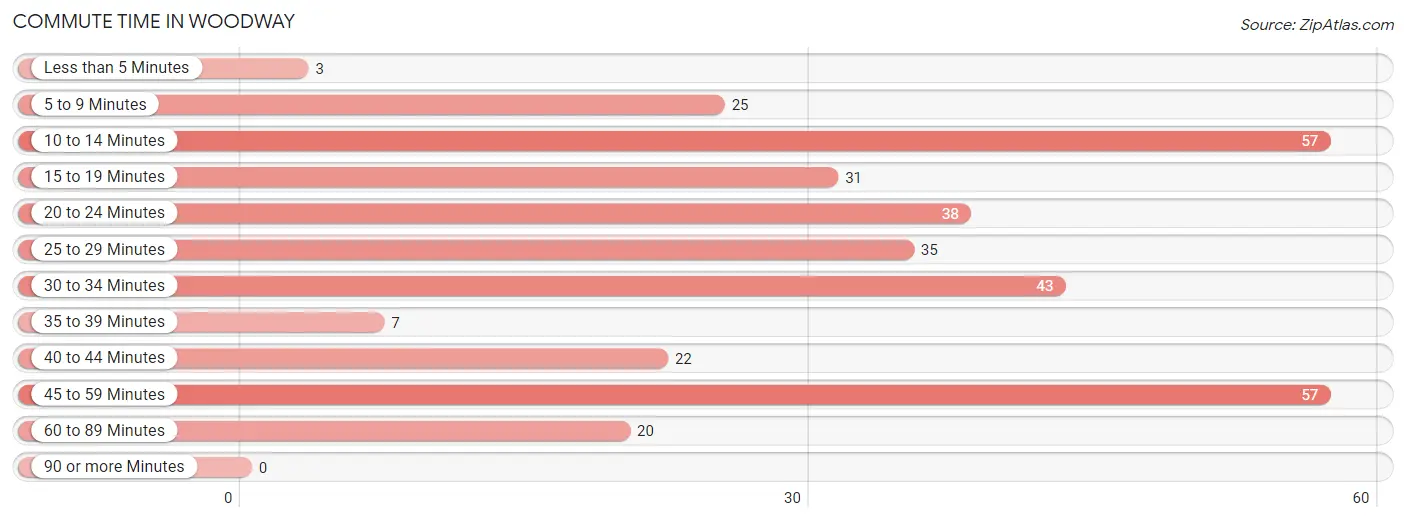
| Commute Time | # Commuters | % Commuters |
| Less than 5 Minutes | 3 | 0.9% |
| 5 to 9 Minutes | 25 | 7.4% |
| 10 to 14 Minutes | 57 | 16.9% |
| 15 to 19 Minutes | 31 | 9.2% |
| 20 to 24 Minutes | 38 | 11.2% |
| 25 to 29 Minutes | 35 | 10.4% |
| 30 to 34 Minutes | 43 | 12.7% |
| 35 to 39 Minutes | 7 | 2.1% |
| 40 to 44 Minutes | 22 | 6.5% |
| 45 to 59 Minutes | 57 | 16.9% |
| 60 to 89 Minutes | 20 | 5.9% |
| 90 or more Minutes | 0 | 0.0% |
Commute Time by Sex in Woodway
The most common commute times in Woodway are 30 to 34 minutes (32 commuters, 16.9%) for males and 10 to 14 minutes (38 commuters, 25.5%) for females.
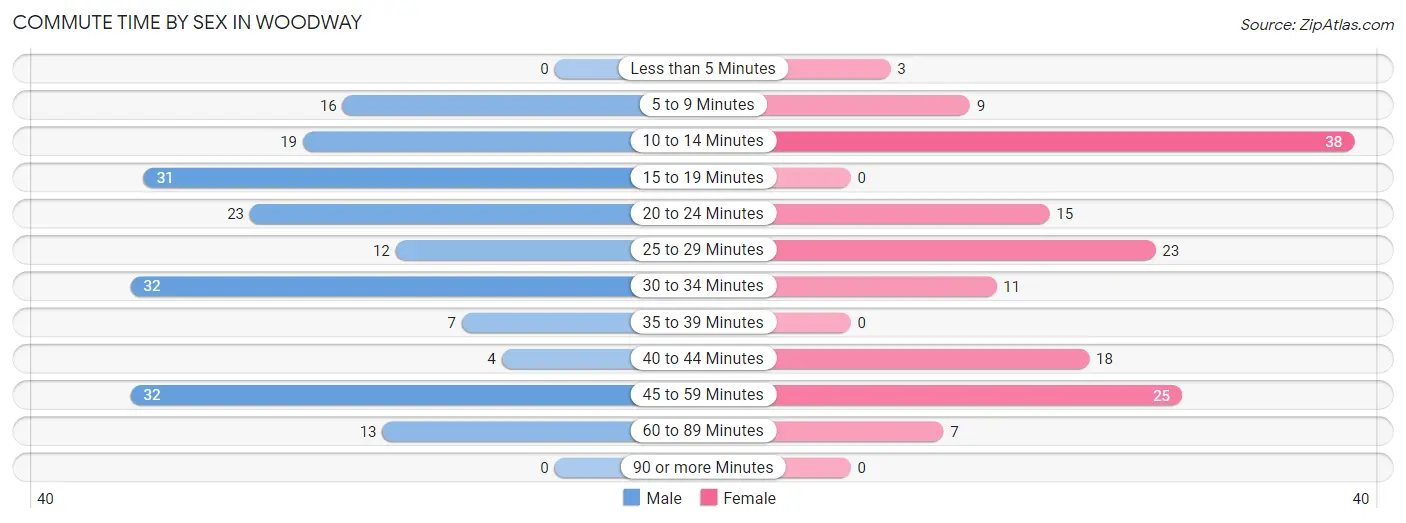
| Commute Time | Male | Female |
| Less than 5 Minutes | 0 (0.0%) | 3 (2.0%) |
| 5 to 9 Minutes | 16 (8.5%) | 9 (6.0%) |
| 10 to 14 Minutes | 19 (10.1%) | 38 (25.5%) |
| 15 to 19 Minutes | 31 (16.4%) | 0 (0.0%) |
| 20 to 24 Minutes | 23 (12.2%) | 15 (10.1%) |
| 25 to 29 Minutes | 12 (6.4%) | 23 (15.4%) |
| 30 to 34 Minutes | 32 (16.9%) | 11 (7.4%) |
| 35 to 39 Minutes | 7 (3.7%) | 0 (0.0%) |
| 40 to 44 Minutes | 4 (2.1%) | 18 (12.1%) |
| 45 to 59 Minutes | 32 (16.9%) | 25 (16.8%) |
| 60 to 89 Minutes | 13 (6.9%) | 7 (4.7%) |
| 90 or more Minutes | 0 (0.0%) | 0 (0.0%) |
Time of Departure to Work by Sex in Woodway
The most frequent times of departure to work in Woodway are 7:00 AM to 7:29 AM (28, 14.8%) for males and 7:00 AM to 7:29 AM (44, 29.5%) for females.
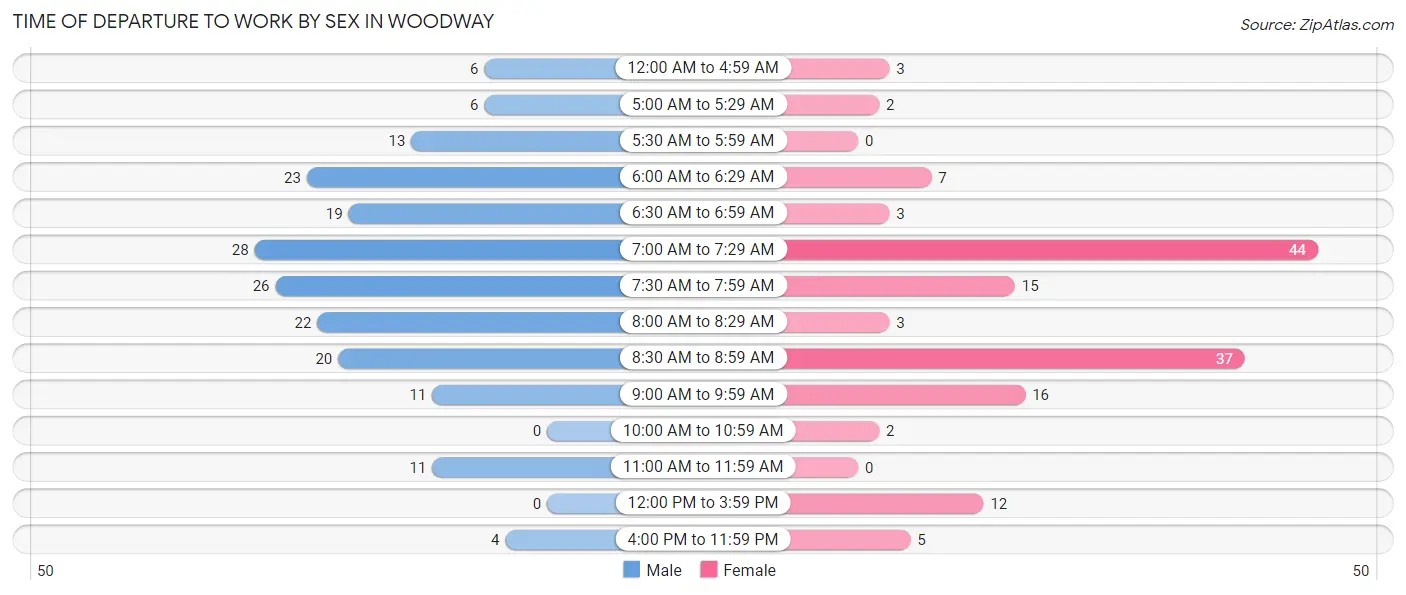
| Time of Departure | Male | Female |
| 12:00 AM to 4:59 AM | 6 (3.2%) | 3 (2.0%) |
| 5:00 AM to 5:29 AM | 6 (3.2%) | 2 (1.3%) |
| 5:30 AM to 5:59 AM | 13 (6.9%) | 0 (0.0%) |
| 6:00 AM to 6:29 AM | 23 (12.2%) | 7 (4.7%) |
| 6:30 AM to 6:59 AM | 19 (10.1%) | 3 (2.0%) |
| 7:00 AM to 7:29 AM | 28 (14.8%) | 44 (29.5%) |
| 7:30 AM to 7:59 AM | 26 (13.8%) | 15 (10.1%) |
| 8:00 AM to 8:29 AM | 22 (11.6%) | 3 (2.0%) |
| 8:30 AM to 8:59 AM | 20 (10.6%) | 37 (24.8%) |
| 9:00 AM to 9:59 AM | 11 (5.8%) | 16 (10.7%) |
| 10:00 AM to 10:59 AM | 0 (0.0%) | 2 (1.3%) |
| 11:00 AM to 11:59 AM | 11 (5.8%) | 0 (0.0%) |
| 12:00 PM to 3:59 PM | 0 (0.0%) | 12 (8.1%) |
| 4:00 PM to 11:59 PM | 4 (2.1%) | 5 (3.4%) |
| Total | 189 (100.0%) | 149 (100.0%) |
Housing Occupancy in Woodway
Occupancy by Ownership in Woodway
Of the total 424 dwellings in Woodway, owner-occupied units account for 419 (98.8%), while renter-occupied units make up 5 (1.2%).
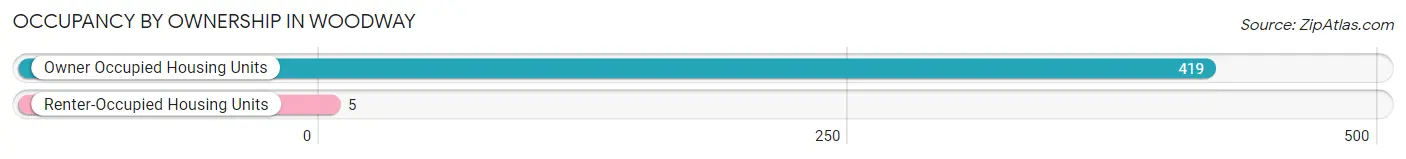
| Occupancy | # Housing Units | % Housing Units |
| Owner Occupied Housing Units | 419 | 98.8% |
| Renter-Occupied Housing Units | 5 | 1.2% |
| Total Occupied Housing Units | 424 | 100.0% |
Occupancy by Household Size in Woodway
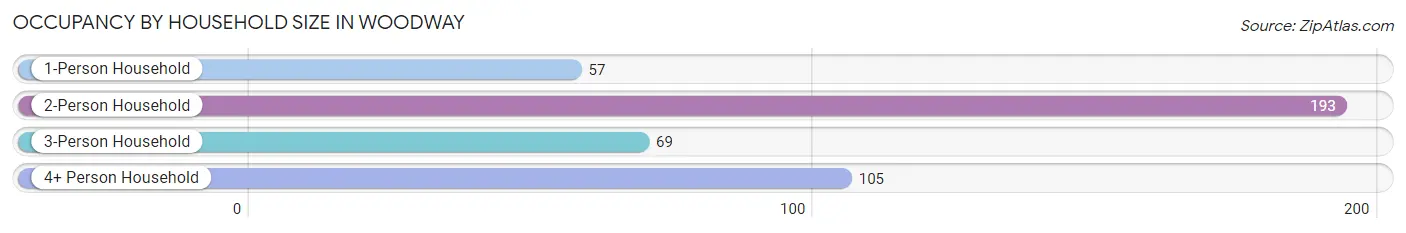
| Household Size | # Housing Units | % Housing Units |
| 1-Person Household | 57 | 13.4% |
| 2-Person Household | 193 | 45.5% |
| 3-Person Household | 69 | 16.3% |
| 4+ Person Household | 105 | 24.8% |
| Total Housing Units | 424 | 100.0% |
Occupancy by Ownership by Household Size in Woodway

| Household Size | Owner-occupied | Renter-occupied |
| 1-Person Household | 57 (100.0%) | 0 (0.0%) |
| 2-Person Household | 190 (98.5%) | 3 (1.5%) |
| 3-Person Household | 67 (97.1%) | 2 (2.9%) |
| 4+ Person Household | 105 (100.0%) | 0 (0.0%) |
| Total Housing Units | 419 (98.8%) | 5 (1.2%) |
Occupancy by Educational Attainment in Woodway
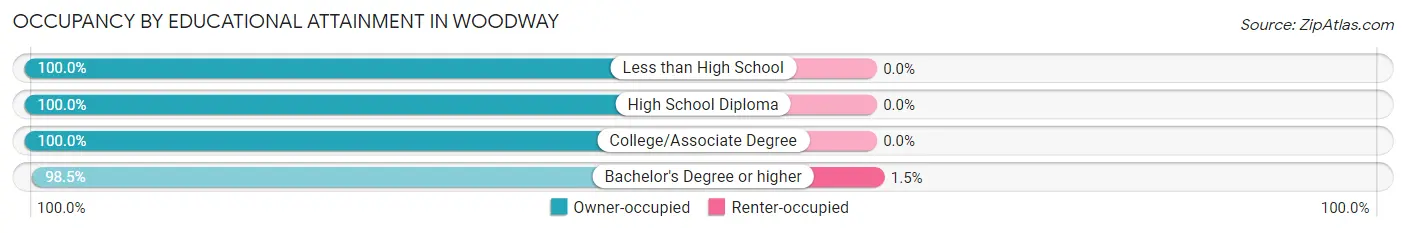
| Household Size | Owner-occupied | Renter-occupied |
| Less than High School | 2 (100.0%) | 0 (0.0%) |
| High School Diploma | 23 (100.0%) | 0 (0.0%) |
| College/Associate Degree | 71 (100.0%) | 0 (0.0%) |
| Bachelor's Degree or higher | 323 (98.5%) | 5 (1.5%) |
Occupancy by Age of Householder in Woodway
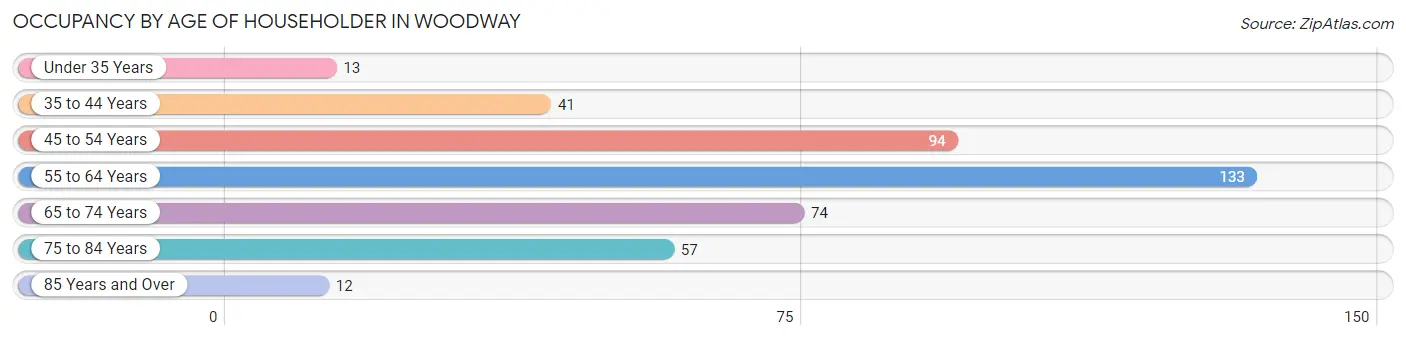
| Age Bracket | # Households | % Households |
| Under 35 Years | 13 | 3.1% |
| 35 to 44 Years | 41 | 9.7% |
| 45 to 54 Years | 94 | 22.2% |
| 55 to 64 Years | 133 | 31.4% |
| 65 to 74 Years | 74 | 17.4% |
| 75 to 84 Years | 57 | 13.4% |
| 85 Years and Over | 12 | 2.8% |
| Total | 424 | 100.0% |
Housing Finances in Woodway
Median Income by Occupancy in Woodway
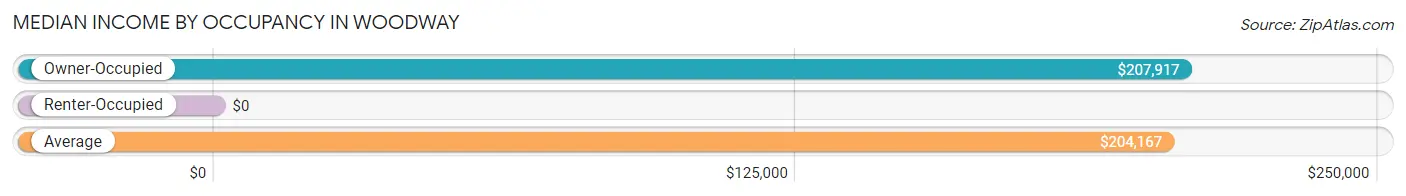
| Occupancy Type | # Households | Median Income |
| Owner-Occupied | 419 (98.8%) | $207,917 |
| Renter-Occupied | 5 (1.2%) | $0 |
| Average | 424 (100.0%) | $204,167 |
Occupancy by Householder Income Bracket in Woodway
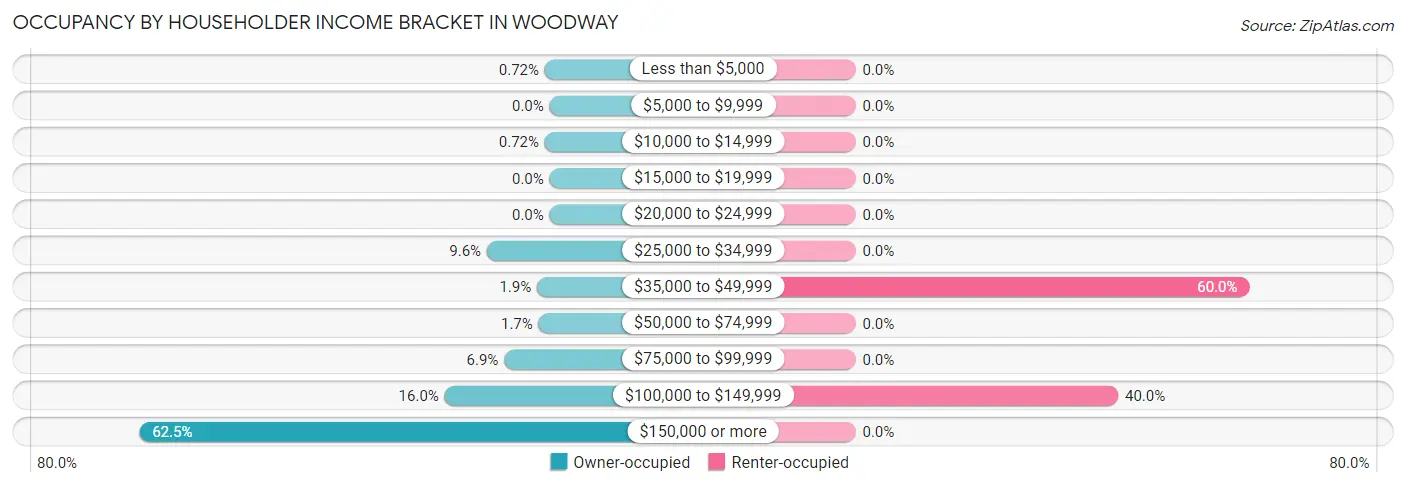
| Income Bracket | Owner-occupied | Renter-occupied |
| Less than $5,000 | 3 (0.7%) | 0 (0.0%) |
| $5,000 to $9,999 | 0 (0.0%) | 0 (0.0%) |
| $10,000 to $14,999 | 3 (0.7%) | 0 (0.0%) |
| $15,000 to $19,999 | 0 (0.0%) | 0 (0.0%) |
| $20,000 to $24,999 | 0 (0.0%) | 0 (0.0%) |
| $25,000 to $34,999 | 40 (9.6%) | 0 (0.0%) |
| $35,000 to $49,999 | 8 (1.9%) | 3 (60.0%) |
| $50,000 to $74,999 | 7 (1.7%) | 0 (0.0%) |
| $75,000 to $99,999 | 29 (6.9%) | 0 (0.0%) |
| $100,000 to $149,999 | 67 (16.0%) | 2 (40.0%) |
| $150,000 or more | 262 (62.5%) | 0 (0.0%) |
| Total | 419 (100.0%) | 5 (100.0%) |
Monthly Housing Cost Tiers in Woodway
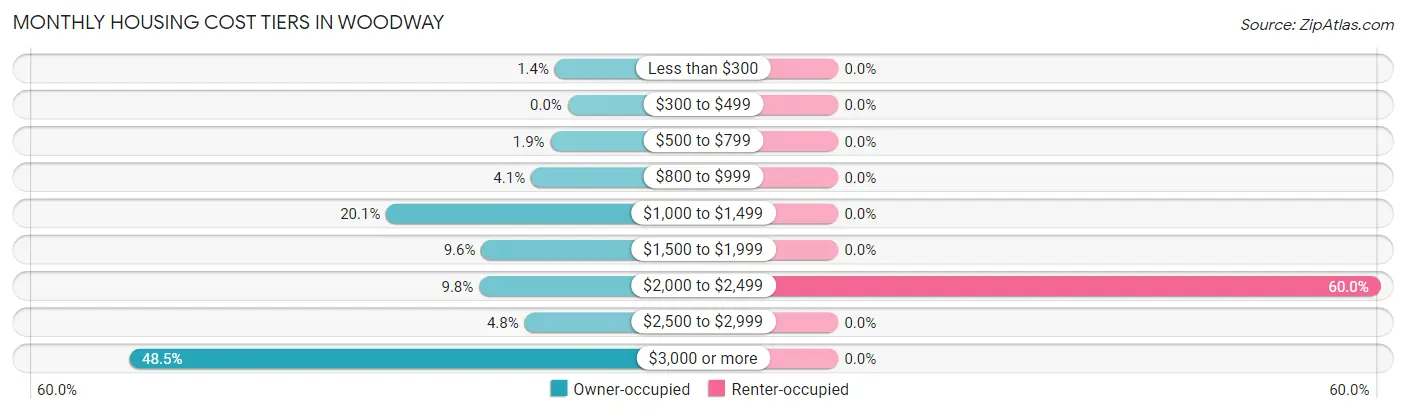
| Monthly Cost | Owner-occupied | Renter-occupied |
| Less than $300 | 6 (1.4%) | 0 (0.0%) |
| $300 to $499 | 0 (0.0%) | 0 (0.0%) |
| $500 to $799 | 8 (1.9%) | 0 (0.0%) |
| $800 to $999 | 17 (4.1%) | 0 (0.0%) |
| $1,000 to $1,499 | 84 (20.1%) | 0 (0.0%) |
| $1,500 to $1,999 | 40 (9.6%) | 0 (0.0%) |
| $2,000 to $2,499 | 41 (9.8%) | 3 (60.0%) |
| $2,500 to $2,999 | 20 (4.8%) | 0 (0.0%) |
| $3,000 or more | 203 (48.4%) | 0 (0.0%) |
| Total | 419 (100.0%) | 5 (100.0%) |
Physical Housing Characteristics in Woodway
Housing Structures in Woodway
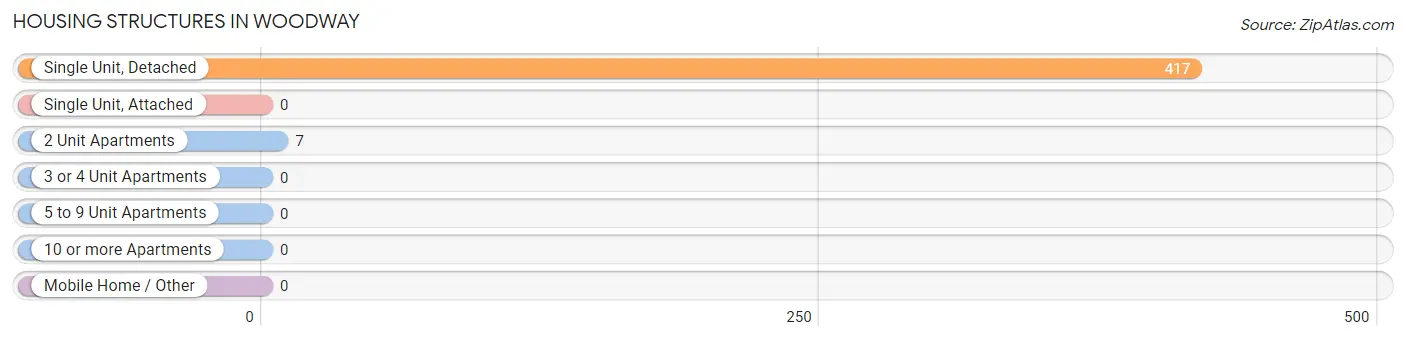
| Structure Type | # Housing Units | % Housing Units |
| Single Unit, Detached | 417 | 98.4% |
| Single Unit, Attached | 0 | 0.0% |
| 2 Unit Apartments | 7 | 1.7% |
| 3 or 4 Unit Apartments | 0 | 0.0% |
| 5 to 9 Unit Apartments | 0 | 0.0% |
| 10 or more Apartments | 0 | 0.0% |
| Mobile Home / Other | 0 | 0.0% |
| Total | 424 | 100.0% |
Housing Structures by Occupancy in Woodway
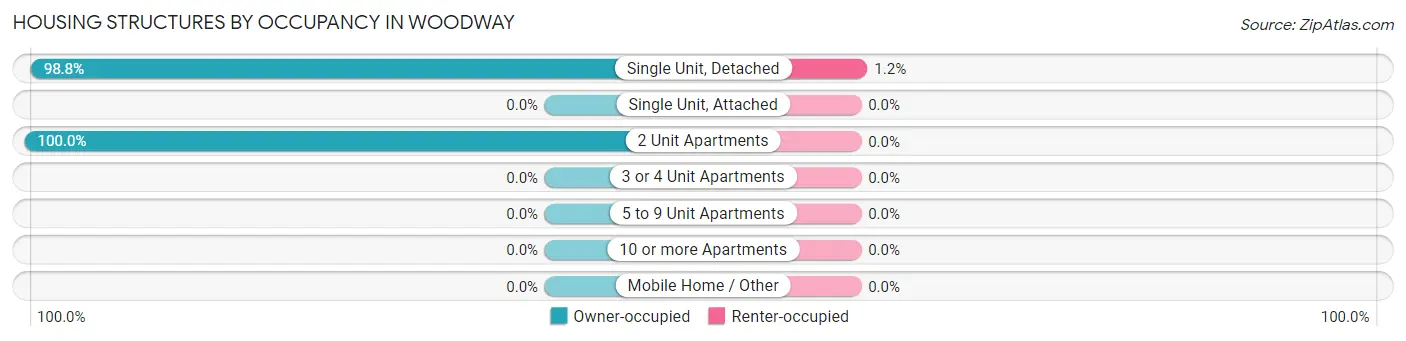
| Structure Type | Owner-occupied | Renter-occupied |
| Single Unit, Detached | 412 (98.8%) | 5 (1.2%) |
| Single Unit, Attached | 0 (0.0%) | 0 (0.0%) |
| 2 Unit Apartments | 7 (100.0%) | 0 (0.0%) |
| 3 or 4 Unit Apartments | 0 (0.0%) | 0 (0.0%) |
| 5 to 9 Unit Apartments | 0 (0.0%) | 0 (0.0%) |
| 10 or more Apartments | 0 (0.0%) | 0 (0.0%) |
| Mobile Home / Other | 0 (0.0%) | 0 (0.0%) |
| Total | 419 (98.8%) | 5 (1.2%) |
Housing Structures by Number of Rooms in Woodway
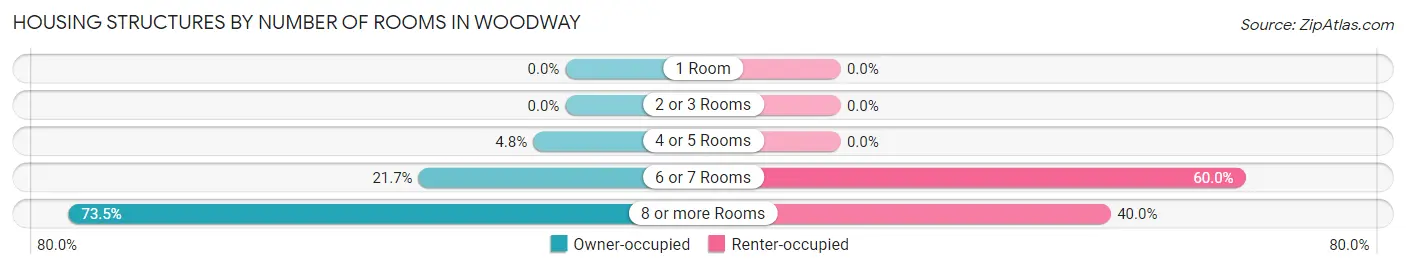
| Number of Rooms | Owner-occupied | Renter-occupied |
| 1 Room | 0 (0.0%) | 0 (0.0%) |
| 2 or 3 Rooms | 0 (0.0%) | 0 (0.0%) |
| 4 or 5 Rooms | 20 (4.8%) | 0 (0.0%) |
| 6 or 7 Rooms | 91 (21.7%) | 3 (60.0%) |
| 8 or more Rooms | 308 (73.5%) | 2 (40.0%) |
| Total | 419 (100.0%) | 5 (100.0%) |
Housing Structure by Heating Type in Woodway
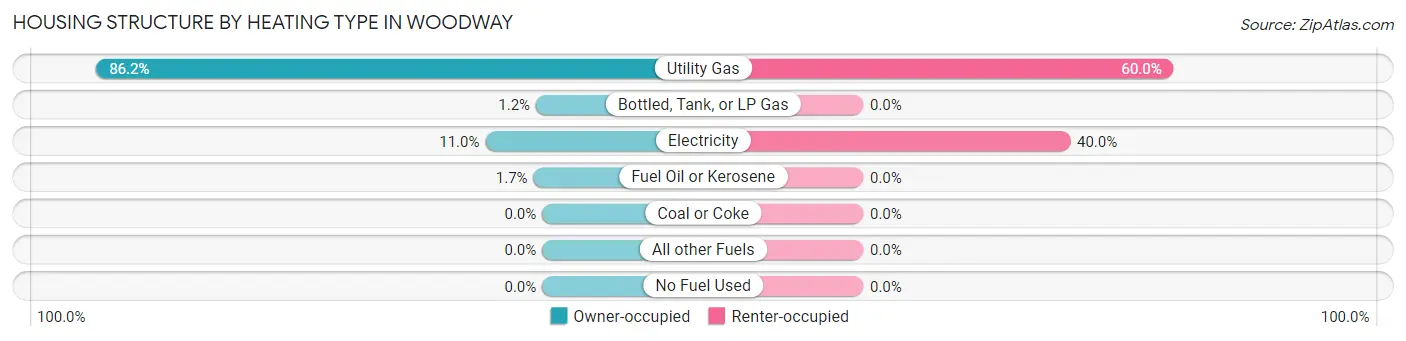
| Heating Type | Owner-occupied | Renter-occupied |
| Utility Gas | 361 (86.2%) | 3 (60.0%) |
| Bottled, Tank, or LP Gas | 5 (1.2%) | 0 (0.0%) |
| Electricity | 46 (11.0%) | 2 (40.0%) |
| Fuel Oil or Kerosene | 7 (1.7%) | 0 (0.0%) |
| Coal or Coke | 0 (0.0%) | 0 (0.0%) |
| All other Fuels | 0 (0.0%) | 0 (0.0%) |
| No Fuel Used | 0 (0.0%) | 0 (0.0%) |
| Total | 419 (100.0%) | 5 (100.0%) |
Household Vehicle Usage in Woodway
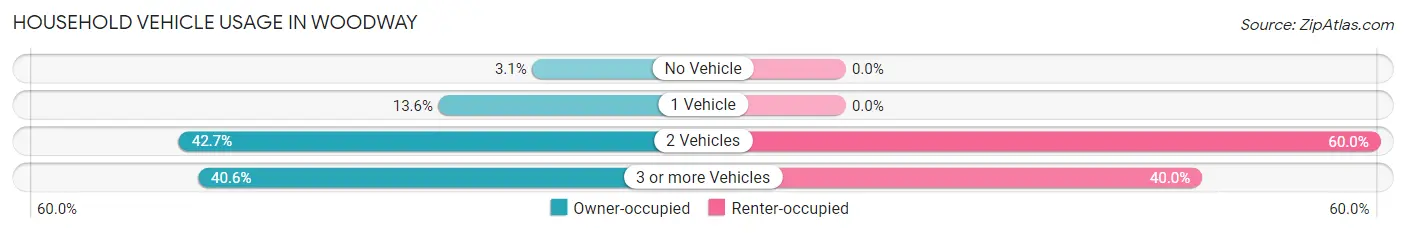
| Vehicles per Household | Owner-occupied | Renter-occupied |
| No Vehicle | 13 (3.1%) | 0 (0.0%) |
| 1 Vehicle | 57 (13.6%) | 0 (0.0%) |
| 2 Vehicles | 179 (42.7%) | 3 (60.0%) |
| 3 or more Vehicles | 170 (40.6%) | 2 (40.0%) |
| Total | 419 (100.0%) | 5 (100.0%) |
Real Estate & Mortgages in Woodway
Real Estate and Mortgage Overview in Woodway
| Characteristic | Without Mortgage | With Mortgage |
| Housing Units | 212 | 207 |
| Median Property Value | $1,427,800 | $1,733,700 |
| Median Household Income | $113,333 | $181 |
| Monthly Housing Costs | $1,471 | $182 |
| Real Estate Taxes | $10,001 | $0 |
Property Value by Mortgage Status in Woodway
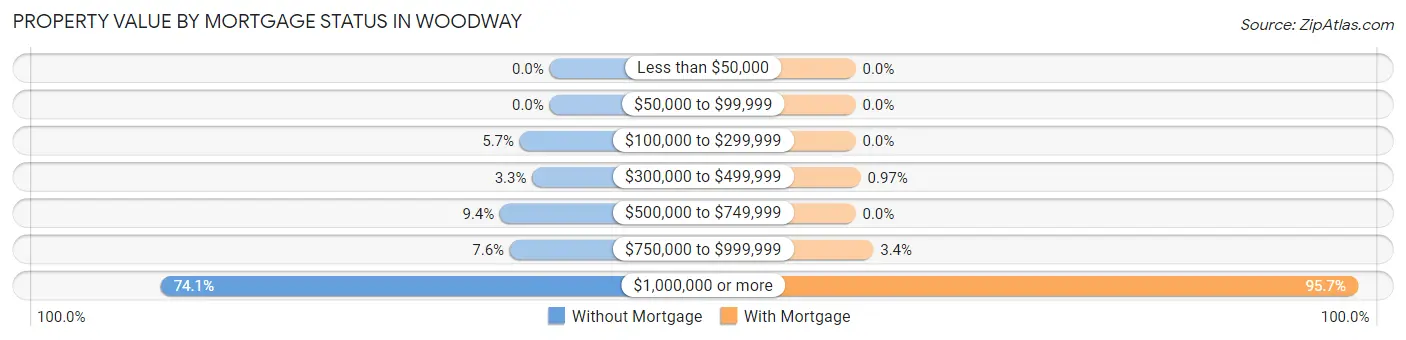
| Property Value | Without Mortgage | With Mortgage |
| Less than $50,000 | 0 (0.0%) | 0 (0.0%) |
| $50,000 to $99,999 | 0 (0.0%) | 0 (0.0%) |
| $100,000 to $299,999 | 12 (5.7%) | 0 (0.0%) |
| $300,000 to $499,999 | 7 (3.3%) | 2 (1.0%) |
| $500,000 to $749,999 | 20 (9.4%) | 0 (0.0%) |
| $750,000 to $999,999 | 16 (7.5%) | 7 (3.4%) |
| $1,000,000 or more | 157 (74.1%) | 198 (95.7%) |
| Total | 212 (100.0%) | 207 (100.0%) |
Household Income by Mortgage Status in Woodway
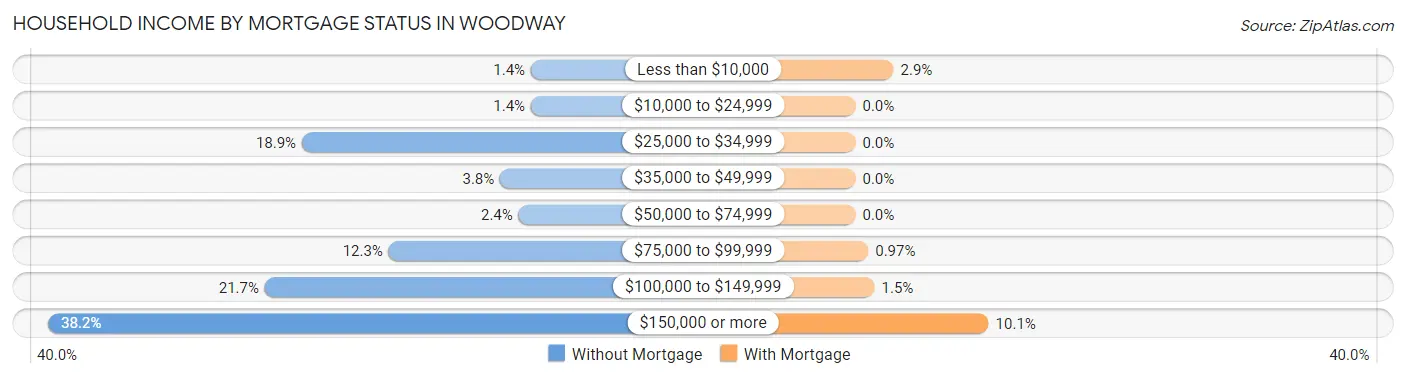
| Household Income | Without Mortgage | With Mortgage |
| Less than $10,000 | 3 (1.4%) | 6 (2.9%) |
| $10,000 to $24,999 | 3 (1.4%) | 0 (0.0%) |
| $25,000 to $34,999 | 40 (18.9%) | 0 (0.0%) |
| $35,000 to $49,999 | 8 (3.8%) | 0 (0.0%) |
| $50,000 to $74,999 | 5 (2.4%) | 0 (0.0%) |
| $75,000 to $99,999 | 26 (12.3%) | 2 (1.0%) |
| $100,000 to $149,999 | 46 (21.7%) | 3 (1.5%) |
| $150,000 or more | 81 (38.2%) | 21 (10.1%) |
| Total | 212 (100.0%) | 207 (100.0%) |
Property Value to Household Income Ratio in Woodway
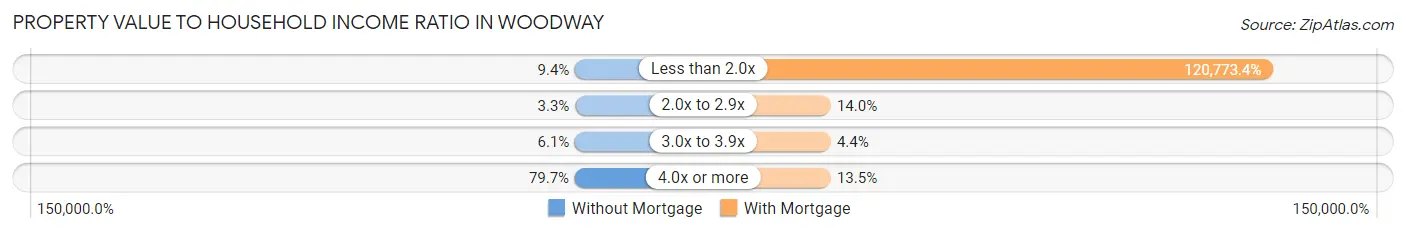
| Value-to-Income Ratio | Without Mortgage | With Mortgage |
| Less than 2.0x | 20 (9.4%) | 250,001 (120,773.4%) |
| 2.0x to 2.9x | 7 (3.3%) | 29 (14.0%) |
| 3.0x to 3.9x | 13 (6.1%) | 9 (4.3%) |
| 4.0x or more | 169 (79.7%) | 28 (13.5%) |
| Total | 212 (100.0%) | 207 (100.0%) |
Real Estate Taxes by Mortgage Status in Woodway
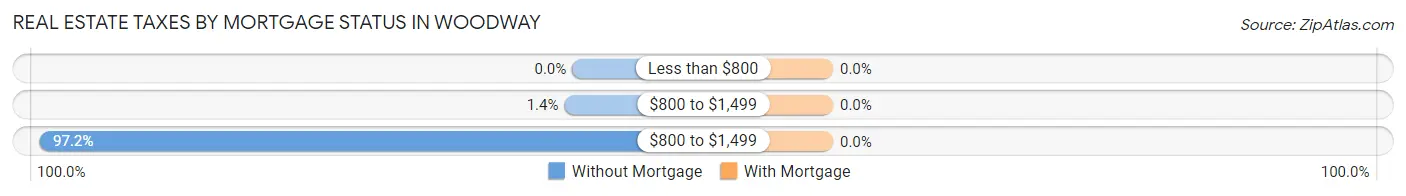
| Property Taxes | Without Mortgage | With Mortgage |
| Less than $800 | 0 (0.0%) | 0 (0.0%) |
| $800 to $1,499 | 3 (1.4%) | 0 (0.0%) |
| $800 to $1,499 | 206 (97.2%) | 0 (0.0%) |
| Total | 212 (100.0%) | 207 (100.0%) |
Health & Disability in Woodway
Health Insurance Coverage by Age in Woodway
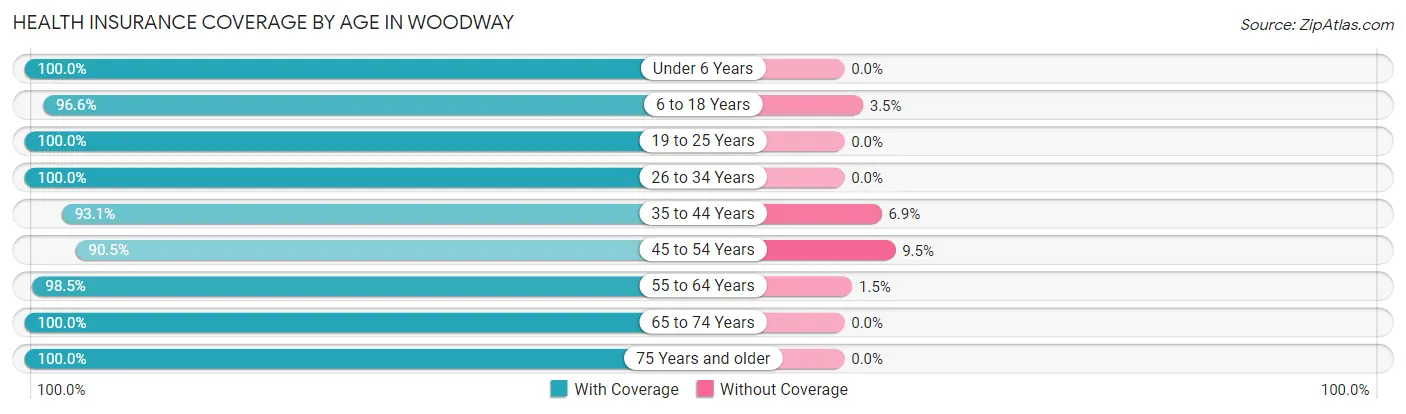
| Age Bracket | With Coverage | Without Coverage |
| Under 6 Years | 42 (100.0%) | 0 (0.0%) |
| 6 to 18 Years | 196 (96.6%) | 7 (3.5%) |
| 19 to 25 Years | 70 (100.0%) | 0 (0.0%) |
| 26 to 34 Years | 36 (100.0%) | 0 (0.0%) |
| 35 to 44 Years | 94 (93.1%) | 7 (6.9%) |
| 45 to 54 Years | 181 (90.5%) | 19 (9.5%) |
| 55 to 64 Years | 203 (98.5%) | 3 (1.5%) |
| 65 to 74 Years | 139 (100.0%) | 0 (0.0%) |
| 75 Years and older | 121 (100.0%) | 0 (0.0%) |
| Total | 1,082 (96.8%) | 36 (3.2%) |
Health Insurance Coverage by Citizenship Status in Woodway
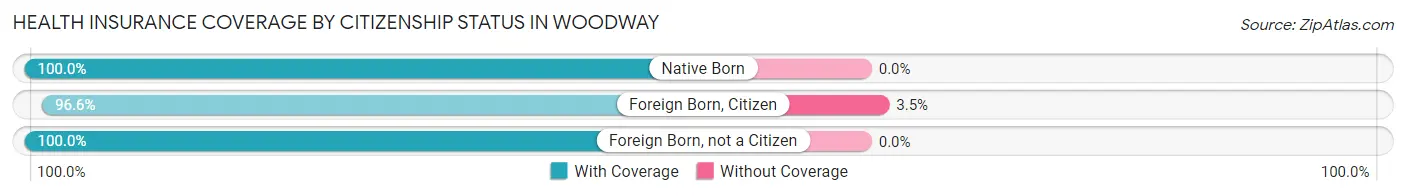
| Citizenship Status | With Coverage | Without Coverage |
| Native Born | 42 (100.0%) | 0 (0.0%) |
| Foreign Born, Citizen | 196 (96.6%) | 7 (3.5%) |
| Foreign Born, not a Citizen | 70 (100.0%) | 0 (0.0%) |
Health Insurance Coverage by Household Income in Woodway
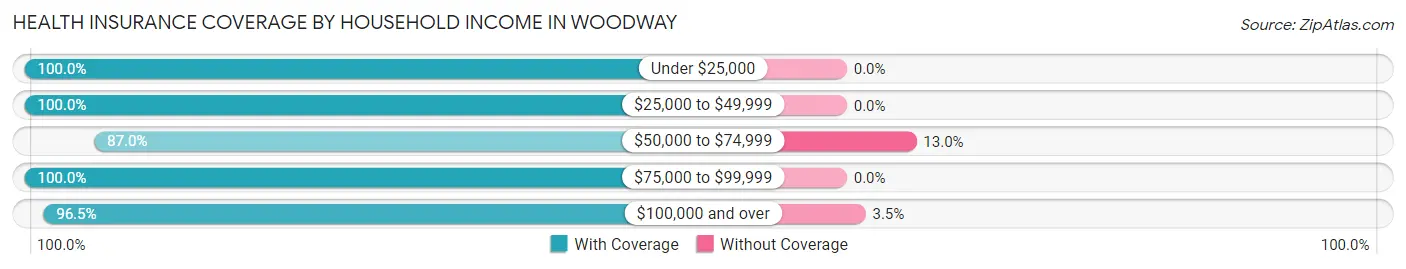
| Household Income | With Coverage | Without Coverage |
| Under $25,000 | 8 (100.0%) | 0 (0.0%) |
| $25,000 to $49,999 | 73 (100.0%) | 0 (0.0%) |
| $50,000 to $74,999 | 20 (87.0%) | 3 (13.0%) |
| $75,000 to $99,999 | 67 (100.0%) | 0 (0.0%) |
| $100,000 and over | 907 (96.5%) | 33 (3.5%) |
Public vs Private Health Insurance Coverage by Age in Woodway
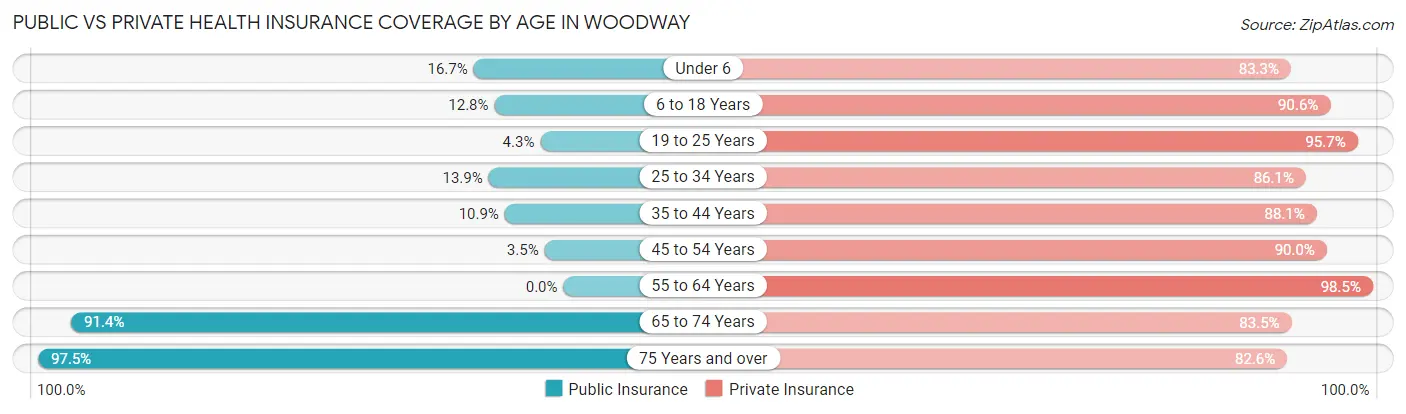
| Age Bracket | Public Insurance | Private Insurance |
| Under 6 | 7 (16.7%) | 35 (83.3%) |
| 6 to 18 Years | 26 (12.8%) | 184 (90.6%) |
| 19 to 25 Years | 3 (4.3%) | 67 (95.7%) |
| 25 to 34 Years | 5 (13.9%) | 31 (86.1%) |
| 35 to 44 Years | 11 (10.9%) | 89 (88.1%) |
| 45 to 54 Years | 7 (3.5%) | 180 (90.0%) |
| 55 to 64 Years | 0 (0.0%) | 203 (98.5%) |
| 65 to 74 Years | 127 (91.4%) | 116 (83.5%) |
| 75 Years and over | 118 (97.5%) | 100 (82.6%) |
| Total | 304 (27.2%) | 1,005 (89.9%) |
Disability Status by Sex by Age in Woodway
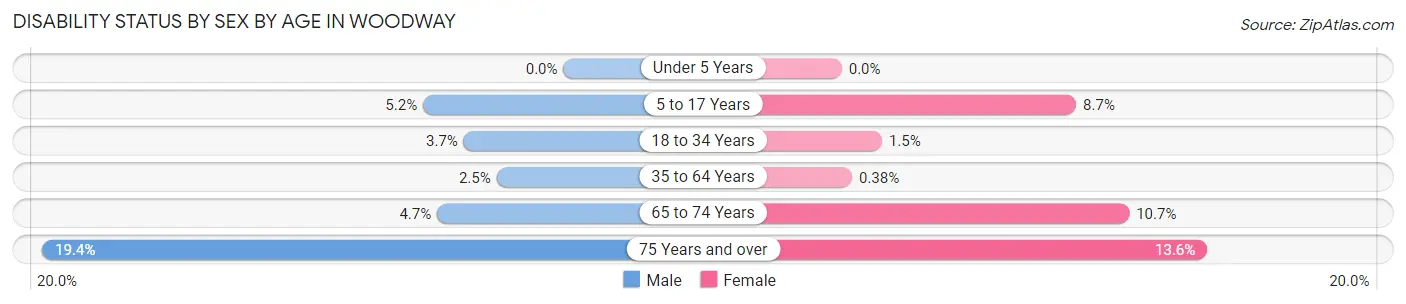
| Age Bracket | Male | Female |
| Under 5 Years | 0 (0.0%) | 0 (0.0%) |
| 5 to 17 Years | 5 (5.2%) | 8 (8.7%) |
| 18 to 34 Years | 2 (3.7%) | 1 (1.5%) |
| 35 to 64 Years | 6 (2.5%) | 1 (0.4%) |
| 65 to 74 Years | 3 (4.7%) | 8 (10.7%) |
| 75 Years and over | 12 (19.4%) | 8 (13.6%) |
Disability Class by Sex by Age in Woodway
Disability Class: Hearing Difficulty
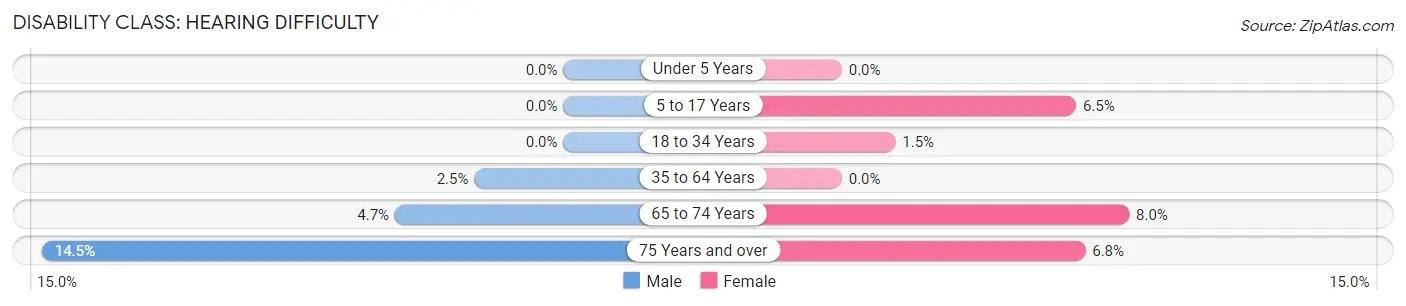
| Age Bracket | Male | Female |
| Under 5 Years | 0 (0.0%) | 0 (0.0%) |
| 5 to 17 Years | 0 (0.0%) | 6 (6.5%) |
| 18 to 34 Years | 0 (0.0%) | 1 (1.5%) |
| 35 to 64 Years | 6 (2.5%) | 0 (0.0%) |
| 65 to 74 Years | 3 (4.7%) | 6 (8.0%) |
| 75 Years and over | 9 (14.5%) | 4 (6.8%) |
Disability Class: Vision Difficulty
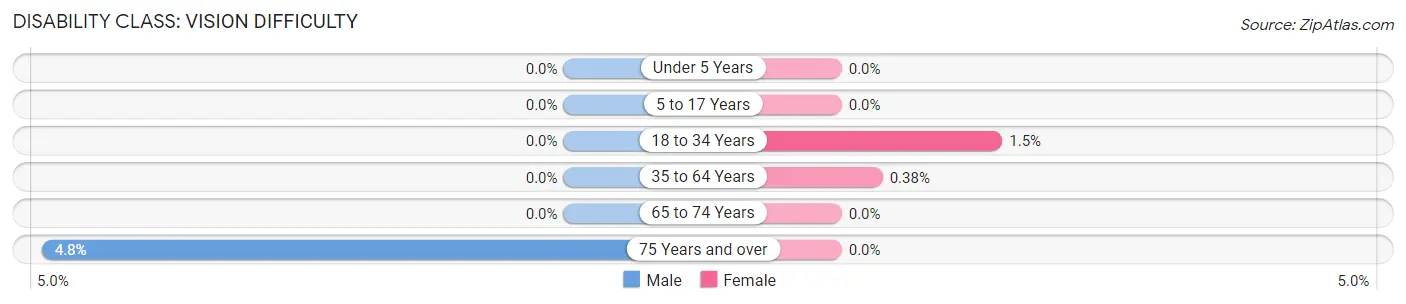
| Age Bracket | Male | Female |
| Under 5 Years | 0 (0.0%) | 0 (0.0%) |
| 5 to 17 Years | 0 (0.0%) | 0 (0.0%) |
| 18 to 34 Years | 0 (0.0%) | 1 (1.5%) |
| 35 to 64 Years | 0 (0.0%) | 1 (0.4%) |
| 65 to 74 Years | 0 (0.0%) | 0 (0.0%) |
| 75 Years and over | 3 (4.8%) | 0 (0.0%) |
Disability Class: Cognitive Difficulty
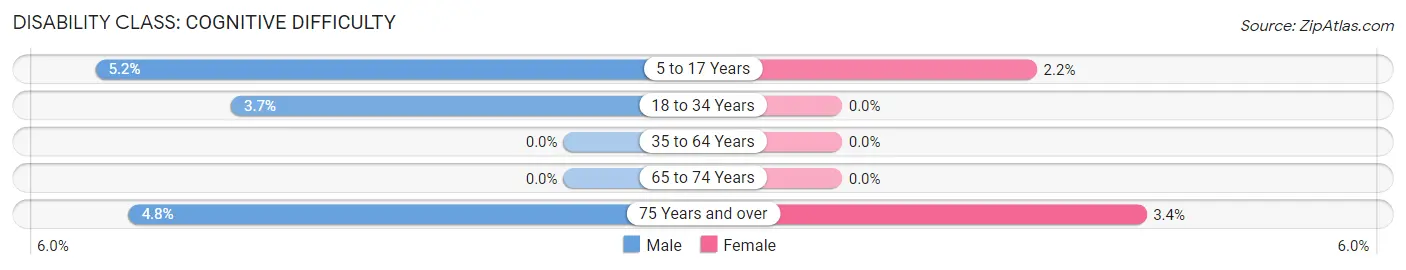
| Age Bracket | Male | Female |
| 5 to 17 Years | 5 (5.2%) | 2 (2.2%) |
| 18 to 34 Years | 2 (3.7%) | 0 (0.0%) |
| 35 to 64 Years | 0 (0.0%) | 0 (0.0%) |
| 65 to 74 Years | 0 (0.0%) | 0 (0.0%) |
| 75 Years and over | 3 (4.8%) | 2 (3.4%) |
Disability Class: Ambulatory Difficulty
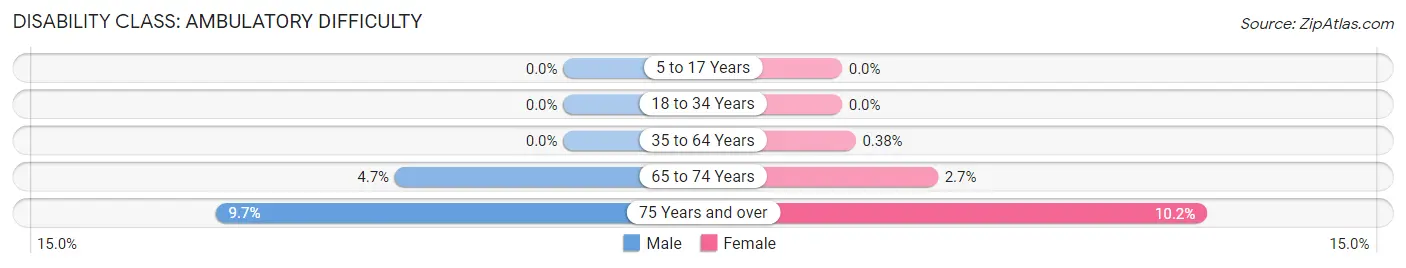
| Age Bracket | Male | Female |
| 5 to 17 Years | 0 (0.0%) | 0 (0.0%) |
| 18 to 34 Years | 0 (0.0%) | 0 (0.0%) |
| 35 to 64 Years | 0 (0.0%) | 1 (0.4%) |
| 65 to 74 Years | 3 (4.7%) | 2 (2.7%) |
| 75 Years and over | 6 (9.7%) | 6 (10.2%) |
Disability Class: Self-Care Difficulty
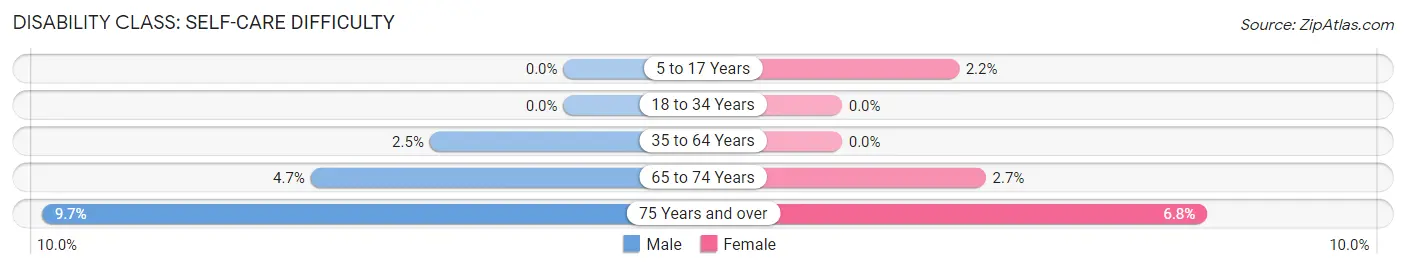
| Age Bracket | Male | Female |
| 5 to 17 Years | 0 (0.0%) | 2 (2.2%) |
| 18 to 34 Years | 0 (0.0%) | 0 (0.0%) |
| 35 to 64 Years | 6 (2.5%) | 0 (0.0%) |
| 65 to 74 Years | 3 (4.7%) | 2 (2.7%) |
| 75 Years and over | 6 (9.7%) | 4 (6.8%) |
Technology Access in Woodway
Computing Device Access in Woodway
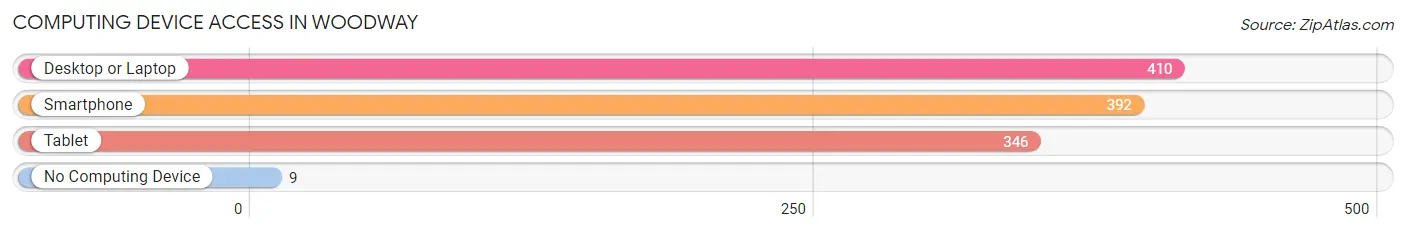
| Device Type | # Households | % Households |
| Desktop or Laptop | 410 | 96.7% |
| Smartphone | 392 | 92.4% |
| Tablet | 346 | 81.6% |
| No Computing Device | 9 | 2.1% |
| Total | 424 | 100.0% |
Internet Access in Woodway
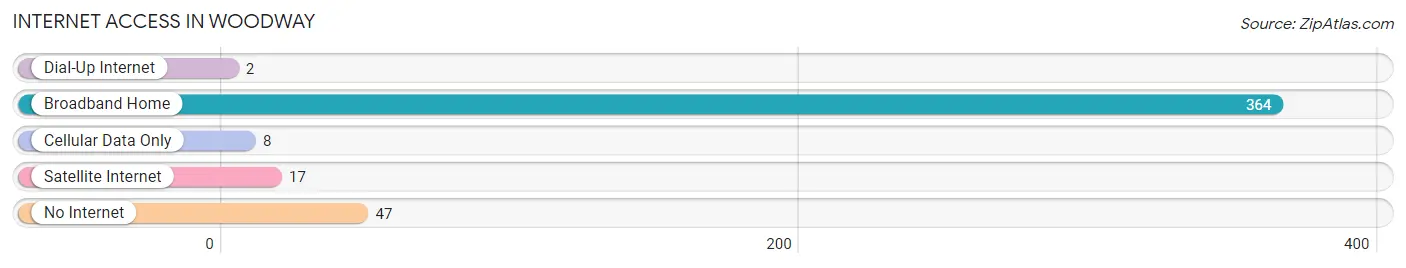
| Internet Type | # Households | % Households |
| Dial-Up Internet | 2 | 0.5% |
| Broadband Home | 364 | 85.9% |
| Cellular Data Only | 8 | 1.9% |
| Satellite Internet | 17 | 4.0% |
| No Internet | 47 | 11.1% |
| Total | 424 | 100.0% |
Woodway Summary
Woodway, Washington is a small town located in Snohomish County, Washington, United States. It is situated on the Puget Sound, approximately 20 miles north of Seattle. The town has a population of approximately 2,000 people and is known for its rural atmosphere and small-town charm.
History
Woodway was first settled in the late 1800s by a group of Swedish immigrants. The town was originally called “Woodville” and was later changed to “Woodway” in the early 1900s. The town was officially incorporated in 1909.
In the early 1900s, Woodway was a small farming community. The town was home to a number of small businesses, including a general store, a blacksmith shop, and a sawmill. The town also had a post office, a school, and a church.
In the 1950s, Woodway began to experience a period of growth and development. The town was home to a number of new businesses, including a grocery store, a hardware store, and a gas station. The town also had a library, a fire station, and a police station.
In the late 1960s, Woodway experienced a period of decline. Many of the businesses in the town closed and the population began to decline. In the 1970s, the town began to experience a period of revitalization. The town was home to a number of new businesses, including a restaurant, a bakery, and a movie theater.
Geography
Woodway is located in Snohomish County, Washington, United States. The town is situated on the Puget Sound, approximately 20 miles north of Seattle. The town is bordered by the cities of Edmonds to the south, Lynnwood to the east, and Shoreline to the north.
The town has a total area of 1.2 square miles, all of which is land. The town is located at an elevation of approximately 100 feet above sea level. The town is located in a temperate climate, with mild winters and warm summers.
Economy
Woodway’s economy is largely based on the service industry. The town is home to a number of small businesses, including restaurants, retail stores, and professional services. The town is also home to a number of small manufacturing businesses.
The town is also home to a number of large employers, including Boeing, Microsoft, and Amazon. These companies employ a large number of people in the area.
Demographics
As of the 2010 census, the population of Woodway was 2,000 people. The town has a population density of 1,664 people per square mile. The median age of the population is 44.7 years.
The racial makeup of the town is 87.2% White, 5.2% Asian, 2.2% African American, 0.2% Native American, 0.2% Pacific Islander, and 4.2% from other races. The town has a median household income of $76,944.
Conclusion
Woodway, Washington is a small town located in Snohomish County, Washington, United States. It is situated on the Puget Sound, approximately 20 miles north of Seattle. The town has a population of approximately 2,000 people and is known for its rural atmosphere and small-town charm. The town’s economy is largely based on the service industry, and it is home to a number of large employers, including Boeing, Microsoft, and Amazon. The town has a population density of 1,664 people per square mile and a median household income of $76,944.
Common Questions
What is Per Capita Income in Woodway?
Per Capita income in Woodway is $131,771.
What is the Median Family Income in Woodway?
Median Family Income in Woodway is $214,632.
What is the Median Household income in Woodway?
Median Household Income in Woodway is $204,167.
What is Income or Wage Gap in Woodway?
Income or Wage Gap in Woodway is 61.7%.
Women in Woodway earn 38.3 cents for every dollar earned by a man.
What is Inequality or Gini Index in Woodway?
Inequality or Gini Index in Woodway is 0.55.
What is the Total Population of Woodway?
Total Population of Woodway is 1,118.
What is the Total Male Population of Woodway?
Total Male Population of Woodway is 541.
What is the Total Female Population of Woodway?
Total Female Population of Woodway is 577.
What is the Ratio of Males per 100 Females in Woodway?
There are 93.76 Males per 100 Females in Woodway.
What is the Ratio of Females per 100 Males in Woodway?
There are 106.65 Females per 100 Males in Woodway.
What is the Median Population Age in Woodway?
Median Population Age in Woodway is 50.8 Years.
What is the Average Family Size in Woodway
Average Family Size in Woodway is 2.8 People.
What is the Average Household Size in Woodway
Average Household Size in Woodway is 2.6 People.
How Large is the Labor Force in Woodway?
There are 507 People in the Labor Forcein in Woodway.
What is the Percentage of People in the Labor Force in Woodway?
54.8% of People are in the Labor Force in Woodway.
What is the Unemployment Rate in Woodway?
Unemployment Rate in Woodway is 1.2%.