Zip Codes with the Highest Percentage of Households with Income Above $200,000 in Kennewick, WA
RELATED REPORTS & OPTIONS
Household Income | $200k+
Kennewick
Compare Zip Codes
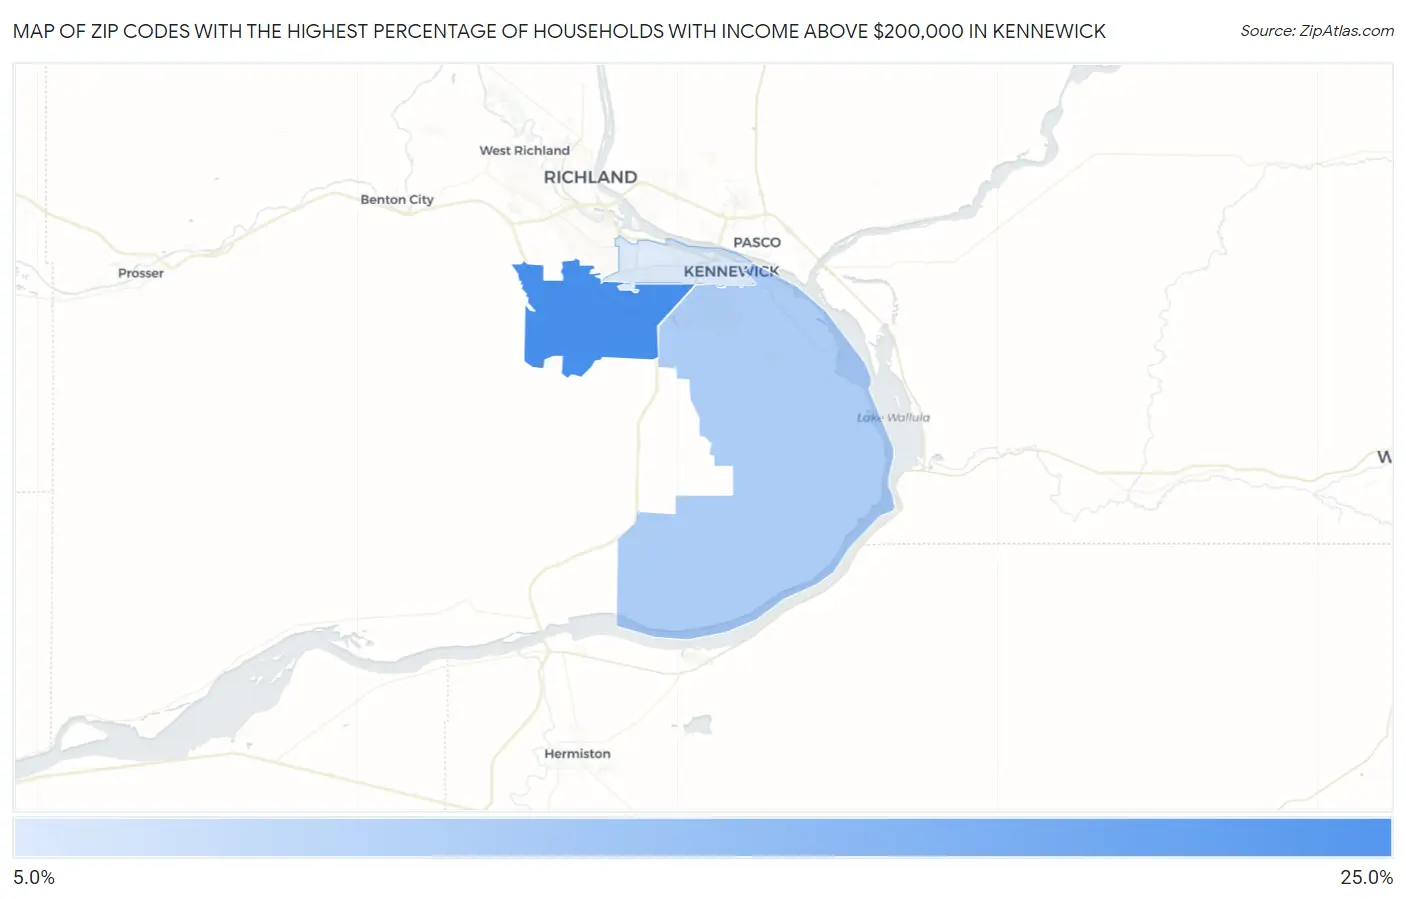
Map of Zip Codes with the Highest Percentage of Households with Income Above $200,000 in Kennewick
5.4%
24.9%
Zip Codes with the Highest Percentage of Households with Income Above $200,000 in Kennewick, WA
| Zip Code | Households with Income > $200k | vs State | vs National | |
| 1. | 99338 | 24.9% | 15.4%(+9.50)#60 | 11.4%(+13.5)#2,211 |
| 2. | 99337 | 11.2% | 15.4%(-4.20)#190 | 11.4%(-0.200)#7,226 |
| 3. | 99336 | 5.4% | 15.4%(-10.00)#363 | 11.4%(-6.00)#14,653 |
1
Common Questions
What are the Top Zip Codes with the Highest Percentage of Households with Income Above $200,000 in Kennewick, WA?
Top Zip Codes with the Highest Percentage of Households with Income Above $200,000 in Kennewick, WA are:
What zip code has the Highest Percentage of Households with Income Above $200,000 in Kennewick, WA?
99338 has the Highest Percentage of Households with Income Above $200,000 in Kennewick, WA with 24.9%.
What is the Percentage of Households with Income Above $200,000 in Kennewick, WA?
Percentage of Households with Income Above $200,000 in Kennewick is 8.6%.
What is the Percentage of Households with Income Above $200,000 in Washington?
Percentage of Households with Income Above $200,000 in Washington is 15.4%.
What is the Percentage of Households with Income Above $200,000 in the United States?
Percentage of Households with Income Above $200,000 in the United States is 11.4%.