Zip Codes with the Highest Percentage of Households with Income Above $200,000 in Washington
RELATED REPORTS & OPTIONS
Household Income | $200k+
Washington
Compare Zip Codes
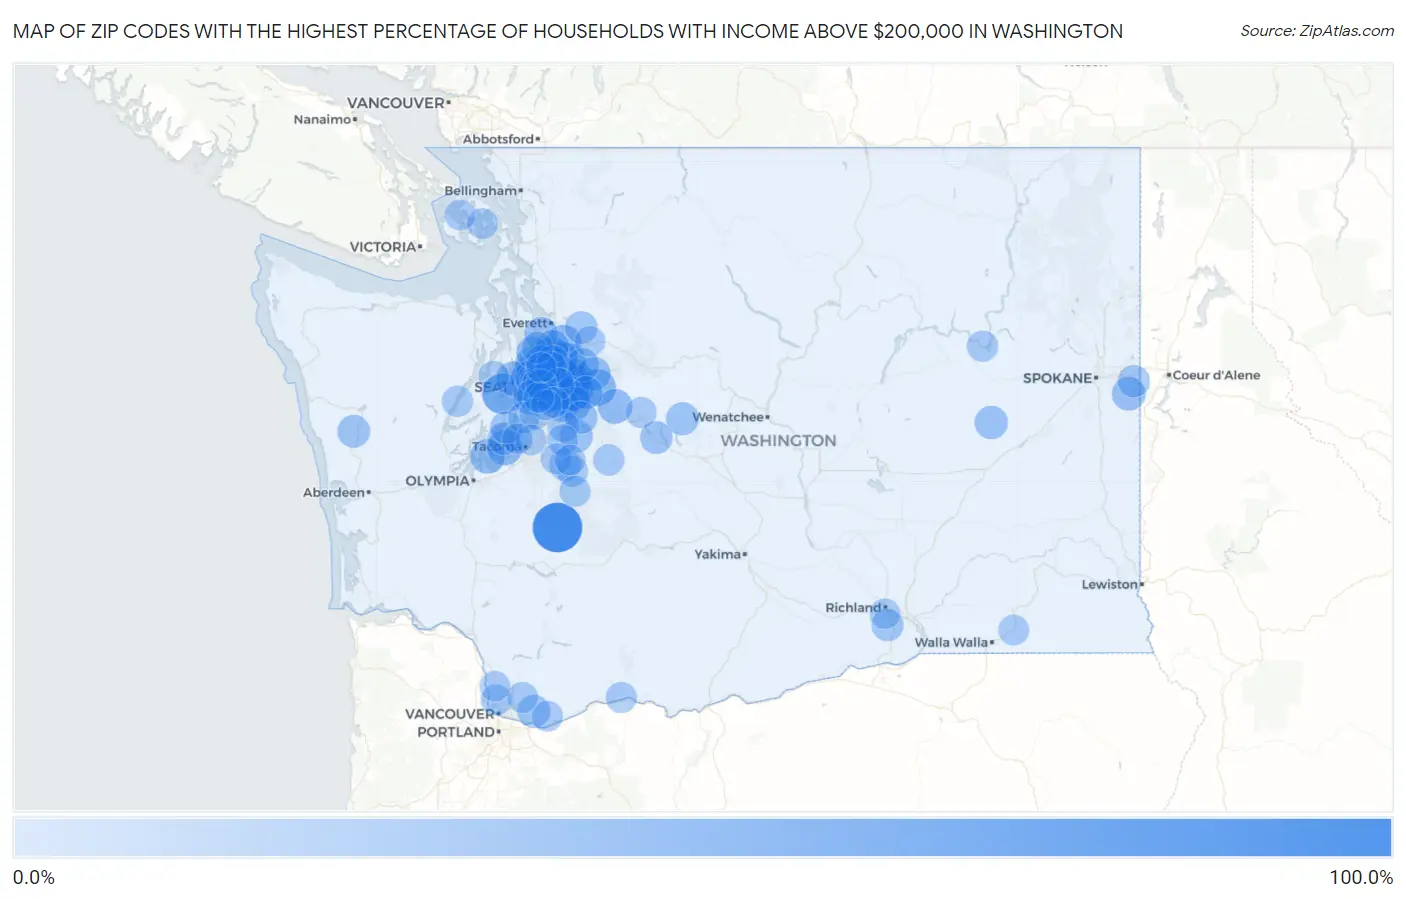
Map of Zip Codes with the Highest Percentage of Households with Income Above $200,000 in Washington
0.0%
100.0%
Zip Codes with the Highest Percentage of Households with Income Above $200,000 in Washington
| Zip Code | Households with Income > $200k | vs State | vs National | |
| 1. | 98330 | 100.0% | 15.4%(+84.6)#1 | 11.4%(+88.6)#20 |
| 2. | 98314 | 61.3% | 15.4%(+45.9)#2 | 11.4%(+49.9)#103 |
| 3. | 98164 | 60.4% | 15.4%(+45.0)#3 | 11.4%(+49.0)#114 |
| 4. | 98075 | 60.0% | 15.4%(+44.6)#4 | 11.4%(+48.6)#116 |
| 5. | 98039 | 57.9% | 15.4%(+42.5)#5 | 11.4%(+46.5)#133 |
| 6. | 98074 | 56.0% | 15.4%(+40.6)#6 | 11.4%(+44.6)#159 |
| 7. | 98040 | 48.3% | 15.4%(+32.9)#7 | 11.4%(+36.9)#319 |
| 8. | 98006 | 45.4% | 15.4%(+30.0)#8 | 11.4%(+34.0)#410 |
| 9. | 98053 | 44.5% | 15.4%(+29.1)#9 | 11.4%(+33.1)#444 |
| 10. | 98065 | 44.4% | 15.4%(+29.0)#10 | 11.4%(+33.0)#448 |
| 11. | 98077 | 42.9% | 15.4%(+27.5)#11 | 11.4%(+31.5)#508 |
| 12. | 98033 | 41.9% | 15.4%(+26.5)#12 | 11.4%(+30.5)#553 |
| 13. | 98117 | 41.3% | 15.4%(+25.9)#13 | 11.4%(+29.9)#581 |
| 14. | 98199 | 40.8% | 15.4%(+25.4)#14 | 11.4%(+29.4)#611 |
| 15. | 98112 | 40.2% | 15.4%(+24.8)#15 | 11.4%(+28.8)#639 |
| 16. | 98004 | 39.5% | 15.4%(+24.1)#16 | 11.4%(+28.1)#674 |
| 17. | 98008 | 39.3% | 15.4%(+23.9)#17 | 11.4%(+27.9)#683 |
| 18. | 98072 | 39.3% | 15.4%(+23.9)#18 | 11.4%(+27.9)#684 |
| 19. | 98333 | 39.0% | 15.4%(+23.6)#19 | 11.4%(+27.6)#711 |
| 20. | 98296 | 38.8% | 15.4%(+23.4)#20 | 11.4%(+27.4)#721 |
| 21. | 98052 | 36.8% | 15.4%(+21.4)#21 | 11.4%(+25.4)#847 |
| 22. | 98029 | 36.4% | 15.4%(+21.0)#22 | 11.4%(+25.0)#880 |
| 23. | 98110 | 36.2% | 15.4%(+20.8)#23 | 11.4%(+24.8)#893 |
| 24. | 98045 | 36.1% | 15.4%(+20.7)#24 | 11.4%(+24.7)#900 |
| 25. | 98021 | 36.0% | 15.4%(+20.6)#25 | 11.4%(+24.6)#903 |
| 26. | 98351 | 35.7% | 15.4%(+20.3)#26 | 11.4%(+24.3)#925 |
| 27. | 98115 | 35.4% | 15.4%(+20.0)#27 | 11.4%(+24.0)#947 |
| 28. | 98177 | 35.2% | 15.4%(+19.8)#28 | 11.4%(+23.8)#964 |
| 29. | 98005 | 35.1% | 15.4%(+19.7)#29 | 11.4%(+23.7)#970 |
| 30. | 98121 | 35.0% | 15.4%(+19.6)#30 | 11.4%(+23.6)#978 |
| 31. | 98027 | 33.6% | 15.4%(+18.2)#31 | 11.4%(+22.2)#1,102 |
| 32. | 98028 | 33.2% | 15.4%(+17.8)#32 | 11.4%(+21.8)#1,141 |
| 33. | 98014 | 32.6% | 15.4%(+17.2)#33 | 11.4%(+21.2)#1,193 |
| 34. | 98136 | 32.5% | 15.4%(+17.1)#34 | 11.4%(+21.1)#1,209 |
| 35. | 98059 | 31.7% | 15.4%(+16.3)#35 | 11.4%(+20.3)#1,267 |
| 36. | 99023 | 31.7% | 15.4%(+16.3)#36 | 11.4%(+20.3)#1,280 |
| 37. | 98275 | 30.1% | 15.4%(+14.7)#37 | 11.4%(+18.7)#1,443 |
| 38. | 99154 | 30.0% | 15.4%(+14.6)#38 | 11.4%(+18.6)#1,460 |
| 39. | 98019 | 29.6% | 15.4%(+14.2)#39 | 11.4%(+18.2)#1,509 |
| 40. | 98010 | 29.5% | 15.4%(+14.1)#40 | 11.4%(+18.1)#1,520 |
| 41. | 98116 | 29.4% | 15.4%(+14.0)#41 | 11.4%(+18.0)#1,531 |
| 42. | 98012 | 28.9% | 15.4%(+13.5)#42 | 11.4%(+17.5)#1,584 |
| 43. | 98103 | 28.4% | 15.4%(+13.0)#43 | 11.4%(+17.0)#1,660 |
| 44. | 98119 | 28.4% | 15.4%(+13.0)#44 | 11.4%(+17.0)#1,666 |
| 45. | 98024 | 28.2% | 15.4%(+12.8)#45 | 11.4%(+16.8)#1,692 |
| 46. | 98940 | 28.2% | 15.4%(+12.8)#46 | 11.4%(+16.8)#1,695 |
| 47. | 98107 | 28.1% | 15.4%(+12.7)#47 | 11.4%(+16.7)#1,704 |
| 48. | 98925 | 27.6% | 15.4%(+12.2)#48 | 11.4%(+16.2)#1,790 |
| 49. | 98607 | 27.5% | 15.4%(+12.1)#49 | 11.4%(+16.1)#1,794 |
| 50. | 98109 | 27.5% | 15.4%(+12.1)#50 | 11.4%(+16.1)#1,795 |
| 51. | 98552 | 27.4% | 15.4%(+12.0)#51 | 11.4%(+16.0)#1,822 |
| 52. | 98105 | 26.9% | 15.4%(+11.5)#52 | 11.4%(+15.5)#1,891 |
| 53. | 98038 | 26.6% | 15.4%(+11.2)#53 | 11.4%(+15.2)#1,930 |
| 54. | 98335 | 26.3% | 15.4%(+10.9)#54 | 11.4%(+14.9)#1,976 |
| 55. | 98020 | 26.3% | 15.4%(+10.9)#55 | 11.4%(+14.9)#1,979 |
| 56. | 98290 | 26.2% | 15.4%(+10.8)#56 | 11.4%(+14.8)#1,996 |
| 57. | 98102 | 25.6% | 15.4%(+10.2)#57 | 11.4%(+14.2)#2,082 |
| 58. | 99019 | 25.3% | 15.4%(+9.90)#58 | 11.4%(+13.9)#2,134 |
| 59. | 98332 | 25.2% | 15.4%(+9.80)#59 | 11.4%(+13.8)#2,150 |
| 60. | 99338 | 24.9% | 15.4%(+9.50)#60 | 11.4%(+13.5)#2,211 |
| 61. | 98155 | 24.2% | 15.4%(+8.80)#61 | 11.4%(+12.8)#2,330 |
| 62. | 98144 | 24.2% | 15.4%(+8.80)#62 | 11.4%(+12.8)#2,331 |
| 63. | 98101 | 24.2% | 15.4%(+8.80)#63 | 11.4%(+12.8)#2,335 |
| 64. | 98011 | 24.1% | 15.4%(+8.70)#64 | 11.4%(+12.7)#2,348 |
| 65. | 98034 | 23.7% | 15.4%(+8.30)#65 | 11.4%(+12.3)#2,422 |
| 66. | 98385 | 23.5% | 15.4%(+8.10)#66 | 11.4%(+12.1)#2,474 |
| 67. | 98007 | 22.9% | 15.4%(+7.50)#67 | 11.4%(+11.5)#2,573 |
| 68. | 98126 | 22.8% | 15.4%(+7.40)#68 | 11.4%(+11.4)#2,604 |
| 69. | 98118 | 22.5% | 15.4%(+7.10)#69 | 11.4%(+11.1)#2,674 |
| 70. | 98042 | 22.0% | 15.4%(+6.60)#70 | 11.4%(+10.6)#2,767 |
| 71. | 98026 | 22.0% | 15.4%(+6.60)#71 | 11.4%(+10.6)#2,770 |
| 72. | 98122 | 21.7% | 15.4%(+6.30)#72 | 11.4%(+10.3)#2,841 |
| 73. | 98070 | 21.3% | 15.4%(+5.90)#73 | 11.4%(+9.90)#2,941 |
| 74. | 98022 | 21.2% | 15.4%(+5.80)#74 | 11.4%(+9.80)#2,964 |
| 75. | 98166 | 21.1% | 15.4%(+5.70)#75 | 11.4%(+9.70)#2,999 |
| 76. | 98555 | 21.1% | 15.4%(+5.70)#76 | 11.4%(+9.70)#3,014 |
| 77. | 99147 | 21.0% | 15.4%(+5.60)#77 | 11.4%(+9.60)#3,044 |
| 78. | 98396 | 20.3% | 15.4%(+4.90)#78 | 11.4%(+8.90)#3,221 |
| 79. | 98685 | 20.2% | 15.4%(+4.80)#79 | 11.4%(+8.80)#3,231 |
| 80. | 98056 | 20.1% | 15.4%(+4.70)#80 | 11.4%(+8.70)#3,252 |
| 81. | 98323 | 20.1% | 15.4%(+4.70)#81 | 11.4%(+8.70)#3,269 |
| 82. | 98606 | 20.0% | 15.4%(+4.60)#82 | 11.4%(+8.60)#3,286 |
| 83. | 98651 | 19.9% | 15.4%(+4.50)#83 | 11.4%(+8.50)#3,337 |
| 84. | 98092 | 19.6% | 15.4%(+4.20)#84 | 11.4%(+8.20)#3,387 |
| 85. | 98391 | 19.5% | 15.4%(+4.10)#85 | 11.4%(+8.10)#3,419 |
| 86. | 98068 | 19.5% | 15.4%(+4.10)#86 | 11.4%(+8.10)#3,452 |
| 87. | 98222 | 18.8% | 15.4%(+3.40)#87 | 11.4%(+7.40)#3,639 |
| 88. | 98671 | 18.7% | 15.4%(+3.30)#88 | 11.4%(+7.30)#3,649 |
| 89. | 98422 | 18.7% | 15.4%(+3.30)#89 | 11.4%(+7.30)#3,650 |
| 90. | 98243 | 18.6% | 15.4%(+3.20)#90 | 11.4%(+7.20)#3,689 |
| 91. | 99329 | 18.5% | 15.4%(+3.10)#91 | 11.4%(+7.10)#3,717 |
| 92. | 98272 | 18.4% | 15.4%(+3.00)#92 | 11.4%(+7.00)#3,725 |
| 93. | 98321 | 18.3% | 15.4%(+2.90)#93 | 11.4%(+6.90)#3,754 |
| 94. | 98178 | 18.1% | 15.4%(+2.70)#94 | 11.4%(+6.70)#3,814 |
| 95. | 98642 | 18.1% | 15.4%(+2.70)#95 | 11.4%(+6.70)#3,815 |
| 96. | 98407 | 18.1% | 15.4%(+2.70)#96 | 11.4%(+6.70)#3,819 |
| 97. | 98125 | 17.9% | 15.4%(+2.50)#97 | 11.4%(+6.50)#3,871 |
| 98. | 98383 | 17.5% | 15.4%(+2.10)#98 | 11.4%(+6.10)#4,014 |
| 99. | 98108 | 17.4% | 15.4%(+2.00)#99 | 11.4%(+6.00)#4,040 |
| 100. | 99352 | 17.1% | 15.4%(+1.70)#100 | 11.4%(+5.70)#4,142 |
Common Questions
What are the Top 10 Zip Codes with the Highest Percentage of Households with Income Above $200,000 in Washington?
Top 10 Zip Codes with the Highest Percentage of Households with Income Above $200,000 in Washington are:
What zip code has the Highest Percentage of Households with Income Above $200,000 in Washington?
98330 has the Highest Percentage of Households with Income Above $200,000 in Washington with 100.0%.
What is the Percentage of Households with Income Above $200,000 in the State of Washington?
Percentage of Households with Income Above $200,000 in Washington is 15.4%.
What is the Percentage of Households with Income Above $200,000 in the United States?
Percentage of Households with Income Above $200,000 in the United States is 11.4%.