Browns Point, WA Map & Demographics
Browns Point Map
Browns Point Overview
$64,340
PER CAPITA INCOME
$117,813
AVG FAMILY INCOME
$97,917
AVG HOUSEHOLD INCOME
50.4%
WAGE / INCOME GAP [ % ]
49.6¢/ $1
WAGE / INCOME GAP [ $ ]
0.47
INEQUALITY / GINI INDEX
1,097
TOTAL POPULATION
561
MALE POPULATION
536
FEMALE POPULATION
104.66
MALES / 100 FEMALES
95.54
FEMALES / 100 MALES
56.3
MEDIAN AGE
2.6
AVG FAMILY SIZE
2.3
AVG HOUSEHOLD SIZE
484
LABOR FORCE [ PEOPLE ]
50.4%
PERCENT IN LABOR FORCE
5.4%
UNEMPLOYMENT RATE
Income in Browns Point
Income Overview in Browns Point
Per Capita Income in Browns Point is $64,340, while median incomes of families and households are $117,813 and $97,917 respectively.
| Characteristic | Number | Measure |
| Per Capita Income | 1,097 | $64,340 |
| Median Family Income | 330 | $117,813 |
| Mean Family Income | 330 | $163,225 |
| Median Household Income | 474 | $97,917 |
| Mean Household Income | 474 | $143,400 |
| Income Deficit | 330 | $0 |
| Wage / Income Gap (%) | 1,097 | 50.38% |
| Wage / Income Gap ($) | 1,097 | 49.62¢ per $1 |
| Gini / Inequality Index | 1,097 | 0.47 |
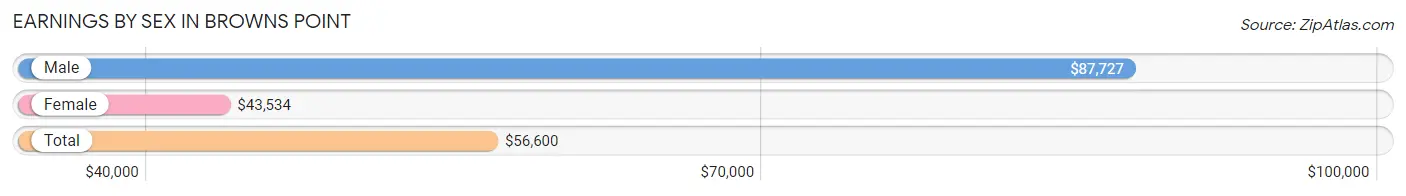
Earnings by Sex in Browns Point
Average Earnings in Browns Point are $56,600, $87,727 for men and $43,534 for women, a difference of 50.4%.
| Sex | Number | Average Earnings |
| Male | 270 (50.6%) | $87,727 |
| Female | 264 (49.4%) | $43,534 |
| Total | 534 (100.0%) | $56,600 |
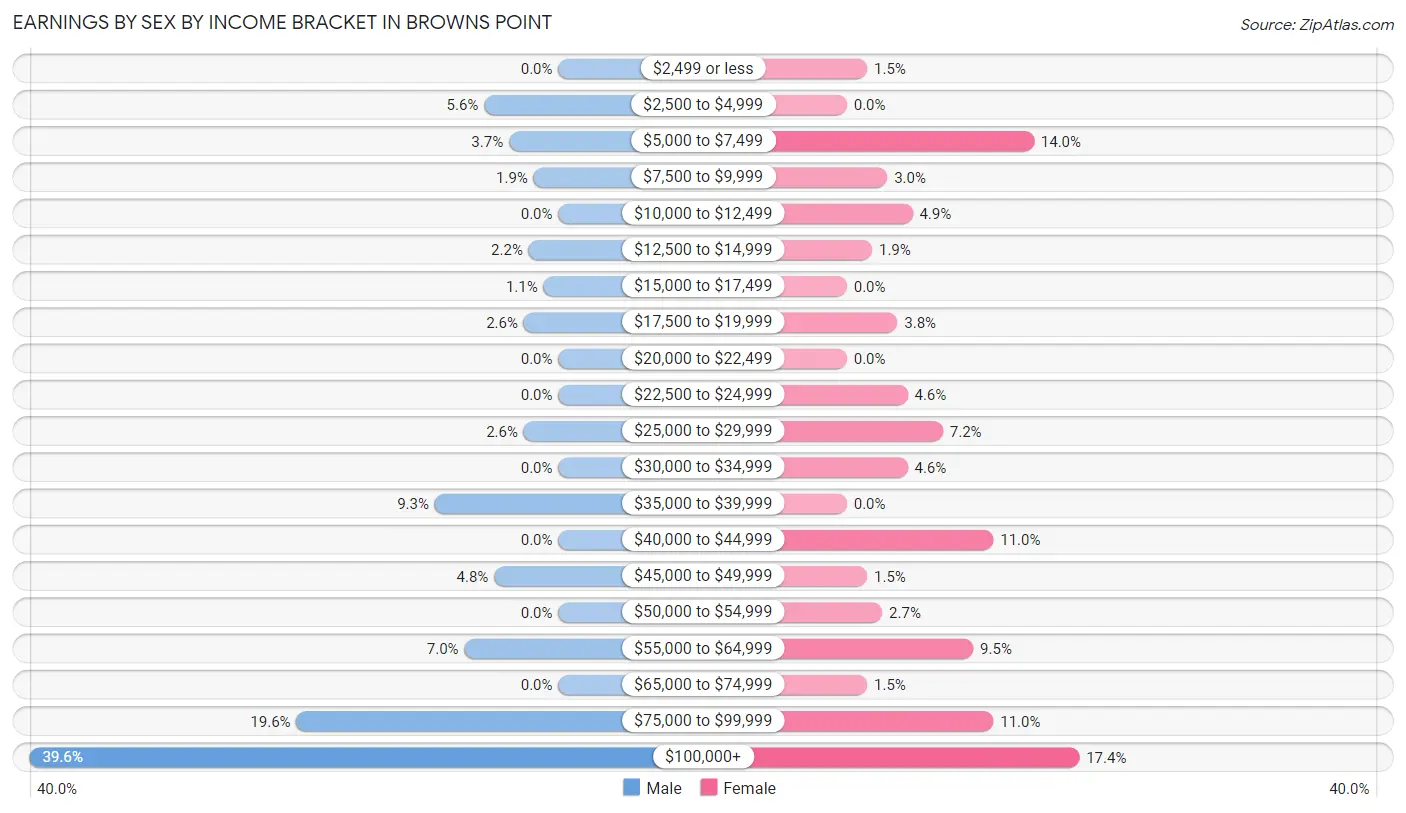
Earnings by Sex by Income Bracket in Browns Point
The most common earnings brackets in Browns Point are $100,000+ for men (107 | 39.6%) and $100,000+ for women (46 | 17.4%).
| Income | Male | Female |
| $2,499 or less | 0 (0.0%) | 4 (1.5%) |
| $2,500 to $4,999 | 15 (5.6%) | 0 (0.0%) |
| $5,000 to $7,499 | 10 (3.7%) | 37 (14.0%) |
| $7,500 to $9,999 | 5 (1.8%) | 8 (3.0%) |
| $10,000 to $12,499 | 0 (0.0%) | 13 (4.9%) |
| $12,500 to $14,999 | 6 (2.2%) | 5 (1.9%) |
| $15,000 to $17,499 | 3 (1.1%) | 0 (0.0%) |
| $17,500 to $19,999 | 7 (2.6%) | 10 (3.8%) |
| $20,000 to $22,499 | 0 (0.0%) | 0 (0.0%) |
| $22,500 to $24,999 | 0 (0.0%) | 12 (4.5%) |
| $25,000 to $29,999 | 7 (2.6%) | 19 (7.2%) |
| $30,000 to $34,999 | 0 (0.0%) | 12 (4.5%) |
| $35,000 to $39,999 | 25 (9.3%) | 0 (0.0%) |
| $40,000 to $44,999 | 0 (0.0%) | 29 (11.0%) |
| $45,000 to $49,999 | 13 (4.8%) | 4 (1.5%) |
| $50,000 to $54,999 | 0 (0.0%) | 7 (2.6%) |
| $55,000 to $64,999 | 19 (7.0%) | 25 (9.5%) |
| $65,000 to $74,999 | 0 (0.0%) | 4 (1.5%) |
| $75,000 to $99,999 | 53 (19.6%) | 29 (11.0%) |
| $100,000+ | 107 (39.6%) | 46 (17.4%) |
| Total | 270 (100.0%) | 264 (100.0%) |
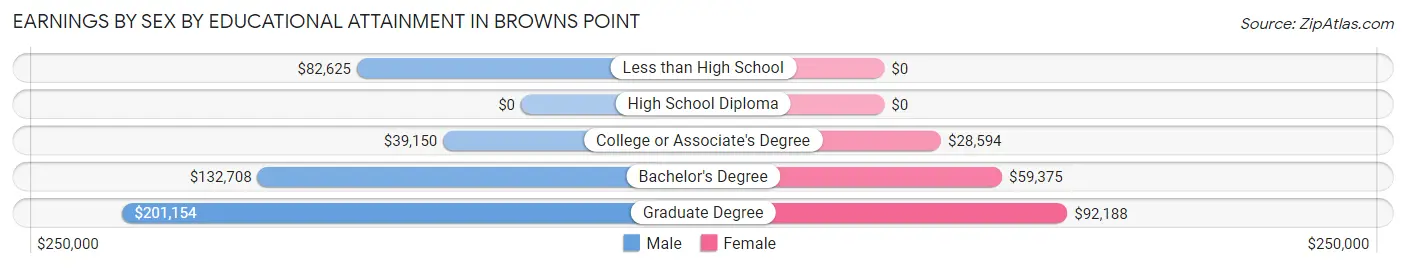
Earnings by Sex by Educational Attainment in Browns Point
Average earnings in Browns Point are $89,261 for men and $44,267 for women, a difference of 50.4%. Men with an educational attainment of graduate degree enjoy the highest average annual earnings of $201,154, while those with college or associate's degree education earn the least with $39,150. Women with an educational attainment of graduate degree earn the most with the average annual earnings of $92,188, while those with college or associate's degree education have the smallest earnings of $28,594.
| Educational Attainment | Male Income | Female Income |
| Less than High School | $82,625 | $0 |
| High School Diploma | - | - |
| College or Associate's Degree | $39,150 | $28,594 |
| Bachelor's Degree | $132,708 | $59,375 |
| Graduate Degree | $201,154 | $92,188 |
| Total | $89,261 | $44,267 |
Family Income in Browns Point
Family Income Brackets in Browns Point
According to the Browns Point family income data, there are 94 families falling into the $200,000+ income range, which is the most common income bracket and makes up 28.5% of all families.
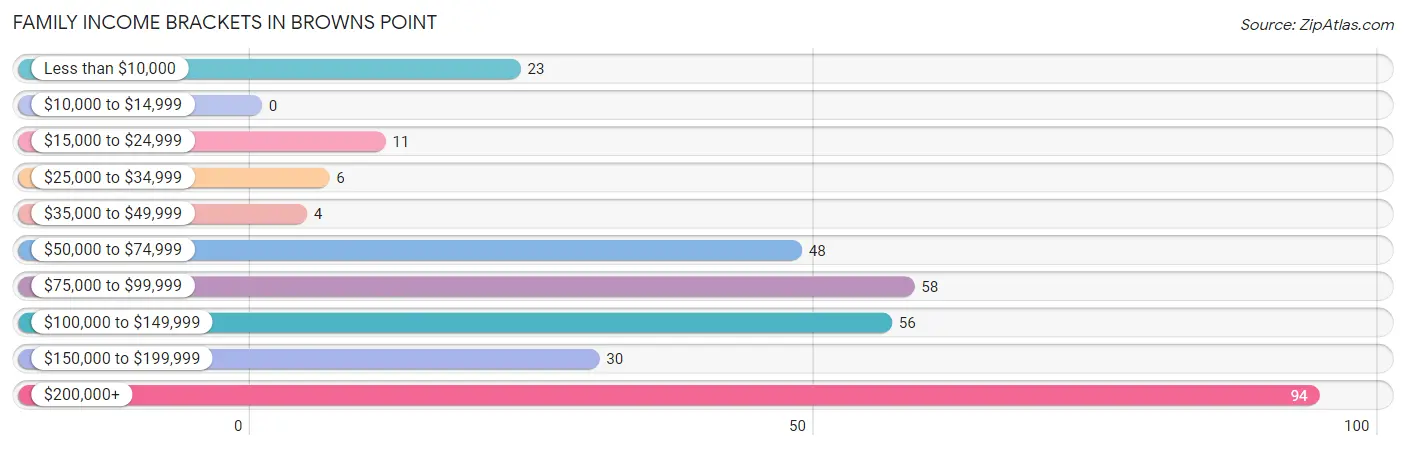
| Income Bracket | # Families | % Families |
| Less than $10,000 | 23 | 7.0% |
| $10,000 to $14,999 | 0 | 0.0% |
| $15,000 to $24,999 | 11 | 3.3% |
| $25,000 to $34,999 | 6 | 1.8% |
| $35,000 to $49,999 | 4 | 1.2% |
| $50,000 to $74,999 | 48 | 14.5% |
| $75,000 to $99,999 | 58 | 17.6% |
| $100,000 to $149,999 | 56 | 17.0% |
| $150,000 to $199,999 | 30 | 9.1% |
| $200,000+ | 94 | 28.5% |
Family Income by Famaliy Size in Browns Point
2-person families (215 | 65.1%) account for the highest median family income in Browns Point with $134,107 per family, while 2-person families (215 | 65.1%) have the highest median income of $67,054 per family member.
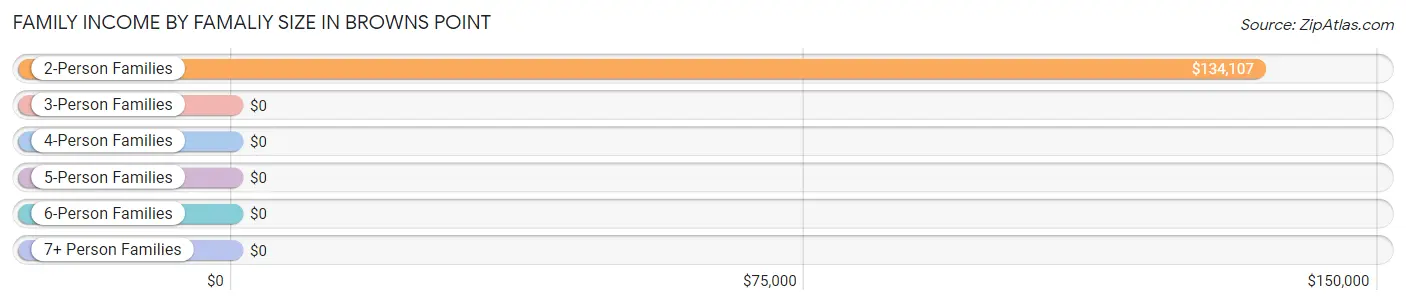
| Income Bracket | # Families | Median Income |
| 2-Person Families | 215 (65.1%) | $134,107 |
| 3-Person Families | 81 (24.5%) | $0 |
| 4-Person Families | 10 (3.0%) | $0 |
| 5-Person Families | 15 (4.5%) | $0 |
| 6-Person Families | 6 (1.8%) | $0 |
| 7+ Person Families | 3 (0.9%) | $0 |
| Total | 330 (100.0%) | $117,813 |
Family Income by Number of Earners in Browns Point
The median family income in Browns Point is $117,813, with families comprising 2 earners (83) having the highest median family income of $211,094, while families with 1 earner (98) have the lowest median family income of $84,250, accounting for 25.2% and 29.7% of families, respectively.
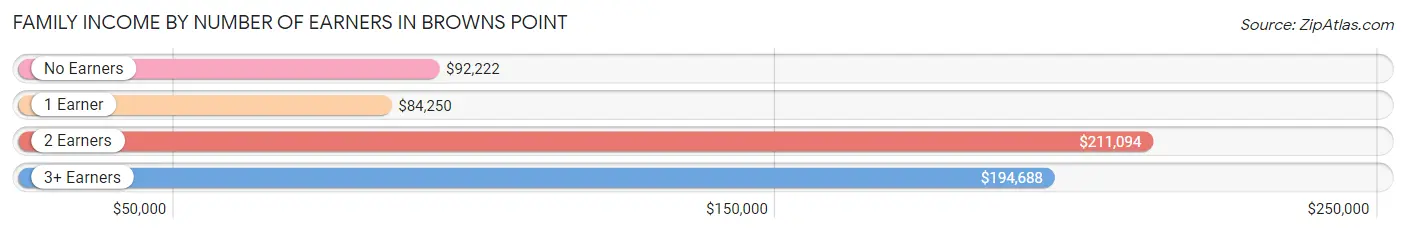
| Number of Earners | # Families | Median Income |
| No Earners | 122 (37.0%) | $92,222 |
| 1 Earner | 98 (29.7%) | $84,250 |
| 2 Earners | 83 (25.2%) | $211,094 |
| 3+ Earners | 27 (8.2%) | $194,688 |
| Total | 330 (100.0%) | $117,813 |
Household Income in Browns Point
Household Income Brackets in Browns Point
With 113 households falling in the category, the $200,000+ income range is the most frequent in Browns Point, accounting for 23.8% of all households.
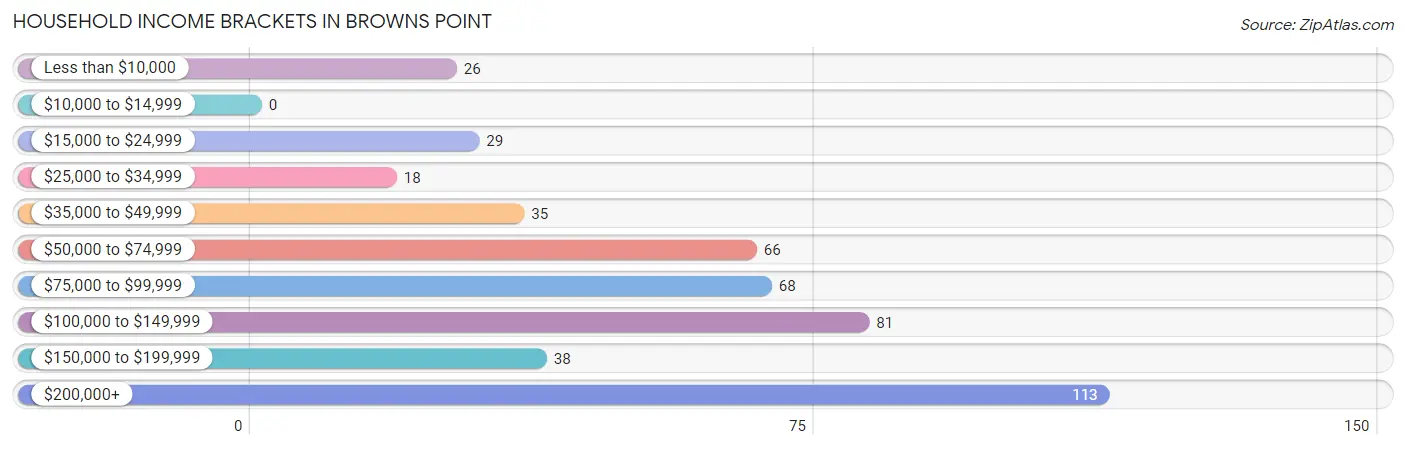
| Income Bracket | # Households | % Households |
| Less than $10,000 | 26 | 5.5% |
| $10,000 to $14,999 | 0 | 0.0% |
| $15,000 to $24,999 | 29 | 6.1% |
| $25,000 to $34,999 | 18 | 3.8% |
| $35,000 to $49,999 | 35 | 7.4% |
| $50,000 to $74,999 | 66 | 13.9% |
| $75,000 to $99,999 | 68 | 14.3% |
| $100,000 to $149,999 | 81 | 17.1% |
| $150,000 to $199,999 | 38 | 8.0% |
| $200,000+ | 113 | 23.8% |
Household Income by Householder Age in Browns Point
The median household income in Browns Point is $97,917, with the highest median household income of $138,438 found in the 45 to 64 years age bracket for the primary householder. A total of 194 households (40.9%) fall into this category.
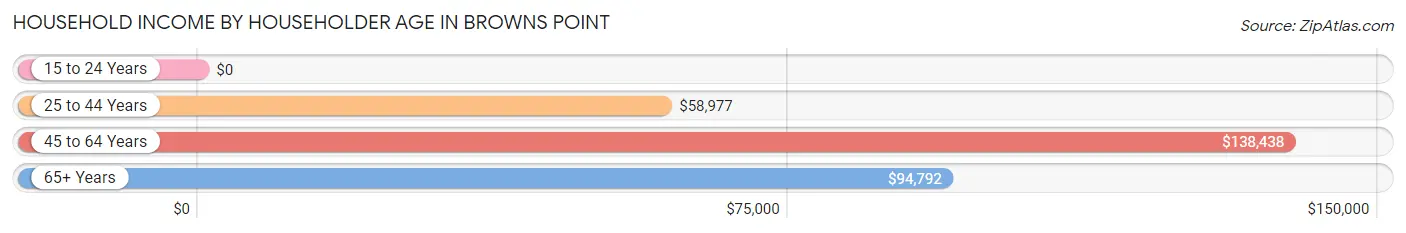
| Income Bracket | # Households | Median Income |
| 15 to 24 Years | 0 (0.0%) | $0 |
| 25 to 44 Years | 87 (18.3%) | $58,977 |
| 45 to 64 Years | 194 (40.9%) | $138,438 |
| 65+ Years | 193 (40.7%) | $94,792 |
| Total | 474 (100.0%) | $97,917 |
Poverty in Browns Point
Income Below Poverty by Sex and Age in Browns Point
With 11.9% poverty level for males and 17.2% for females among the residents of Browns Point, 6 to 11 year old males and under 5 year old females are the most vulnerable to poverty, with 35 males (71.4%) and 6 females (100.0%) in their respective age groups living below the poverty level.
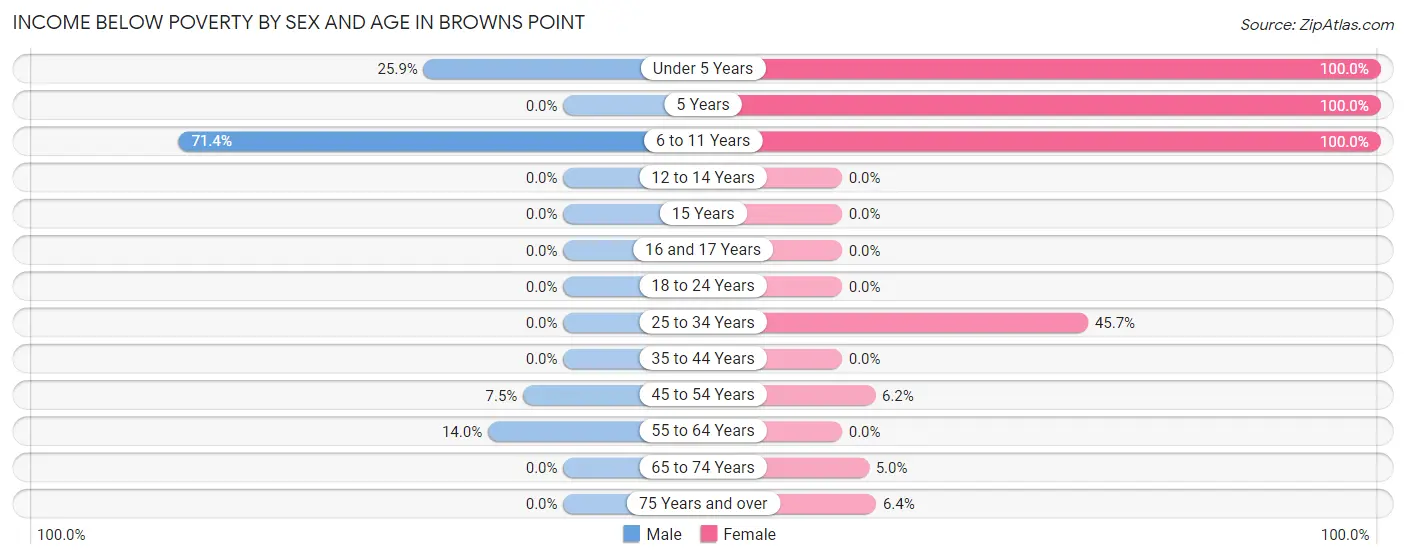
| Age Bracket | Male | Female |
| Under 5 Years | 7 (25.9%) | 6 (100.0%) |
| 5 Years | 0 (0.0%) | 6 (100.0%) |
| 6 to 11 Years | 35 (71.4%) | 29 (100.0%) |
| 12 to 14 Years | 0 (0.0%) | 0 (0.0%) |
| 15 Years | 0 (0.0%) | 0 (0.0%) |
| 16 and 17 Years | 0 (0.0%) | 0 (0.0%) |
| 18 to 24 Years | 0 (0.0%) | 0 (0.0%) |
| 25 to 34 Years | 0 (0.0%) | 37 (45.7%) |
| 35 to 44 Years | 0 (0.0%) | 0 (0.0%) |
| 45 to 54 Years | 5 (7.5%) | 4 (6.1%) |
| 55 to 64 Years | 20 (14.0%) | 0 (0.0%) |
| 65 to 74 Years | 0 (0.0%) | 6 (5.0%) |
| 75 Years and over | 0 (0.0%) | 4 (6.4%) |
| Total | 67 (11.9%) | 92 (17.2%) |
Income Above Poverty by Sex and Age in Browns Point
According to the poverty statistics in Browns Point, males aged 12 to 14 years and females aged 12 to 14 years are the age groups that are most secure financially, with 100.0% of males and 100.0% of females in these age groups living above the poverty line.
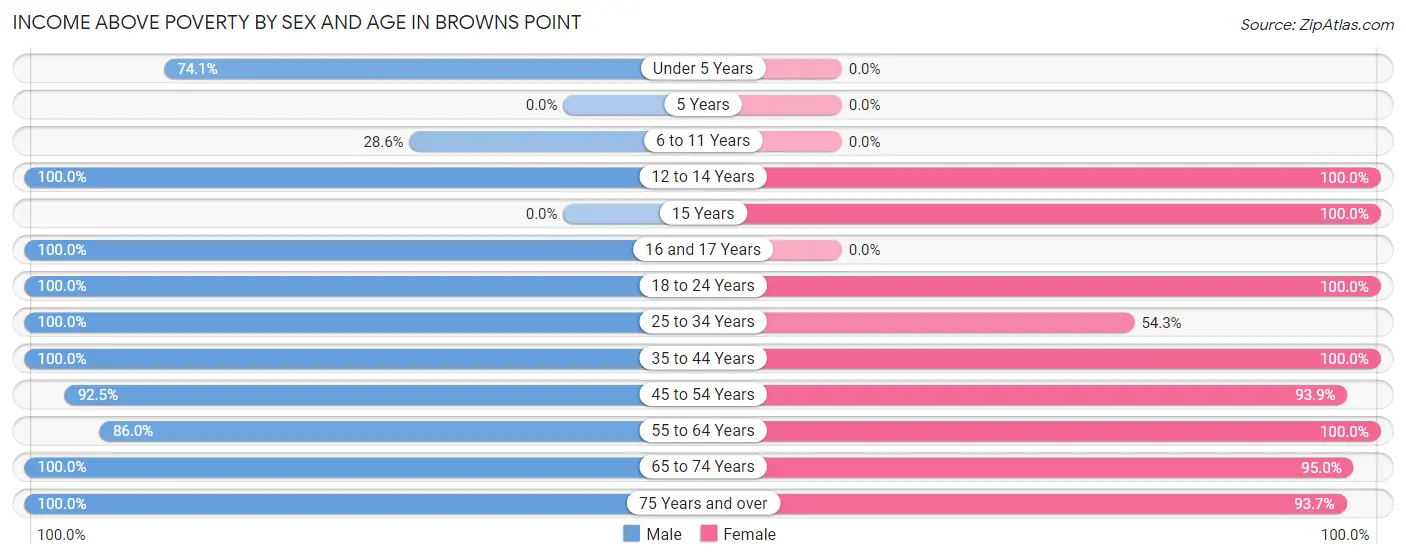
| Age Bracket | Male | Female |
| Under 5 Years | 20 (74.1%) | 0 (0.0%) |
| 5 Years | 0 (0.0%) | 0 (0.0%) |
| 6 to 11 Years | 14 (28.6%) | 0 (0.0%) |
| 12 to 14 Years | 11 (100.0%) | 4 (100.0%) |
| 15 Years | 0 (0.0%) | 5 (100.0%) |
| 16 and 17 Years | 9 (100.0%) | 0 (0.0%) |
| 18 to 24 Years | 30 (100.0%) | 26 (100.0%) |
| 25 to 34 Years | 71 (100.0%) | 44 (54.3%) |
| 35 to 44 Years | 21 (100.0%) | 15 (100.0%) |
| 45 to 54 Years | 62 (92.5%) | 61 (93.9%) |
| 55 to 64 Years | 123 (86.0%) | 116 (100.0%) |
| 65 to 74 Years | 88 (100.0%) | 114 (95.0%) |
| 75 Years and over | 45 (100.0%) | 59 (93.6%) |
| Total | 494 (88.1%) | 444 (82.8%) |
Income Below Poverty Among Married-Couple Families in Browns Point
The poverty statistics for married-couple families in Browns Point show that 2.1% or 5 of the total 241 families live below the poverty line. Families with 1 or 2 children have the highest poverty rate of 25.0%, comprising of 5 families. On the other hand, families with no children have the lowest poverty rate of 0.0%, which includes 0 families.
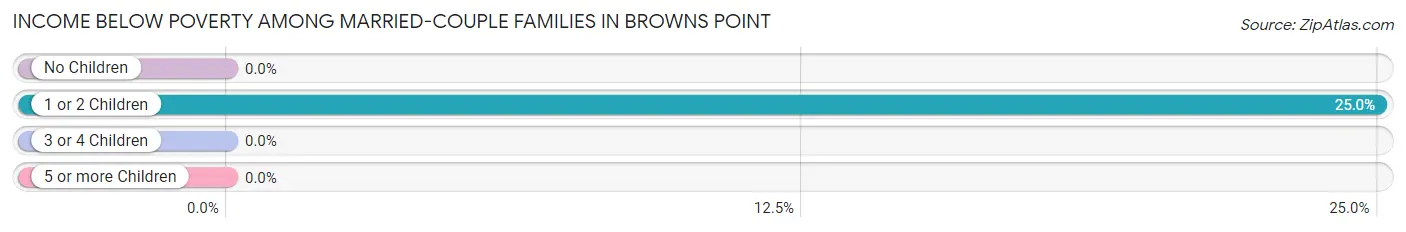
| Children | Above Poverty | Below Poverty |
| No Children | 206 (100.0%) | 0 (0.0%) |
| 1 or 2 Children | 15 (75.0%) | 5 (25.0%) |
| 3 or 4 Children | 15 (100.0%) | 0 (0.0%) |
| 5 or more Children | 0 (0.0%) | 0 (0.0%) |
| Total | 236 (97.9%) | 5 (2.1%) |
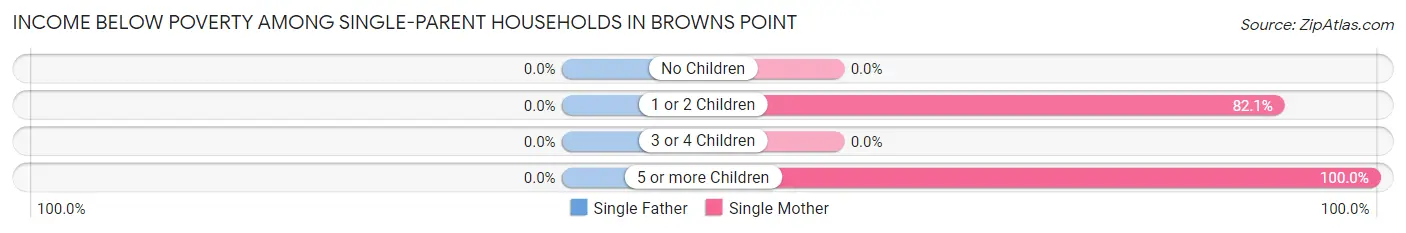
Income Below Poverty Among Single-Parent Households in Browns Point
| Children | Single Father | Single Mother |
| No Children | 0 (0.0%) | 0 (0.0%) |
| 1 or 2 Children | 0 (0.0%) | 23 (82.1%) |
| 3 or 4 Children | 0 (0.0%) | 0 (0.0%) |
| 5 or more Children | 0 (0.0%) | 6 (100.0%) |
| Total | 0 (0.0%) | 29 (39.2%) |
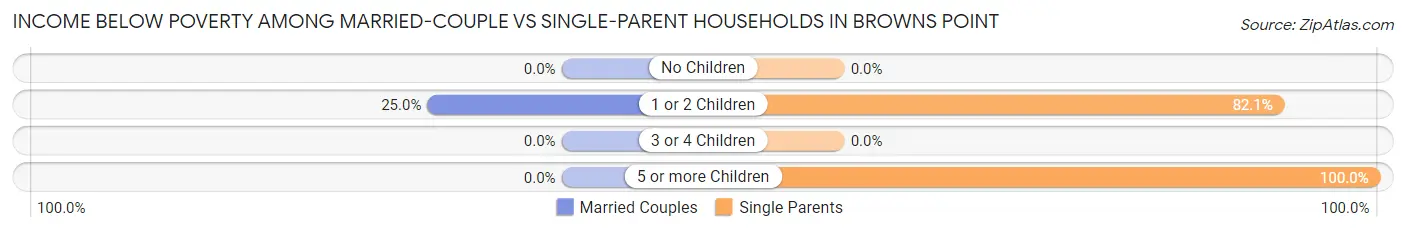
Income Below Poverty Among Married-Couple vs Single-Parent Households in Browns Point
The poverty data for Browns Point shows that 5 of the married-couple family households (2.1%) and 29 of the single-parent households (32.6%) are living below the poverty level. Within the married-couple family households, those with 1 or 2 children have the highest poverty rate, with 5 households (25.0%) falling below the poverty line. Among the single-parent households, those with 5 or more children have the highest poverty rate, with 6 household (100.0%) living below poverty.
| Children | Married-Couple Families | Single-Parent Households |
| No Children | 0 (0.0%) | 0 (0.0%) |
| 1 or 2 Children | 5 (25.0%) | 23 (82.1%) |
| 3 or 4 Children | 0 (0.0%) | 0 (0.0%) |
| 5 or more Children | 0 (0.0%) | 6 (100.0%) |
| Total | 5 (2.1%) | 29 (32.6%) |
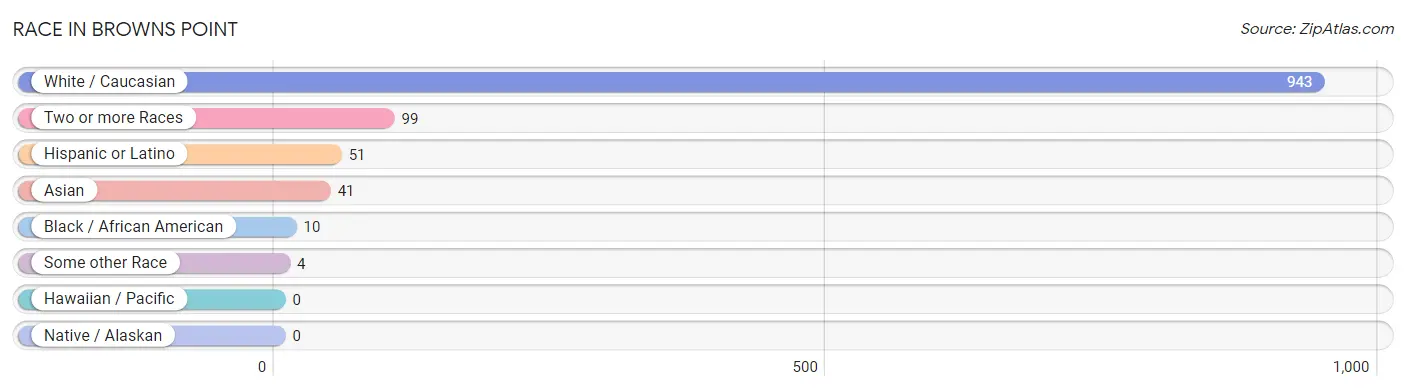
Race in Browns Point
The most populous races in Browns Point are White / Caucasian (943 | 86.0%), Two or more Races (99 | 9.0%), and Hispanic or Latino (51 | 4.6%).
| Race | # Population | % Population |
| Asian | 41 | 3.7% |
| Black / African American | 10 | 0.9% |
| Hawaiian / Pacific | 0 | 0.0% |
| Hispanic or Latino | 51 | 4.6% |
| Native / Alaskan | 0 | 0.0% |
| White / Caucasian | 943 | 86.0% |
| Two or more Races | 99 | 9.0% |
| Some other Race | 4 | 0.4% |
| Total | 1,097 | 100.0% |
Ancestry in Browns Point
The most populous ancestries reported in Browns Point are German (187 | 17.1%), English (151 | 13.8%), Irish (136 | 12.4%), Norwegian (92 | 8.4%), and Korean (76 | 6.9%), together accounting for 58.5% of all Browns Point residents.

| Ancestry | # Population | % Population |
| American | 65 | 5.9% |
| Arab | 4 | 0.4% |
| Austrian | 15 | 1.4% |
| Bhutanese | 10 | 0.9% |
| British | 18 | 1.6% |
| Czechoslovakian | 4 | 0.4% |
| Danish | 7 | 0.6% |
| Dutch | 16 | 1.5% |
| English | 151 | 13.8% |
| European | 44 | 4.0% |
| French | 55 | 5.0% |
| French Canadian | 3 | 0.3% |
| German | 187 | 17.1% |
| Greek | 7 | 0.6% |
| Irish | 136 | 12.4% |
| Italian | 43 | 3.9% |
| Korean | 76 | 6.9% |
| Lebanese | 4 | 0.4% |
| Lithuanian | 7 | 0.6% |
| Mexican | 39 | 3.6% |
| Native Hawaiian | 46 | 4.2% |
| Northern European | 4 | 0.4% |
| Norwegian | 92 | 8.4% |
| Polish | 10 | 0.9% |
| Portuguese | 8 | 0.7% |
| Puerto Rican | 12 | 1.1% |
| Scandinavian | 9 | 0.8% |
| Scotch-Irish | 19 | 1.7% |
| Scottish | 19 | 1.7% |
| Seminole | 5 | 0.5% |
| Slovene | 5 | 0.5% |
| Sri Lankan | 18 | 1.6% |
| Swedish | 47 | 4.3% |
| Welsh | 6 | 0.5% |
| Yugoslavian | 13 | 1.2% | View All 35 Rows |
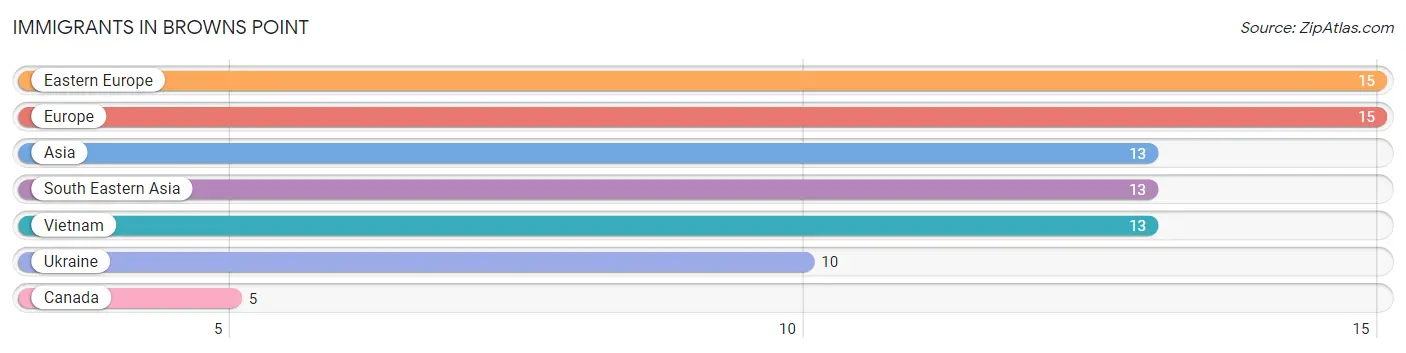
Immigrants in Browns Point
The most numerous immigrant groups reported in Browns Point came from Eastern Europe (15 | 1.4%), Europe (15 | 1.4%), Asia (13 | 1.2%), South Eastern Asia (13 | 1.2%), and Vietnam (13 | 1.2%), together accounting for 6.3% of all Browns Point residents.
| Immigration Origin | # Population | % Population |
| Asia | 13 | 1.2% |
| Canada | 5 | 0.5% |
| Eastern Europe | 15 | 1.4% |
| Europe | 15 | 1.4% |
| South Eastern Asia | 13 | 1.2% |
| Ukraine | 10 | 0.9% |
| Vietnam | 13 | 1.2% | View All 7 Rows |
Sex and Age in Browns Point
Sex and Age in Browns Point
The most populous age groups in Browns Point are 60 to 64 Years (83 | 14.8%) for men and 65 to 69 Years (67 | 12.5%) for women.
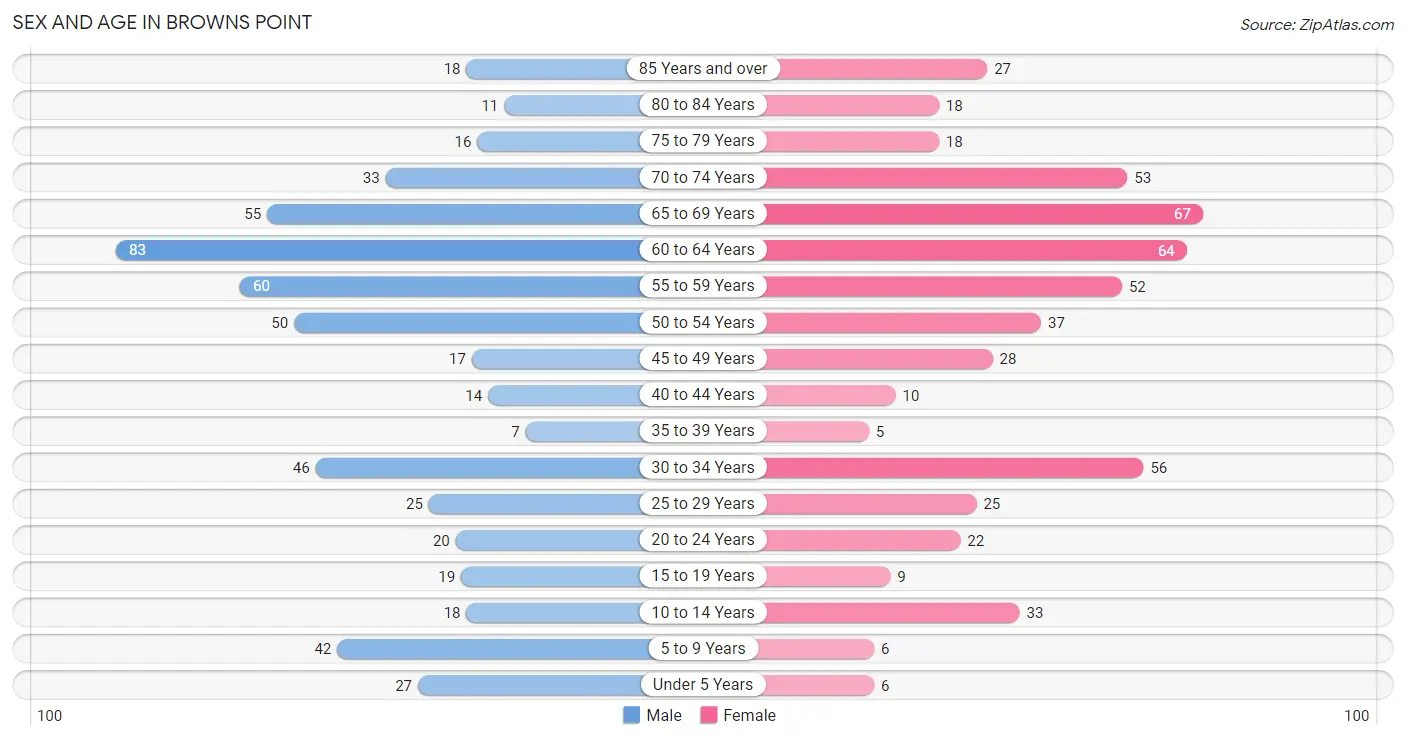
| Age Bracket | Male | Female |
| Under 5 Years | 27 (4.8%) | 6 (1.1%) |
| 5 to 9 Years | 42 (7.5%) | 6 (1.1%) |
| 10 to 14 Years | 18 (3.2%) | 33 (6.2%) |
| 15 to 19 Years | 19 (3.4%) | 9 (1.7%) |
| 20 to 24 Years | 20 (3.6%) | 22 (4.1%) |
| 25 to 29 Years | 25 (4.5%) | 25 (4.7%) |
| 30 to 34 Years | 46 (8.2%) | 56 (10.4%) |
| 35 to 39 Years | 7 (1.3%) | 5 (0.9%) |
| 40 to 44 Years | 14 (2.5%) | 10 (1.9%) |
| 45 to 49 Years | 17 (3.0%) | 28 (5.2%) |
| 50 to 54 Years | 50 (8.9%) | 37 (6.9%) |
| 55 to 59 Years | 60 (10.7%) | 52 (9.7%) |
| 60 to 64 Years | 83 (14.8%) | 64 (11.9%) |
| 65 to 69 Years | 55 (9.8%) | 67 (12.5%) |
| 70 to 74 Years | 33 (5.9%) | 53 (9.9%) |
| 75 to 79 Years | 16 (2.9%) | 18 (3.4%) |
| 80 to 84 Years | 11 (2.0%) | 18 (3.4%) |
| 85 Years and over | 18 (3.2%) | 27 (5.0%) |
| Total | 561 (100.0%) | 536 (100.0%) |
Families and Households in Browns Point
Median Family Size in Browns Point
The median family size in Browns Point is 2.62 persons per family, with single female/mother families (74 | 22.4%) accounting for the largest median family size of 3 persons per family. On the other hand, married-couple families (241 | 73.0%) represent the smallest median family size with 2.49 persons per family.
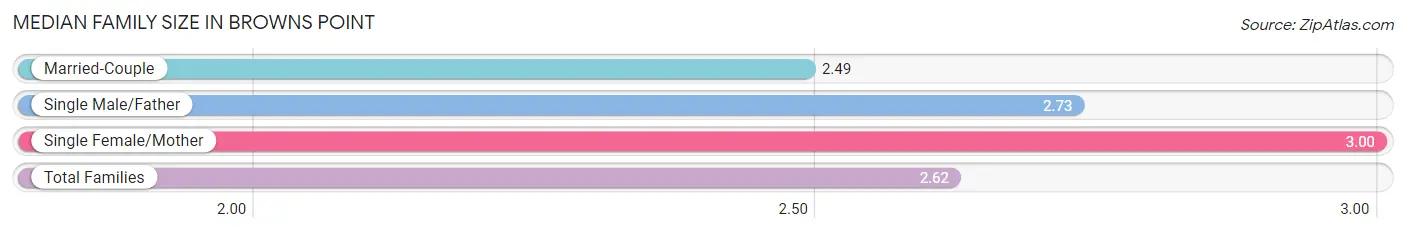
| Family Type | # Families | Family Size |
| Married-Couple | 241 (73.0%) | 2.49 |
| Single Male/Father | 15 (4.5%) | 2.73 |
| Single Female/Mother | 74 (22.4%) | 3.00 |
| Total Families | 330 (100.0%) | 2.62 |
Median Household Size in Browns Point
The median household size in Browns Point is 2.31 persons per household, with single female/mother households (74 | 15.6%) accounting for the largest median household size of 3.43 persons per household. non-family households (144 | 30.4%) represent the smallest median household size with 1.27 persons per household.
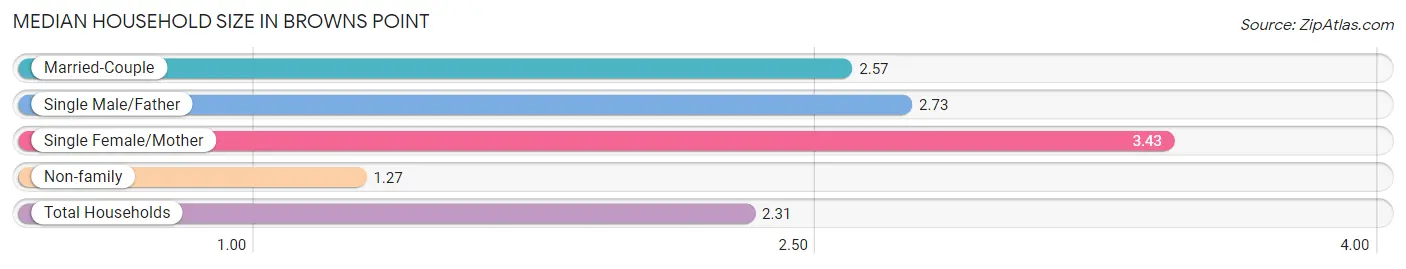
| Household Type | # Households | Household Size |
| Married-Couple | 241 (50.8%) | 2.57 |
| Single Male/Father | 15 (3.2%) | 2.73 |
| Single Female/Mother | 74 (15.6%) | 3.43 |
| Non-family | 144 (30.4%) | 1.27 |
| Total Households | 474 (100.0%) | 2.31 |
Household Size by Marriage Status in Browns Point
Out of a total of 474 households in Browns Point, 330 (69.6%) are family households, while 144 (30.4%) are nonfamily households. The most numerous type of family households are 2-person households, comprising 198, and the most common type of nonfamily households are 1-person households, comprising 105.
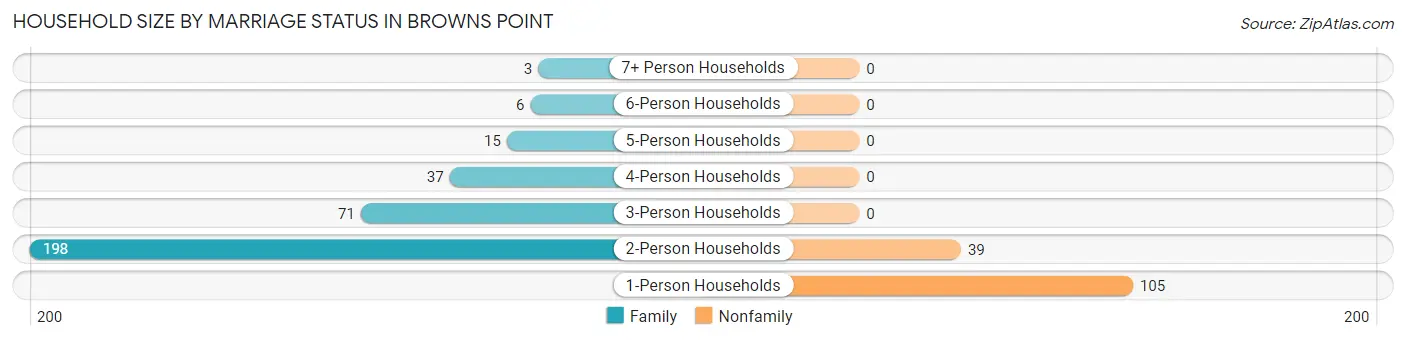
| Household Size | Family Households | Nonfamily Households |
| 1-Person Households | - | 105 (22.2%) |
| 2-Person Households | 198 (41.8%) | 39 (8.2%) |
| 3-Person Households | 71 (15.0%) | 0 (0.0%) |
| 4-Person Households | 37 (7.8%) | 0 (0.0%) |
| 5-Person Households | 15 (3.2%) | 0 (0.0%) |
| 6-Person Households | 6 (1.3%) | 0 (0.0%) |
| 7+ Person Households | 3 (0.6%) | 0 (0.0%) |
| Total | 330 (69.6%) | 144 (30.4%) |
Female Fertility in Browns Point
Fertility by Age in Browns Point
Average fertility rate in Browns Point is 96.0 births per 1,000 women. Women in the age bracket of 20 to 34 years have the highest fertility rate with 155.0 births per 1,000 women. Women in the age bracket of 20 to 34 years acount for 100.0% of all women with births.
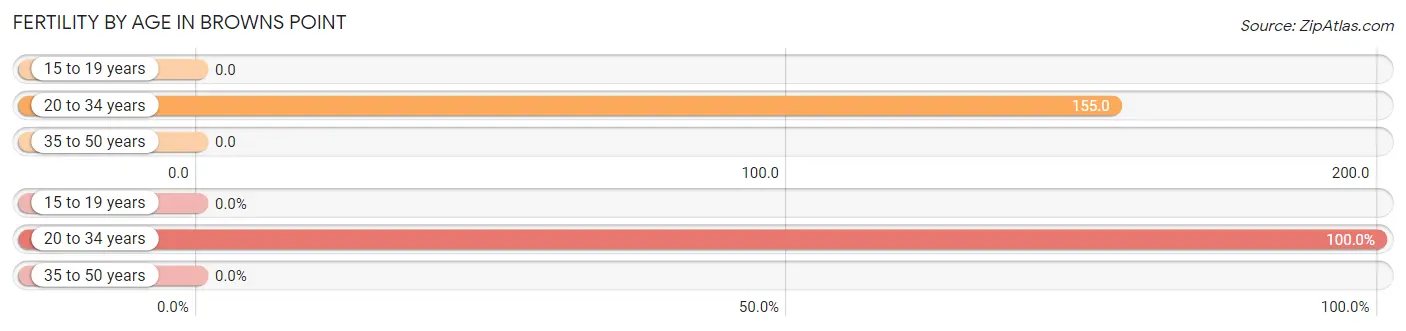
| Age Bracket | Women with Births | Births / 1,000 Women |
| 15 to 19 years | 0 (0.0%) | 0.0 |
| 20 to 34 years | 16 (100.0%) | 155.0 |
| 35 to 50 years | 0 (0.0%) | 0.0 |
| Total | 16 (100.0%) | 96.0 |
Fertility by Age by Marriage Status in Browns Point
62.5% of women with births (16) in Browns Point are married. The highest percentage of unmarried women with births falls into 20 to 34 years age bracket with 37.5% of them unmarried at the time of birth, while the lowest percentage of unmarried women with births belong to 20 to 34 years age bracket with 37.5% of them unmarried.
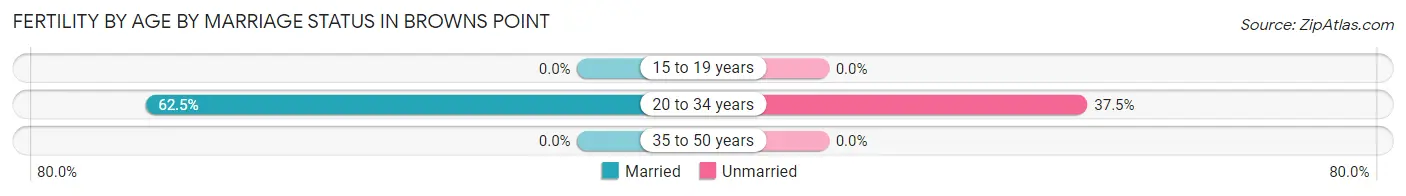
| Age Bracket | Married | Unmarried |
| 15 to 19 years | 0 (0.0%) | 0 (0.0%) |
| 20 to 34 years | 10 (62.5%) | 6 (37.5%) |
| 35 to 50 years | 0 (0.0%) | 0 (0.0%) |
| Total | 10 (62.5%) | 6 (37.5%) |
Fertility by Education in Browns Point
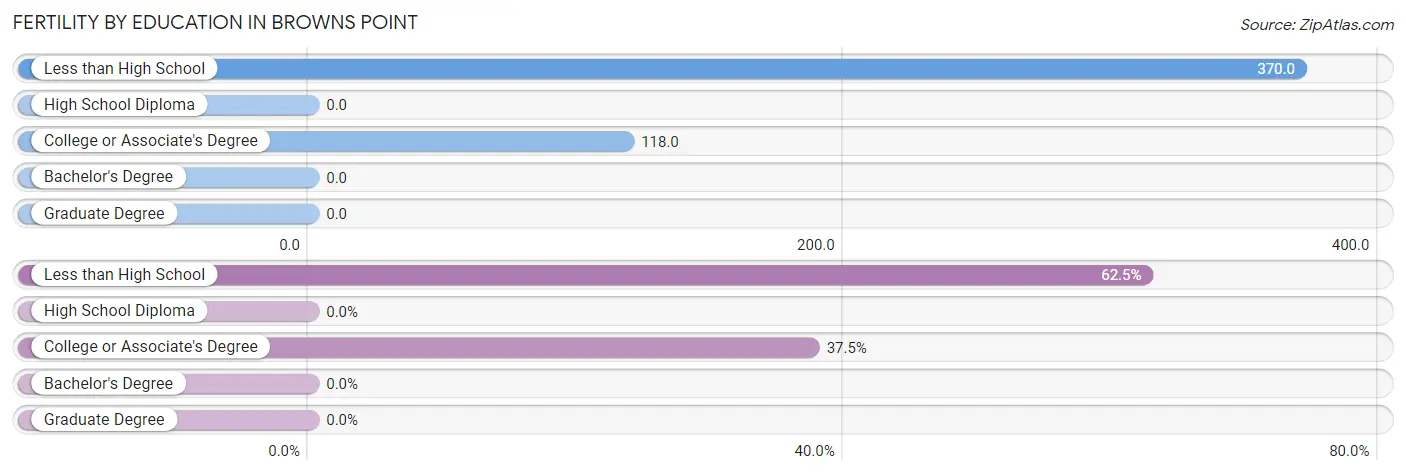
| Educational Attainment | Women with Births | Births / 1,000 Women |
| Less than High School | 10 (62.5%) | 370.0 |
| High School Diploma | 0 (0.0%) | 0.0 |
| College or Associate's Degree | 6 (37.5%) | 118.0 |
| Bachelor's Degree | 0 (0.0%) | 0.0 |
| Graduate Degree | 0 (0.0%) | 0.0 |
| Total | 16 (100.0%) | 96.0 |
Fertility by Education by Marriage Status in Browns Point
37.5% of women with births in Browns Point are unmarried. Women with the educational attainment of less than high school are most likely to be married with 100.0% of them married at childbirth, while women with the educational attainment of college or associate's degree are least likely to be married with 100.0% of them unmarried at childbirth.
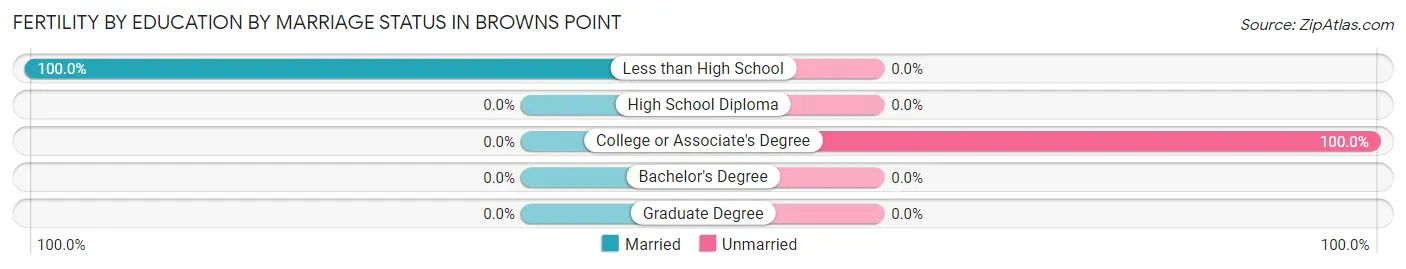
| Educational Attainment | Married | Unmarried |
| Less than High School | 10 (100.0%) | 0 (0.0%) |
| High School Diploma | 0 (0.0%) | 0 (0.0%) |
| College or Associate's Degree | 0 (0.0%) | 6 (100.0%) |
| Bachelor's Degree | 0 (0.0%) | 0 (0.0%) |
| Graduate Degree | 0 (0.0%) | 0 (0.0%) |
| Total | 10 (62.5%) | 6 (37.5%) |
Employment Characteristics in Browns Point
Employment by Class of Employer in Browns Point
Among the 458 employed individuals in Browns Point, private company employees (290 | 63.3%), self-employed (incorporated) (49 | 10.7%), and self-employed (not incorporated) (45 | 9.8%) make up the most common classes of employment.
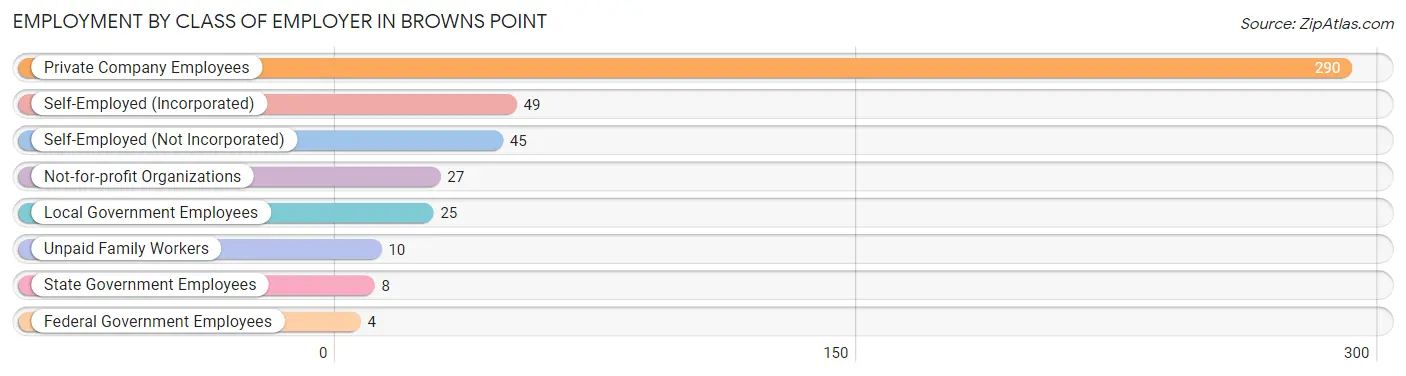
| Employer Class | # Employees | % Employees |
| Private Company Employees | 290 | 63.3% |
| Self-Employed (Incorporated) | 49 | 10.7% |
| Self-Employed (Not Incorporated) | 45 | 9.8% |
| Not-for-profit Organizations | 27 | 5.9% |
| Local Government Employees | 25 | 5.5% |
| State Government Employees | 8 | 1.8% |
| Federal Government Employees | 4 | 0.9% |
| Unpaid Family Workers | 10 | 2.2% |
| Total | 458 | 100.0% |
Employment Status by Age in Browns Point
According to the labor force statistics for Browns Point, out of the total population over 16 years of age (960), 50.4% or 484 individuals are in the labor force, with 5.4% or 26 of them unemployed. The age group with the highest labor force participation rate is 55 to 59 years, with 86.6% or 97 individuals in the labor force. Within the labor force, the 35 to 44 years age range has the highest percentage of unemployed individuals, with 22.2% or 6 of them being unemployed.
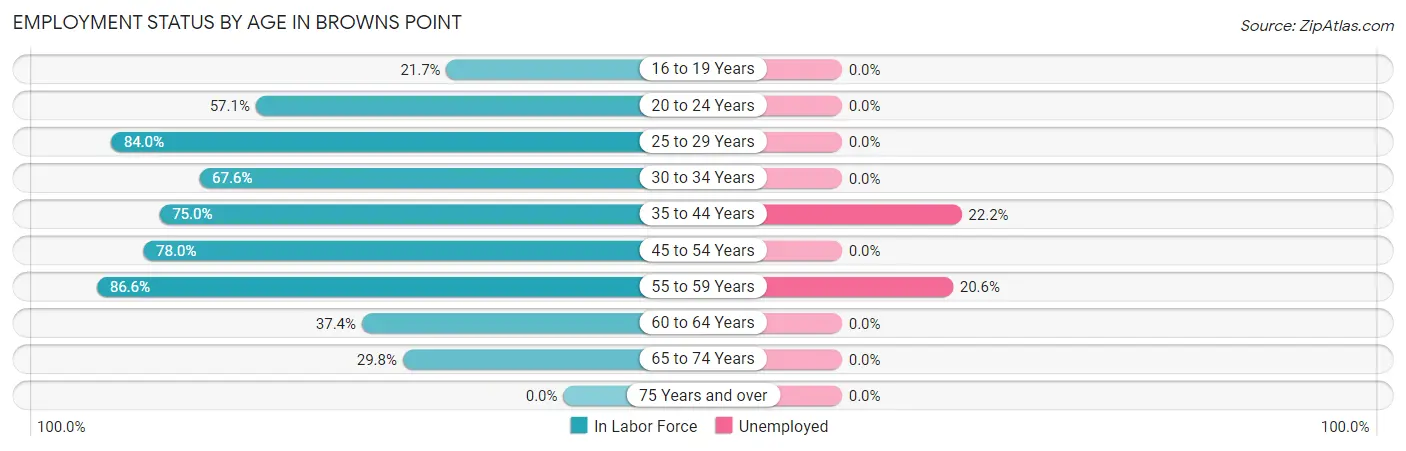
| Age Bracket | In Labor Force | Unemployed |
| 16 to 19 Years | 5 (21.7%) | 0 (0.0%) |
| 20 to 24 Years | 24 (57.1%) | 0 (0.0%) |
| 25 to 29 Years | 42 (84.0%) | 0 (0.0%) |
| 30 to 34 Years | 69 (67.6%) | 0 (0.0%) |
| 35 to 44 Years | 27 (75.0%) | 6 (22.2%) |
| 45 to 54 Years | 103 (78.0%) | 0 (0.0%) |
| 55 to 59 Years | 97 (86.6%) | 20 (20.6%) |
| 60 to 64 Years | 55 (37.4%) | 0 (0.0%) |
| 65 to 74 Years | 62 (29.8%) | 0 (0.0%) |
| 75 Years and over | 0 (0.0%) | 0 (0.0%) |
| Total | 484 (50.4%) | 26 (5.4%) |
Employment Status by Educational Attainment in Browns Point
According to labor force statistics for Browns Point, 67.9% of individuals (393) out of the total population between 25 and 64 years of age (579) are in the labor force, with 6.6% or 26 of them being unemployed. The group with the highest labor force participation rate are those with the educational attainment of college / associate degree, with 93.8% or 136 individuals in the labor force. Within the labor force, individuals with high school diploma education have the highest percentage of unemployment, with 40.0% or 20 of them being unemployed.
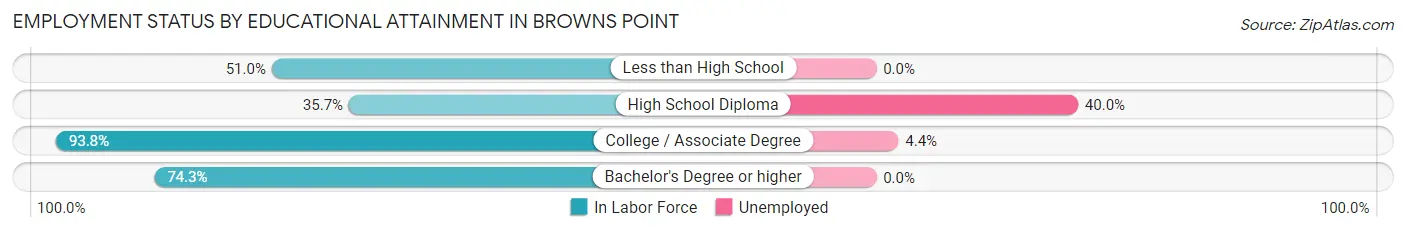
| Educational Attainment | In Labor Force | Unemployed |
| Less than High School | 25 (51.0%) | 0 (0.0%) |
| High School Diploma | 50 (35.7%) | 56 (40.0%) |
| College / Associate Degree | 136 (93.8%) | 6 (4.4%) |
| Bachelor's Degree or higher | 182 (74.3%) | 0 (0.0%) |
| Total | 393 (67.9%) | 38 (6.6%) |
Employment Occupations by Sex in Browns Point
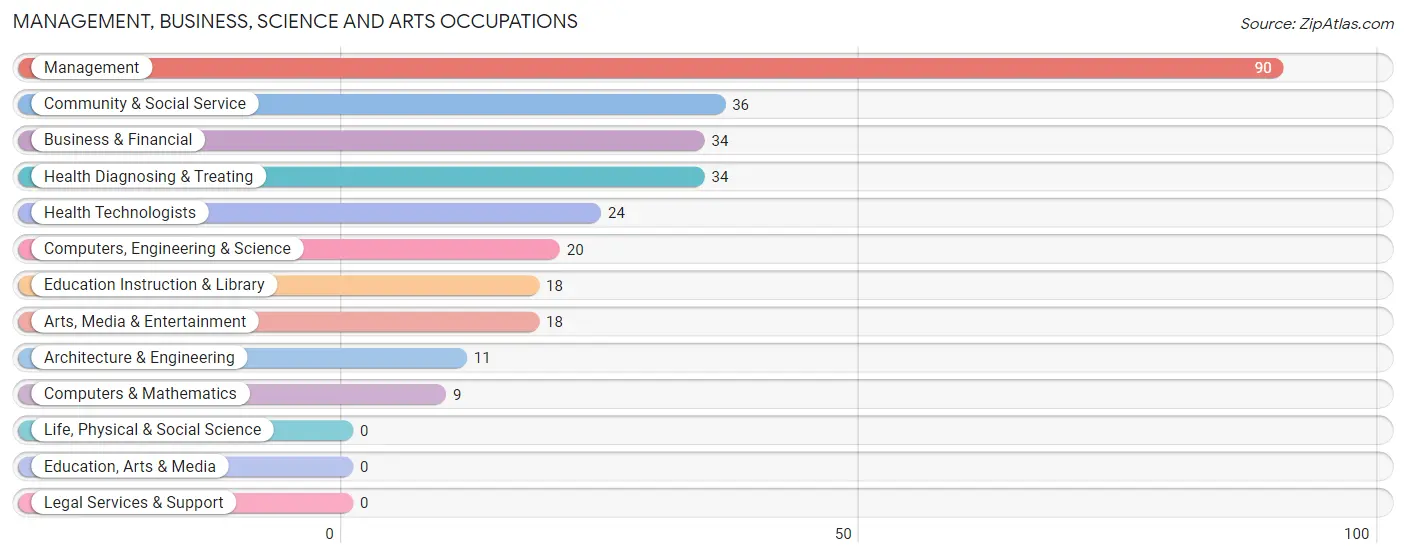
Management, Business, Science and Arts Occupations
The most common Management, Business, Science and Arts occupations in Browns Point are Management (90 | 19.7%), Community & Social Service (36 | 7.9%), Business & Financial (34 | 7.4%), Health Diagnosing & Treating (34 | 7.4%), and Health Technologists (24 | 5.2%).
Management, Business, Science and Arts Occupations by Sex
Within the Management, Business, Science and Arts occupations in Browns Point, the most male-oriented occupations are Architecture & Engineering (100.0%), Health Technologists (79.2%), and Management (78.9%), while the most female-oriented occupations are Business & Financial (100.0%), Computers & Mathematics (100.0%), and Arts, Media & Entertainment (100.0%).
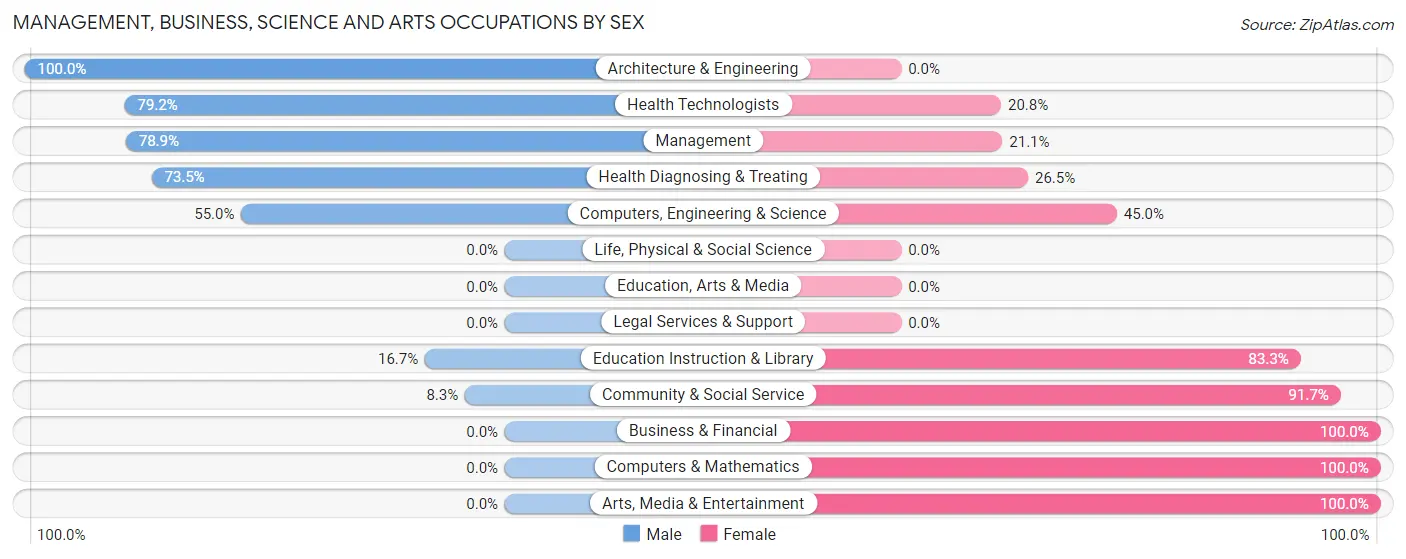
| Occupation | Male | Female |
| Management | 71 (78.9%) | 19 (21.1%) |
| Business & Financial | 0 (0.0%) | 34 (100.0%) |
| Computers, Engineering & Science | 11 (55.0%) | 9 (45.0%) |
| Computers & Mathematics | 0 (0.0%) | 9 (100.0%) |
| Architecture & Engineering | 11 (100.0%) | 0 (0.0%) |
| Life, Physical & Social Science | 0 (0.0%) | 0 (0.0%) |
| Community & Social Service | 3 (8.3%) | 33 (91.7%) |
| Education, Arts & Media | 0 (0.0%) | 0 (0.0%) |
| Legal Services & Support | 0 (0.0%) | 0 (0.0%) |
| Education Instruction & Library | 3 (16.7%) | 15 (83.3%) |
| Arts, Media & Entertainment | 0 (0.0%) | 18 (100.0%) |
| Health Diagnosing & Treating | 25 (73.5%) | 9 (26.5%) |
| Health Technologists | 19 (79.2%) | 5 (20.8%) |
| Total (Category) | 110 (51.4%) | 104 (48.6%) |
| Total (Overall) | 251 (54.8%) | 207 (45.2%) |
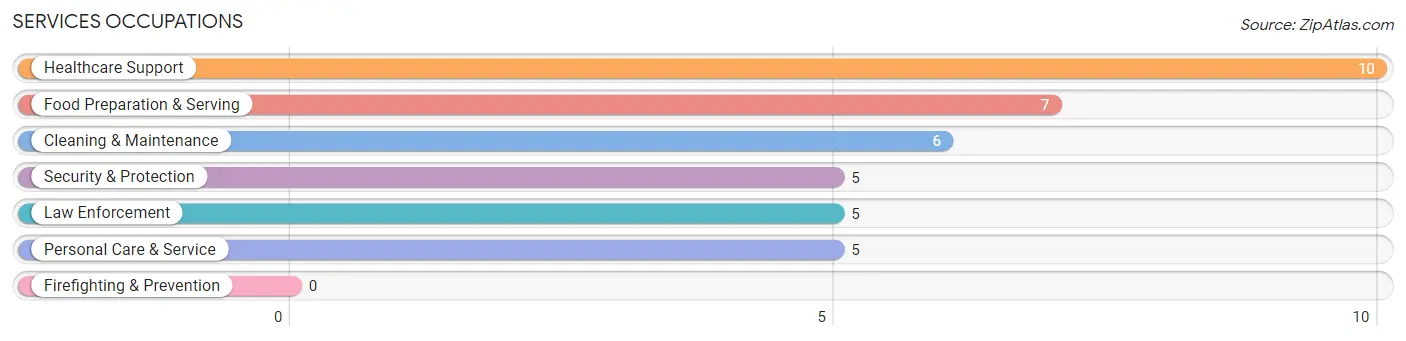
Services Occupations
The most common Services occupations in Browns Point are Healthcare Support (10 | 2.2%), Food Preparation & Serving (7 | 1.5%), Cleaning & Maintenance (6 | 1.3%), Security & Protection (5 | 1.1%), and Law Enforcement (5 | 1.1%).
Services Occupations by Sex
Within the Services occupations in Browns Point, the most male-oriented occupations are Food Preparation & Serving (100.0%), and Personal Care & Service (100.0%), while the most female-oriented occupations are Healthcare Support (100.0%), Security & Protection (100.0%), and Law Enforcement (100.0%).
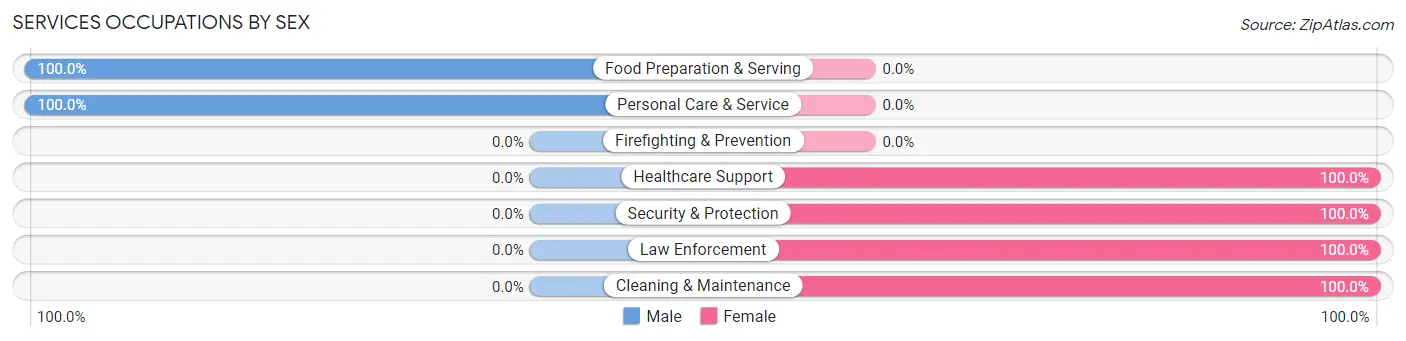
| Occupation | Male | Female |
| Healthcare Support | 0 (0.0%) | 10 (100.0%) |
| Security & Protection | 0 (0.0%) | 5 (100.0%) |
| Firefighting & Prevention | 0 (0.0%) | 0 (0.0%) |
| Law Enforcement | 0 (0.0%) | 5 (100.0%) |
| Food Preparation & Serving | 7 (100.0%) | 0 (0.0%) |
| Cleaning & Maintenance | 0 (0.0%) | 6 (100.0%) |
| Personal Care & Service | 5 (100.0%) | 0 (0.0%) |
| Total (Category) | 12 (36.4%) | 21 (63.6%) |
| Total (Overall) | 251 (54.8%) | 207 (45.2%) |
Sales and Office Occupations
The most common Sales and Office occupations in Browns Point are Sales & Related (50 | 10.9%), and Office & Administration (49 | 10.7%).
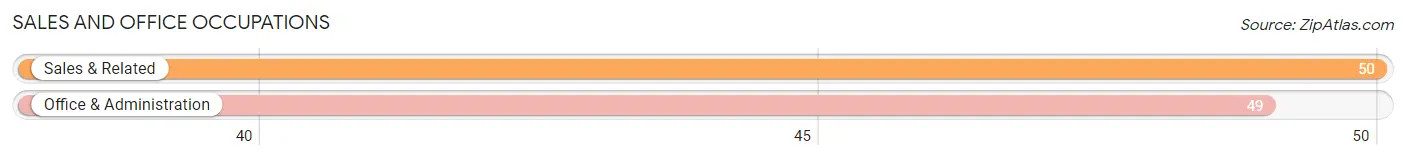
Sales and Office Occupations by Sex
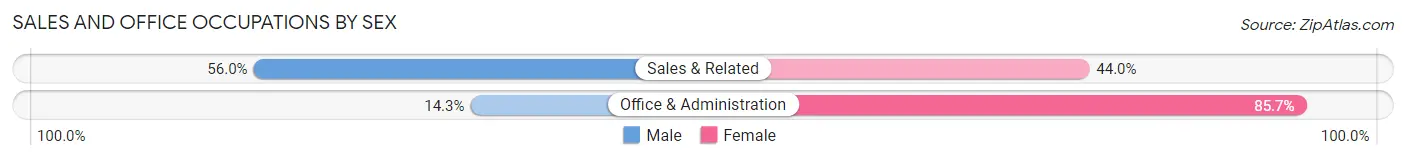
| Occupation | Male | Female |
| Sales & Related | 28 (56.0%) | 22 (44.0%) |
| Office & Administration | 7 (14.3%) | 42 (85.7%) |
| Total (Category) | 35 (35.3%) | 64 (64.6%) |
| Total (Overall) | 251 (54.8%) | 207 (45.2%) |
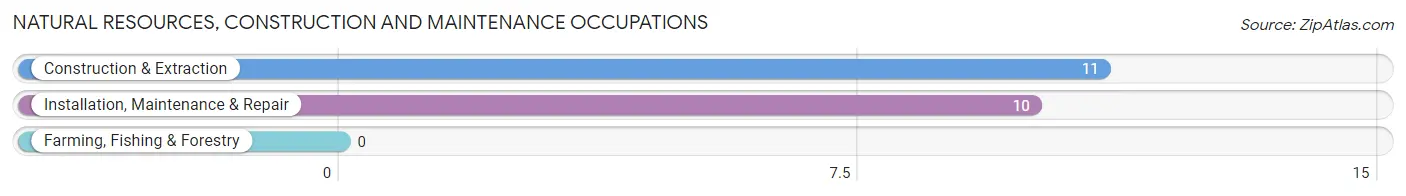
Natural Resources, Construction and Maintenance Occupations
The most common Natural Resources, Construction and Maintenance occupations in Browns Point are Construction & Extraction (11 | 2.4%), and Installation, Maintenance & Repair (10 | 2.2%).
Natural Resources, Construction and Maintenance Occupations by Sex
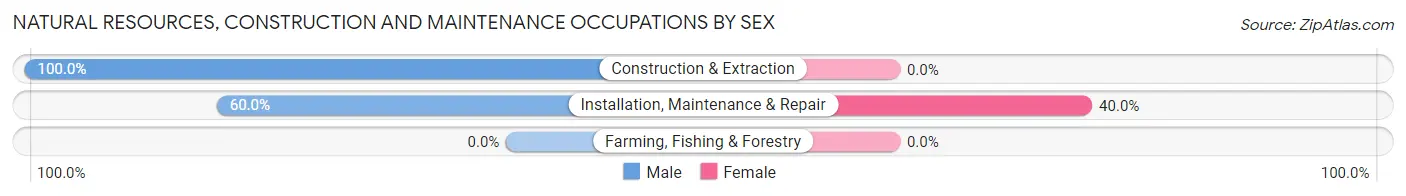
| Occupation | Male | Female |
| Farming, Fishing & Forestry | 0 (0.0%) | 0 (0.0%) |
| Construction & Extraction | 11 (100.0%) | 0 (0.0%) |
| Installation, Maintenance & Repair | 6 (60.0%) | 4 (40.0%) |
| Total (Category) | 17 (80.9%) | 4 (19.1%) |
| Total (Overall) | 251 (54.8%) | 207 (45.2%) |
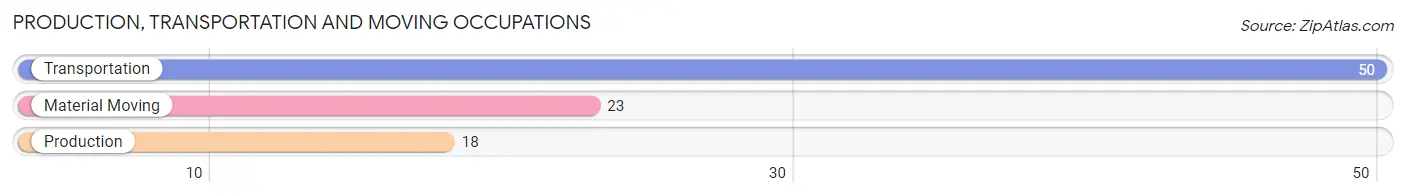
Production, Transportation and Moving Occupations
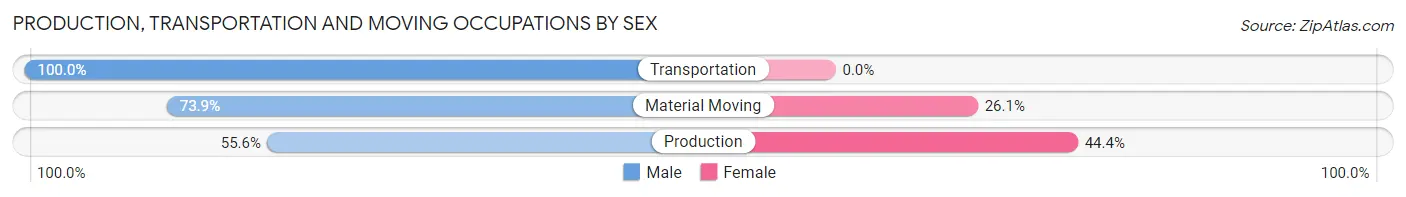
The most common Production, Transportation and Moving occupations in Browns Point are Transportation (50 | 10.9%), Material Moving (23 | 5.0%), and Production (18 | 3.9%).
Production, Transportation and Moving Occupations by Sex
| Occupation | Male | Female |
| Production | 10 (55.6%) | 8 (44.4%) |
| Transportation | 50 (100.0%) | 0 (0.0%) |
| Material Moving | 17 (73.9%) | 6 (26.1%) |
| Total (Category) | 77 (84.6%) | 14 (15.4%) |
| Total (Overall) | 251 (54.8%) | 207 (45.2%) |
Employment Industries by Sex in Browns Point
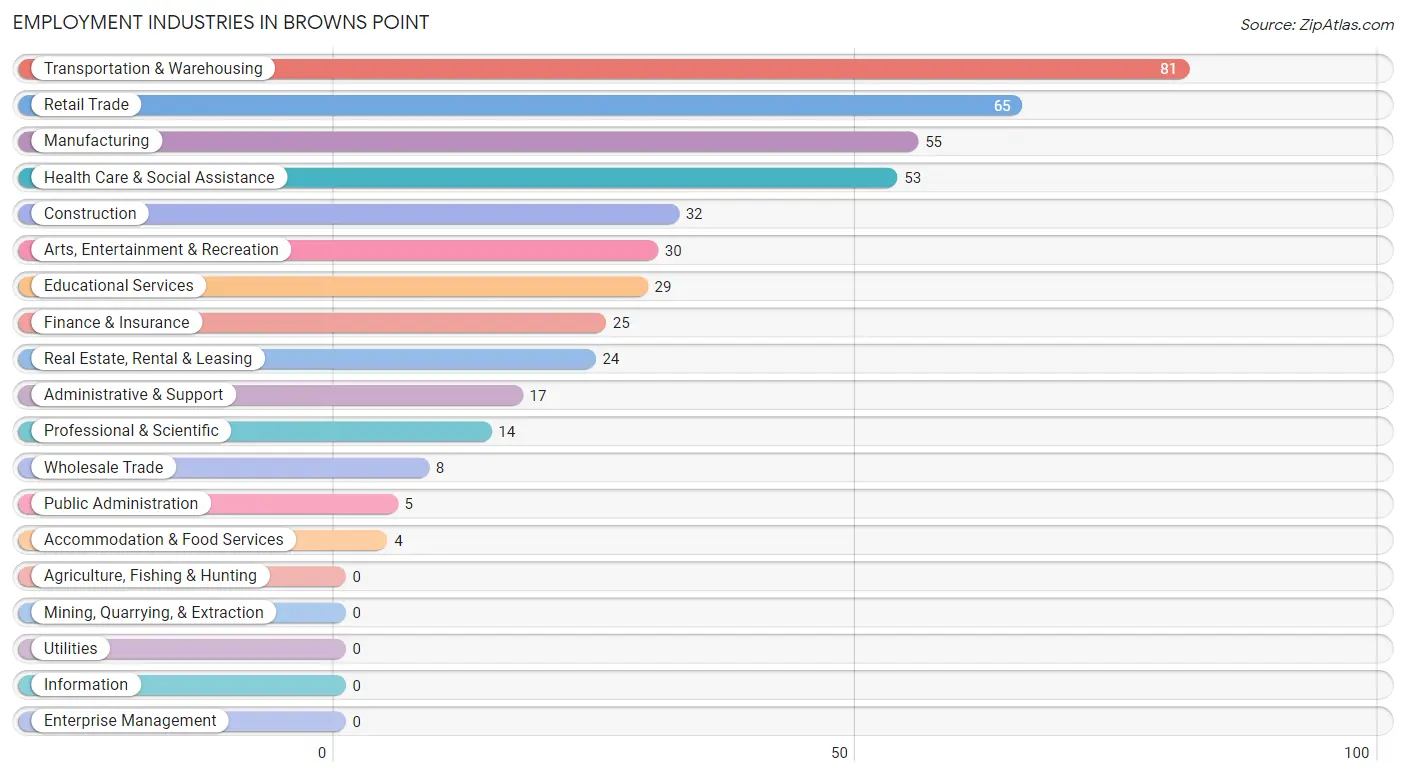
Employment Industries in Browns Point
The major employment industries in Browns Point include Transportation & Warehousing (81 | 17.7%), Retail Trade (65 | 14.2%), Manufacturing (55 | 12.0%), Health Care & Social Assistance (53 | 11.6%), and Construction (32 | 7.0%).
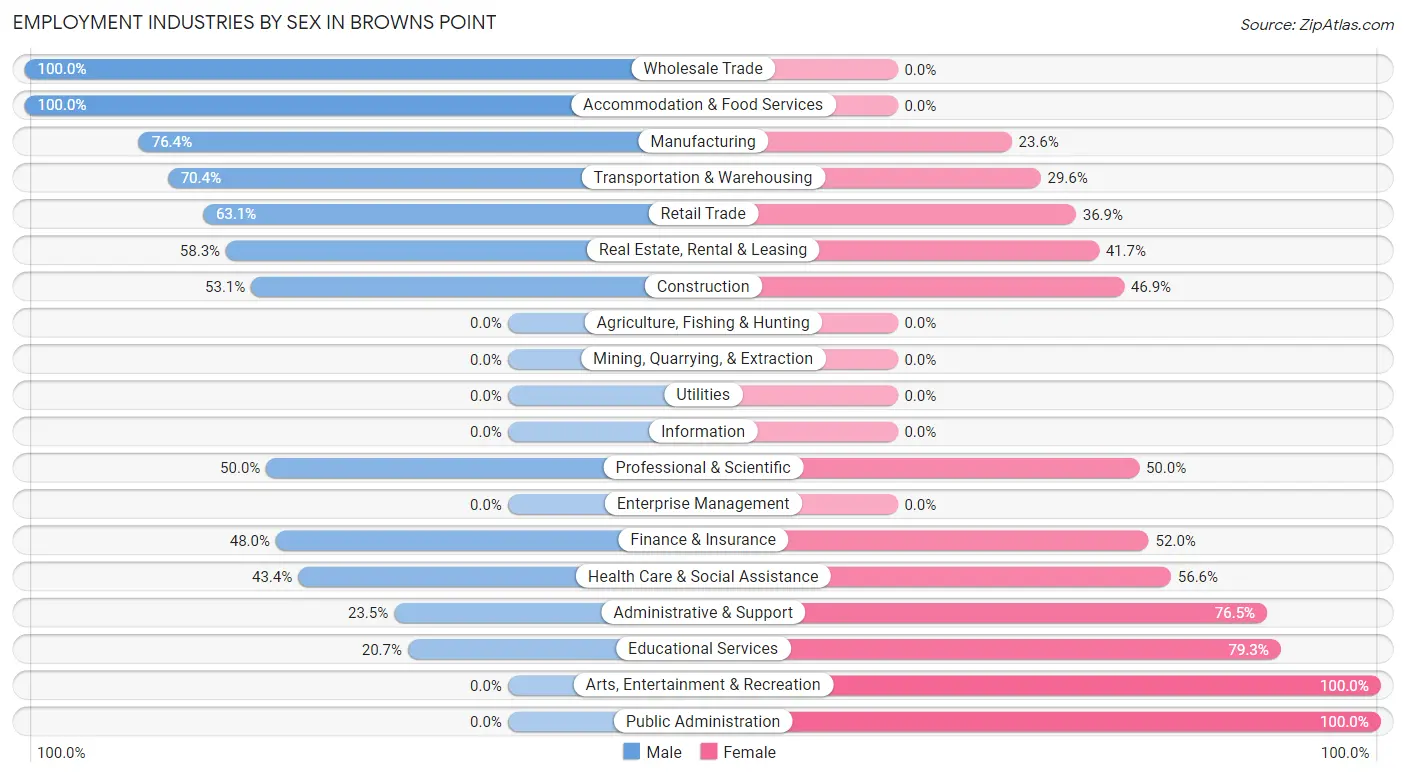
Employment Industries by Sex in Browns Point
The Browns Point industries that see more men than women are Wholesale Trade (100.0%), Accommodation & Food Services (100.0%), and Manufacturing (76.4%), whereas the industries that tend to have a higher number of women are Arts, Entertainment & Recreation (100.0%), Public Administration (100.0%), and Educational Services (79.3%).
| Industry | Male | Female |
| Agriculture, Fishing & Hunting | 0 (0.0%) | 0 (0.0%) |
| Mining, Quarrying, & Extraction | 0 (0.0%) | 0 (0.0%) |
| Construction | 17 (53.1%) | 15 (46.9%) |
| Manufacturing | 42 (76.4%) | 13 (23.6%) |
| Wholesale Trade | 8 (100.0%) | 0 (0.0%) |
| Retail Trade | 41 (63.1%) | 24 (36.9%) |
| Transportation & Warehousing | 57 (70.4%) | 24 (29.6%) |
| Utilities | 0 (0.0%) | 0 (0.0%) |
| Information | 0 (0.0%) | 0 (0.0%) |
| Finance & Insurance | 12 (48.0%) | 13 (52.0%) |
| Real Estate, Rental & Leasing | 14 (58.3%) | 10 (41.7%) |
| Professional & Scientific | 7 (50.0%) | 7 (50.0%) |
| Enterprise Management | 0 (0.0%) | 0 (0.0%) |
| Administrative & Support | 4 (23.5%) | 13 (76.5%) |
| Educational Services | 6 (20.7%) | 23 (79.3%) |
| Health Care & Social Assistance | 23 (43.4%) | 30 (56.6%) |
| Arts, Entertainment & Recreation | 0 (0.0%) | 30 (100.0%) |
| Accommodation & Food Services | 4 (100.0%) | 0 (0.0%) |
| Public Administration | 0 (0.0%) | 5 (100.0%) |
| Total | 251 (54.8%) | 207 (45.2%) |
Education in Browns Point
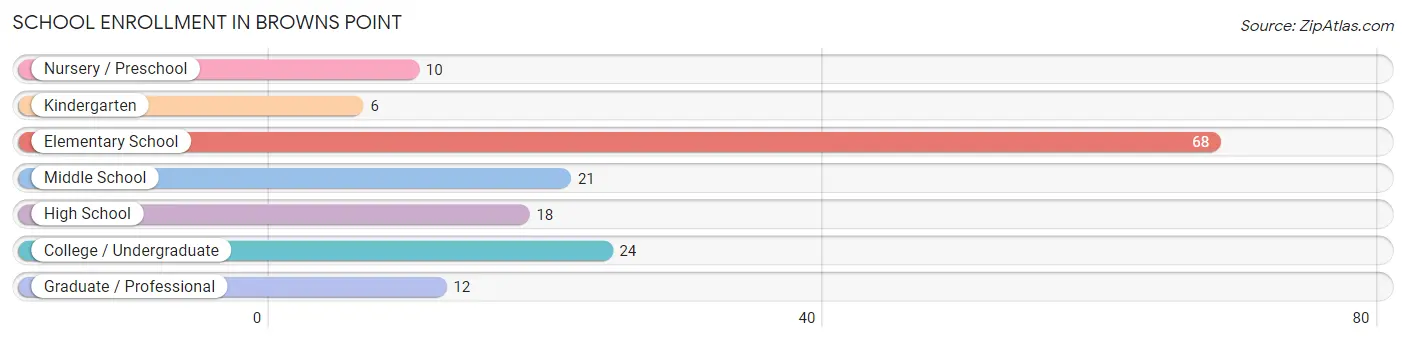
School Enrollment in Browns Point
The most common levels of schooling among the 159 students in Browns Point are elementary school (68 | 42.8%), college / undergraduate (24 | 15.1%), and middle school (21 | 13.2%).
| School Level | # Students | % Students |
| Nursery / Preschool | 10 | 6.3% |
| Kindergarten | 6 | 3.8% |
| Elementary School | 68 | 42.8% |
| Middle School | 21 | 13.2% |
| High School | 18 | 11.3% |
| College / Undergraduate | 24 | 15.1% |
| Graduate / Professional | 12 | 7.5% |
| Total | 159 | 100.0% |
School Enrollment by Age by Funding Source in Browns Point
Out of a total of 159 students who are enrolled in schools in Browns Point, 54 (34.0%) attend a private institution, while the remaining 105 (66.0%) are enrolled in public schools. The age group of 3 to 4 year olds has the highest likelihood of being enrolled in private schools, with 10 (100.0% in the age bracket) enrolled. Conversely, the age group of 18 to 19 year olds has the lowest likelihood of being enrolled in a private school, with 9 (100.0% in the age bracket) attending a public institution.
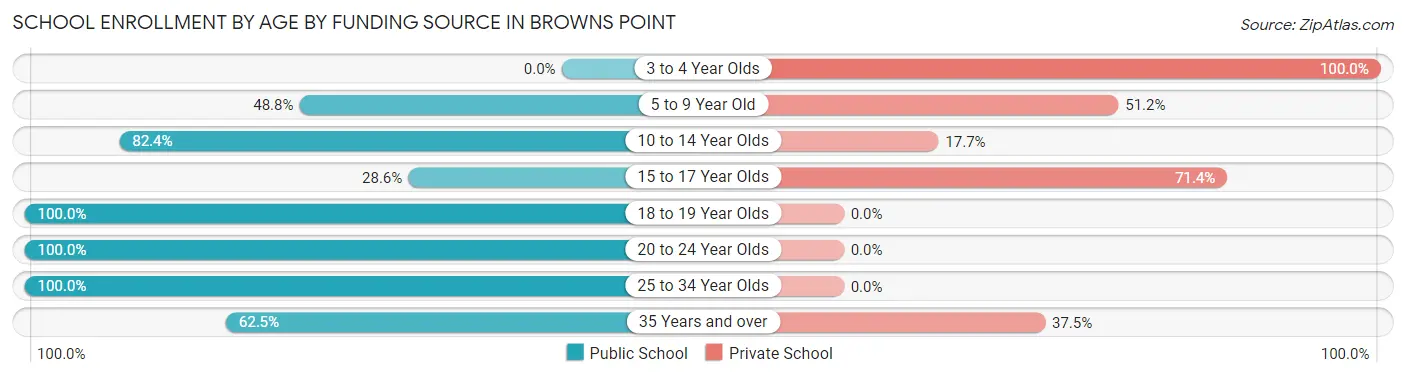
| Age Bracket | Public School | Private School |
| 3 to 4 Year Olds | 0 (0.0%) | 10 (100.0%) |
| 5 to 9 Year Old | 21 (48.8%) | 22 (51.2%) |
| 10 to 14 Year Olds | 42 (82.4%) | 9 (17.6%) |
| 15 to 17 Year Olds | 4 (28.6%) | 10 (71.4%) |
| 18 to 19 Year Olds | 9 (100.0%) | 0 (0.0%) |
| 20 to 24 Year Olds | 12 (100.0%) | 0 (0.0%) |
| 25 to 34 Year Olds | 12 (100.0%) | 0 (0.0%) |
| 35 Years and over | 5 (62.5%) | 3 (37.5%) |
| Total | 105 (66.0%) | 54 (34.0%) |
Educational Attainment by Field of Study in Browns Point
Social sciences (74 | 17.4%), business (72 | 17.0%), bio, nature & agricultural (38 | 9.0%), education (35 | 8.3%), and literature & languages (33 | 7.8%) are the most common fields of study among 424 individuals in Browns Point who have obtained a bachelor's degree or higher.
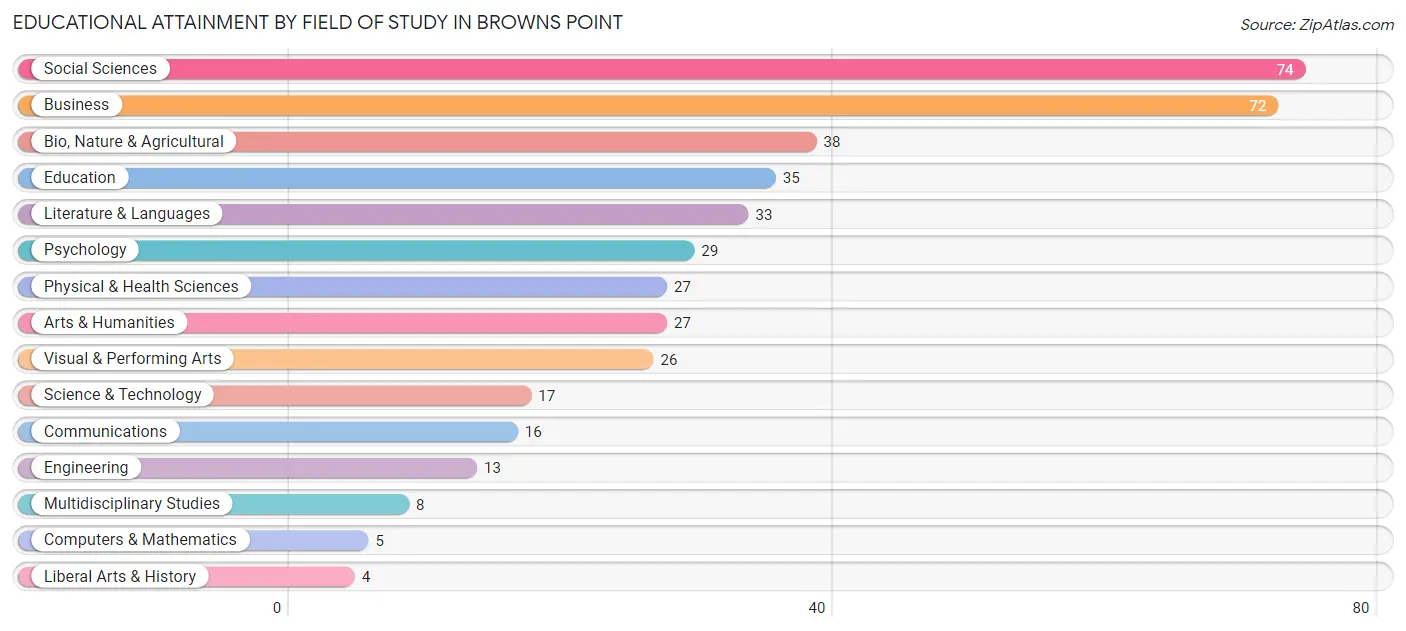
| Field of Study | # Graduates | % Graduates |
| Computers & Mathematics | 5 | 1.2% |
| Bio, Nature & Agricultural | 38 | 9.0% |
| Physical & Health Sciences | 27 | 6.4% |
| Psychology | 29 | 6.8% |
| Social Sciences | 74 | 17.4% |
| Engineering | 13 | 3.1% |
| Multidisciplinary Studies | 8 | 1.9% |
| Science & Technology | 17 | 4.0% |
| Business | 72 | 17.0% |
| Education | 35 | 8.3% |
| Literature & Languages | 33 | 7.8% |
| Liberal Arts & History | 4 | 0.9% |
| Visual & Performing Arts | 26 | 6.1% |
| Communications | 16 | 3.8% |
| Arts & Humanities | 27 | 6.4% |
| Total | 424 | 100.0% |
Transportation & Commute in Browns Point
Vehicle Availability by Sex in Browns Point
The most prevalent vehicle ownership categories in Browns Point are males with 2 vehicles (96, accounting for 38.3%) and females with 2 vehicles (44, making up 46.4%).
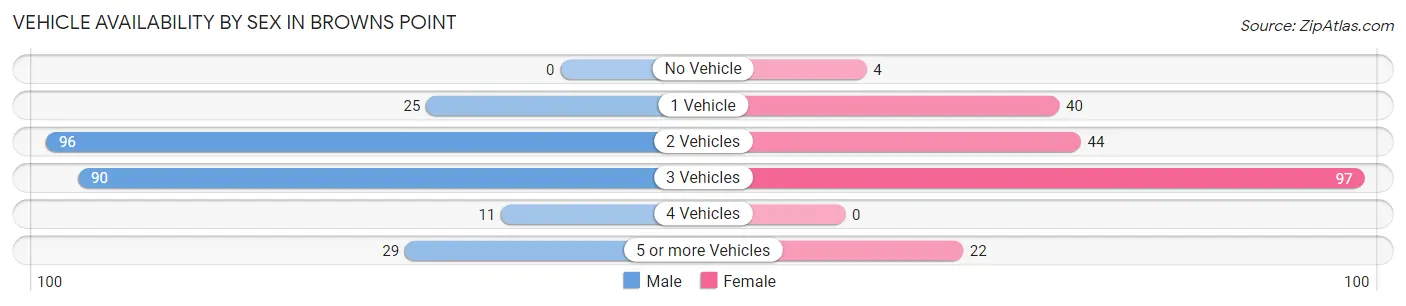
| Vehicles Available | Male | Female |
| No Vehicle | 0 (0.0%) | 4 (1.9%) |
| 1 Vehicle | 25 (10.0%) | 40 (19.3%) |
| 2 Vehicles | 96 (38.3%) | 44 (21.3%) |
| 3 Vehicles | 90 (35.9%) | 97 (46.9%) |
| 4 Vehicles | 11 (4.4%) | 0 (0.0%) |
| 5 or more Vehicles | 29 (11.6%) | 22 (10.6%) |
| Total | 251 (100.0%) | 207 (100.0%) |
Commute Time in Browns Point
The most frequently occuring commute durations in Browns Point are 30 to 34 minutes (72 commuters, 20.2%), 20 to 24 minutes (59 commuters, 16.6%), and 15 to 19 minutes (39 commuters, 11.0%).
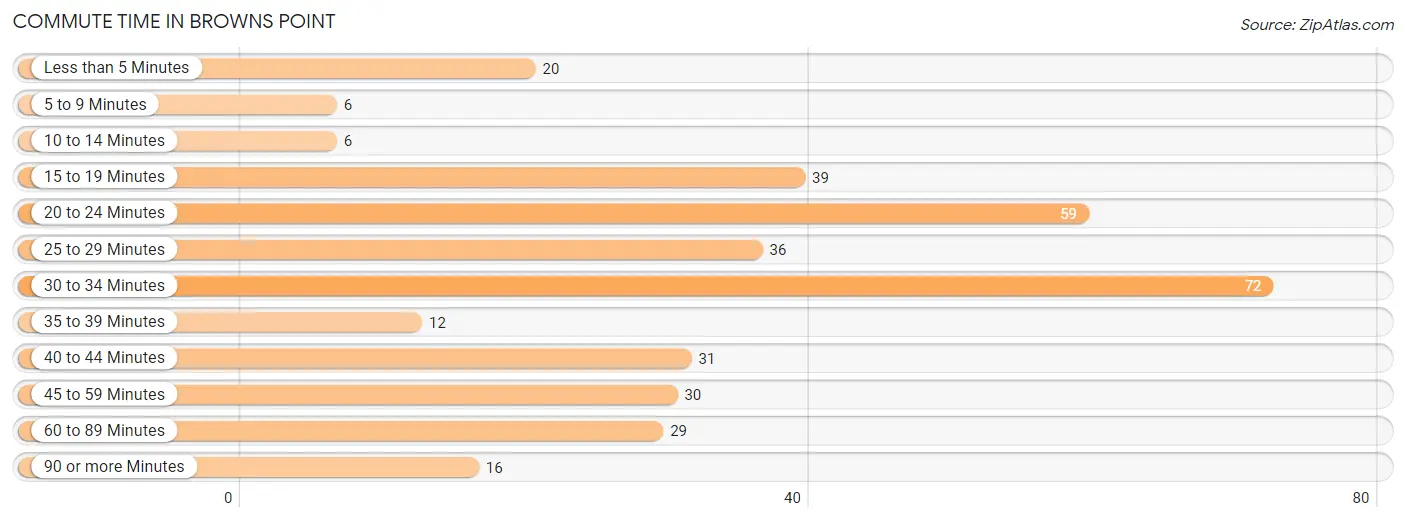
| Commute Time | # Commuters | % Commuters |
| Less than 5 Minutes | 20 | 5.6% |
| 5 to 9 Minutes | 6 | 1.7% |
| 10 to 14 Minutes | 6 | 1.7% |
| 15 to 19 Minutes | 39 | 11.0% |
| 20 to 24 Minutes | 59 | 16.6% |
| 25 to 29 Minutes | 36 | 10.1% |
| 30 to 34 Minutes | 72 | 20.2% |
| 35 to 39 Minutes | 12 | 3.4% |
| 40 to 44 Minutes | 31 | 8.7% |
| 45 to 59 Minutes | 30 | 8.4% |
| 60 to 89 Minutes | 29 | 8.2% |
| 90 or more Minutes | 16 | 4.5% |
Commute Time by Sex in Browns Point
The most common commute times in Browns Point are 30 to 34 minutes (51 commuters, 26.7%) for males and 20 to 24 minutes (41 commuters, 24.8%) for females.
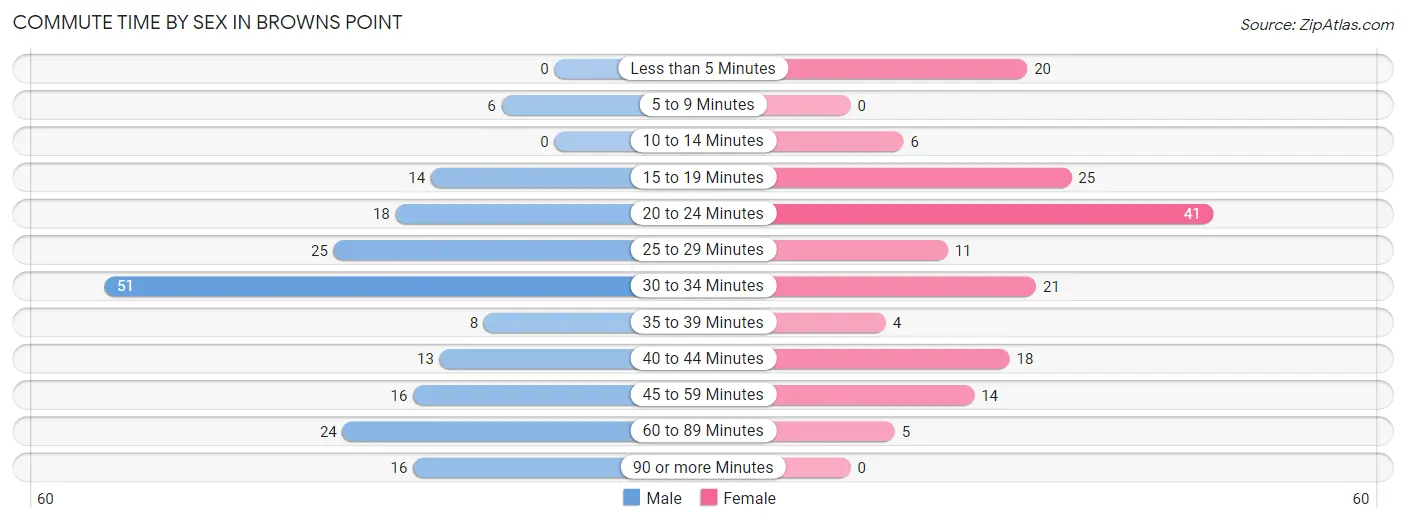
| Commute Time | Male | Female |
| Less than 5 Minutes | 0 (0.0%) | 20 (12.1%) |
| 5 to 9 Minutes | 6 (3.1%) | 0 (0.0%) |
| 10 to 14 Minutes | 0 (0.0%) | 6 (3.6%) |
| 15 to 19 Minutes | 14 (7.3%) | 25 (15.1%) |
| 20 to 24 Minutes | 18 (9.4%) | 41 (24.8%) |
| 25 to 29 Minutes | 25 (13.1%) | 11 (6.7%) |
| 30 to 34 Minutes | 51 (26.7%) | 21 (12.7%) |
| 35 to 39 Minutes | 8 (4.2%) | 4 (2.4%) |
| 40 to 44 Minutes | 13 (6.8%) | 18 (10.9%) |
| 45 to 59 Minutes | 16 (8.4%) | 14 (8.5%) |
| 60 to 89 Minutes | 24 (12.6%) | 5 (3.0%) |
| 90 or more Minutes | 16 (8.4%) | 0 (0.0%) |
Time of Departure to Work by Sex in Browns Point
The most frequent times of departure to work in Browns Point are 10:00 AM to 10:59 AM (38, 19.9%) for males and 7:30 AM to 7:59 AM (36, 21.8%) for females.
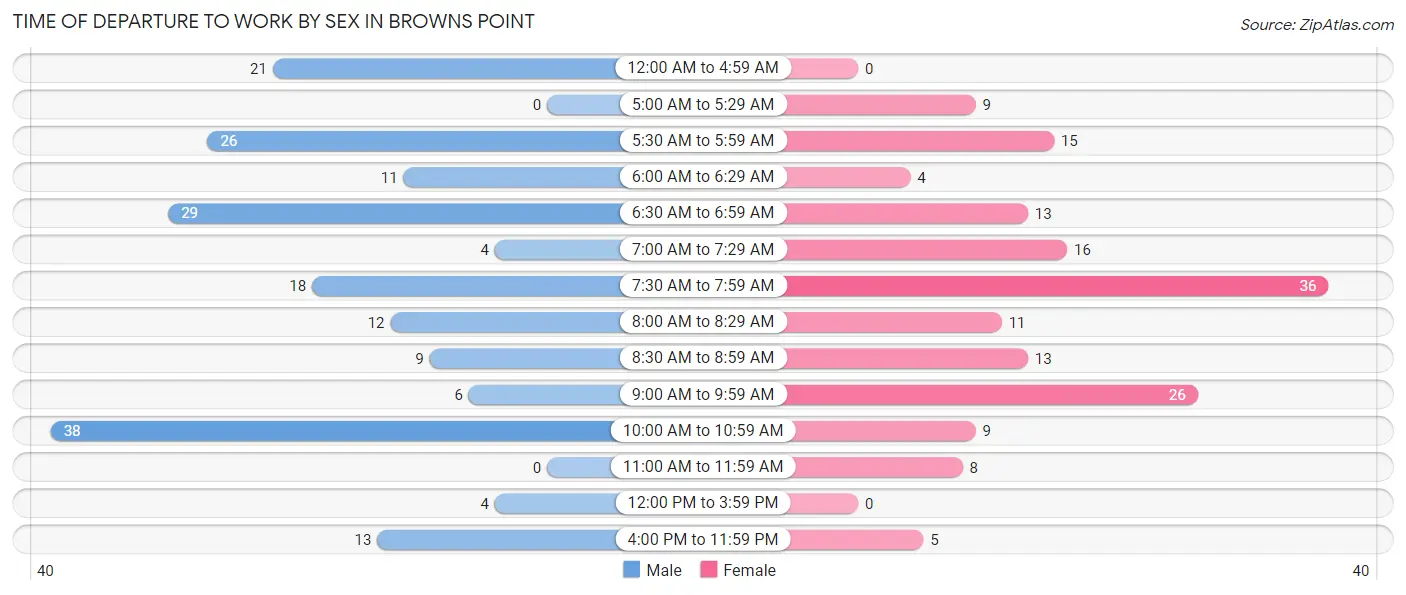
| Time of Departure | Male | Female |
| 12:00 AM to 4:59 AM | 21 (11.0%) | 0 (0.0%) |
| 5:00 AM to 5:29 AM | 0 (0.0%) | 9 (5.4%) |
| 5:30 AM to 5:59 AM | 26 (13.6%) | 15 (9.1%) |
| 6:00 AM to 6:29 AM | 11 (5.8%) | 4 (2.4%) |
| 6:30 AM to 6:59 AM | 29 (15.2%) | 13 (7.9%) |
| 7:00 AM to 7:29 AM | 4 (2.1%) | 16 (9.7%) |
| 7:30 AM to 7:59 AM | 18 (9.4%) | 36 (21.8%) |
| 8:00 AM to 8:29 AM | 12 (6.3%) | 11 (6.7%) |
| 8:30 AM to 8:59 AM | 9 (4.7%) | 13 (7.9%) |
| 9:00 AM to 9:59 AM | 6 (3.1%) | 26 (15.8%) |
| 10:00 AM to 10:59 AM | 38 (19.9%) | 9 (5.4%) |
| 11:00 AM to 11:59 AM | 0 (0.0%) | 8 (4.9%) |
| 12:00 PM to 3:59 PM | 4 (2.1%) | 0 (0.0%) |
| 4:00 PM to 11:59 PM | 13 (6.8%) | 5 (3.0%) |
| Total | 191 (100.0%) | 165 (100.0%) |
Housing Occupancy in Browns Point
Occupancy by Ownership in Browns Point
Of the total 474 dwellings in Browns Point, owner-occupied units account for 340 (71.7%), while renter-occupied units make up 134 (28.3%).
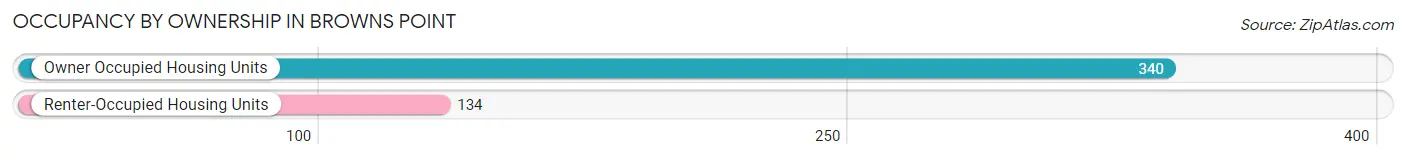
| Occupancy | # Housing Units | % Housing Units |
| Owner Occupied Housing Units | 340 | 71.7% |
| Renter-Occupied Housing Units | 134 | 28.3% |
| Total Occupied Housing Units | 474 | 100.0% |
Occupancy by Household Size in Browns Point
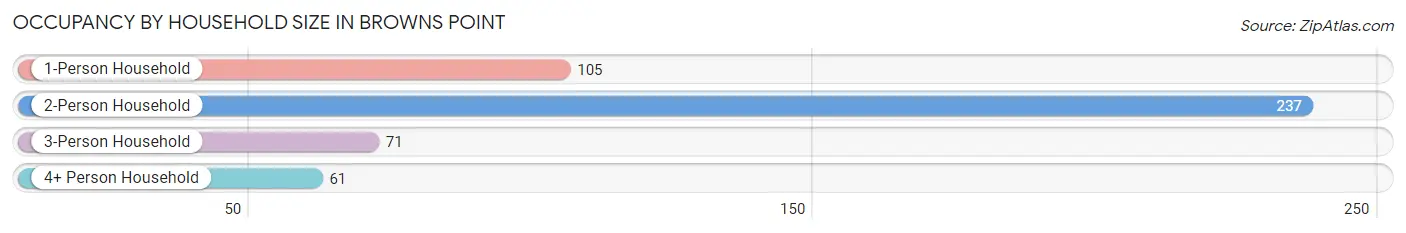
| Household Size | # Housing Units | % Housing Units |
| 1-Person Household | 105 | 22.2% |
| 2-Person Household | 237 | 50.0% |
| 3-Person Household | 71 | 15.0% |
| 4+ Person Household | 61 | 12.9% |
| Total Housing Units | 474 | 100.0% |
Occupancy by Ownership by Household Size in Browns Point
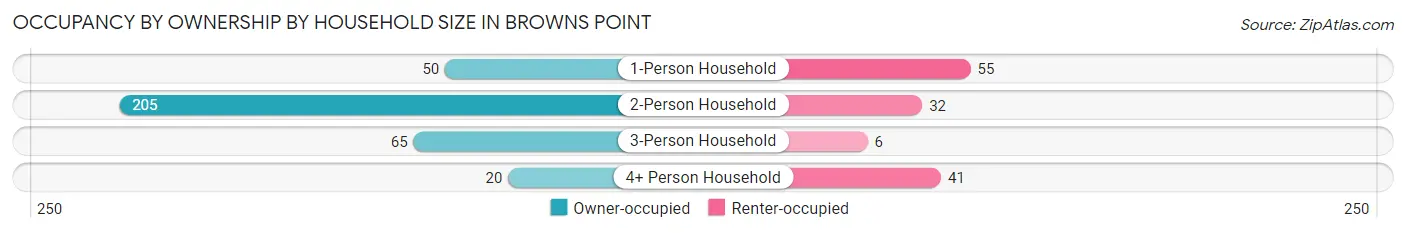
| Household Size | Owner-occupied | Renter-occupied |
| 1-Person Household | 50 (47.6%) | 55 (52.4%) |
| 2-Person Household | 205 (86.5%) | 32 (13.5%) |
| 3-Person Household | 65 (91.5%) | 6 (8.5%) |
| 4+ Person Household | 20 (32.8%) | 41 (67.2%) |
| Total Housing Units | 340 (71.7%) | 134 (28.3%) |
Occupancy by Educational Attainment in Browns Point
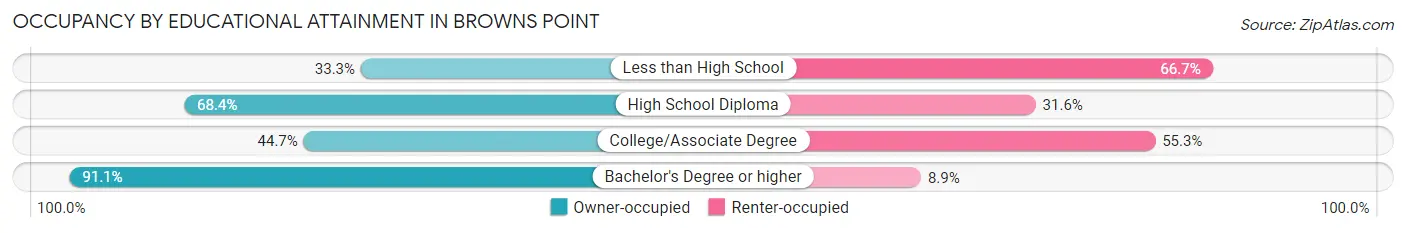
| Household Size | Owner-occupied | Renter-occupied |
| Less than High School | 10 (33.3%) | 20 (66.7%) |
| High School Diploma | 93 (68.4%) | 43 (31.6%) |
| College/Associate Degree | 42 (44.7%) | 52 (55.3%) |
| Bachelor's Degree or higher | 195 (91.1%) | 19 (8.9%) |
Occupancy by Age of Householder in Browns Point
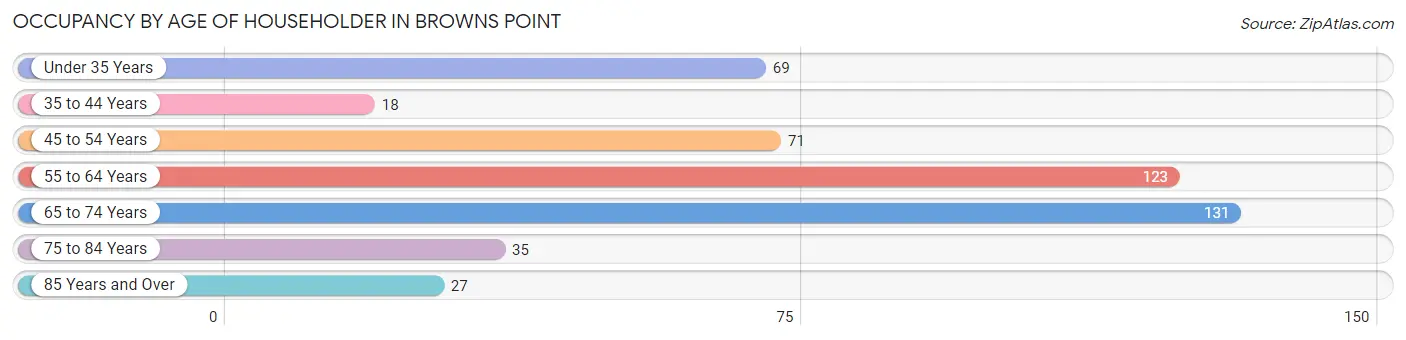
| Age Bracket | # Households | % Households |
| Under 35 Years | 69 | 14.6% |
| 35 to 44 Years | 18 | 3.8% |
| 45 to 54 Years | 71 | 15.0% |
| 55 to 64 Years | 123 | 26.0% |
| 65 to 74 Years | 131 | 27.6% |
| 75 to 84 Years | 35 | 7.4% |
| 85 Years and Over | 27 | 5.7% |
| Total | 474 | 100.0% |
Housing Finances in Browns Point
Median Income by Occupancy in Browns Point
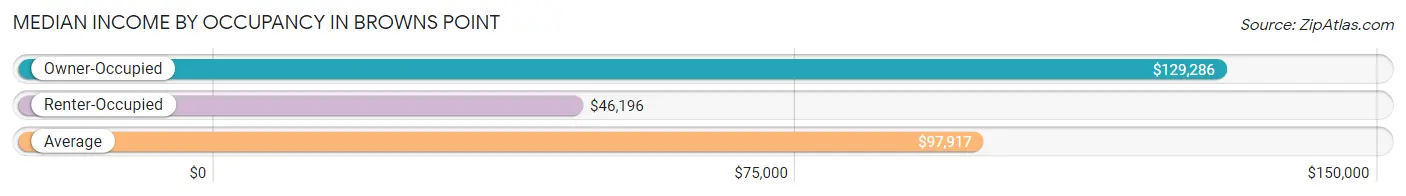
| Occupancy Type | # Households | Median Income |
| Owner-Occupied | 340 (71.7%) | $129,286 |
| Renter-Occupied | 134 (28.3%) | $46,196 |
| Average | 474 (100.0%) | $97,917 |
Occupancy by Householder Income Bracket in Browns Point
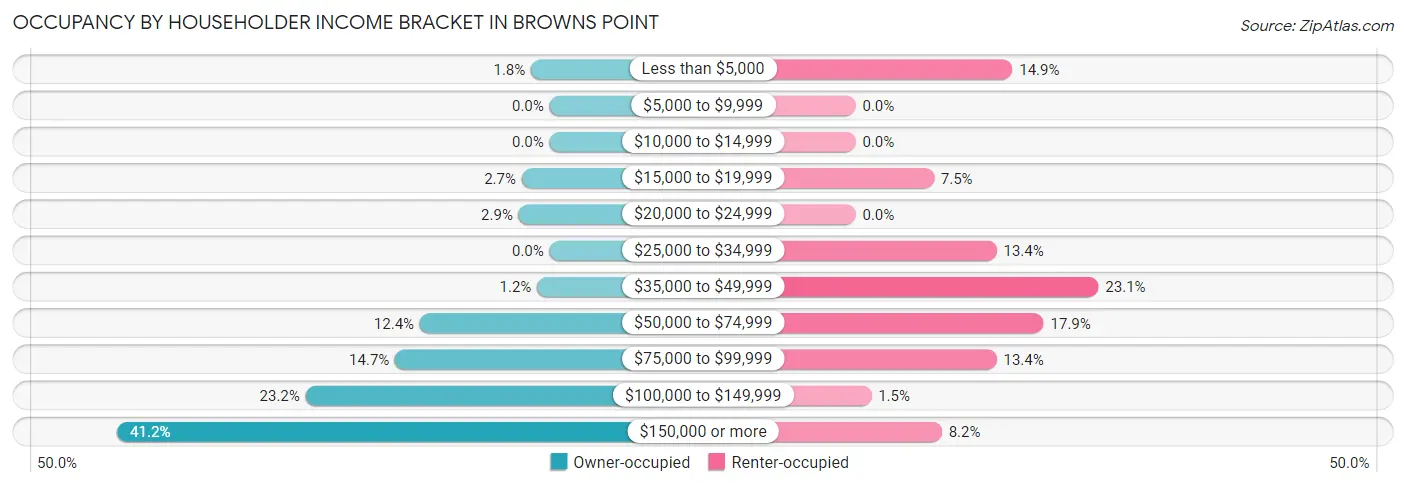
| Income Bracket | Owner-occupied | Renter-occupied |
| Less than $5,000 | 6 (1.8%) | 20 (14.9%) |
| $5,000 to $9,999 | 0 (0.0%) | 0 (0.0%) |
| $10,000 to $14,999 | 0 (0.0%) | 0 (0.0%) |
| $15,000 to $19,999 | 9 (2.6%) | 10 (7.5%) |
| $20,000 to $24,999 | 10 (2.9%) | 0 (0.0%) |
| $25,000 to $34,999 | 0 (0.0%) | 18 (13.4%) |
| $35,000 to $49,999 | 4 (1.2%) | 31 (23.1%) |
| $50,000 to $74,999 | 42 (12.3%) | 24 (17.9%) |
| $75,000 to $99,999 | 50 (14.7%) | 18 (13.4%) |
| $100,000 to $149,999 | 79 (23.2%) | 2 (1.5%) |
| $150,000 or more | 140 (41.2%) | 11 (8.2%) |
| Total | 340 (100.0%) | 134 (100.0%) |
Monthly Housing Cost Tiers in Browns Point
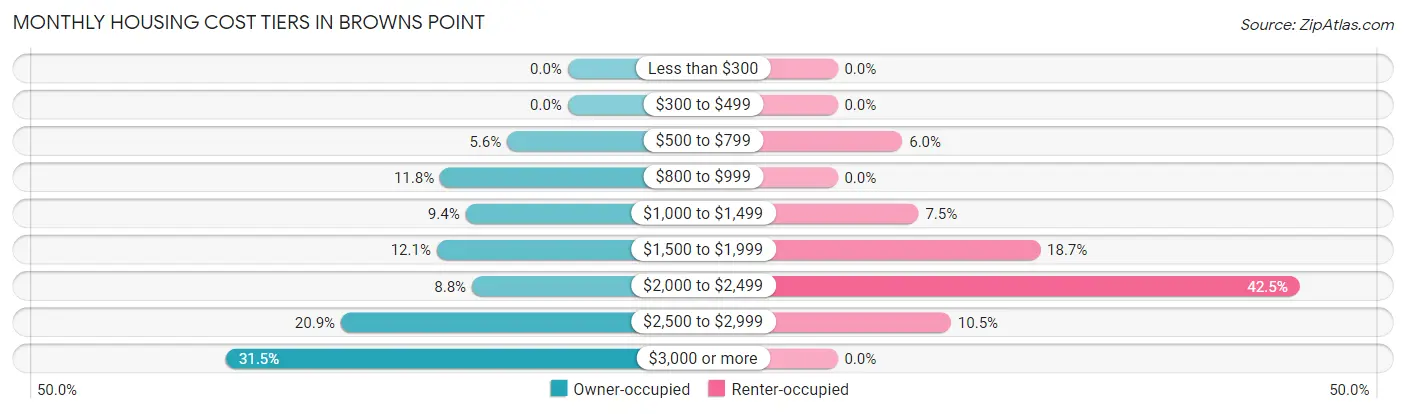
| Monthly Cost | Owner-occupied | Renter-occupied |
| Less than $300 | 0 (0.0%) | 0 (0.0%) |
| $300 to $499 | 0 (0.0%) | 0 (0.0%) |
| $500 to $799 | 19 (5.6%) | 8 (6.0%) |
| $800 to $999 | 40 (11.8%) | 0 (0.0%) |
| $1,000 to $1,499 | 32 (9.4%) | 10 (7.5%) |
| $1,500 to $1,999 | 41 (12.1%) | 25 (18.7%) |
| $2,000 to $2,499 | 30 (8.8%) | 57 (42.5%) |
| $2,500 to $2,999 | 71 (20.9%) | 14 (10.4%) |
| $3,000 or more | 107 (31.5%) | 0 (0.0%) |
| Total | 340 (100.0%) | 134 (100.0%) |
Physical Housing Characteristics in Browns Point
Housing Structures in Browns Point
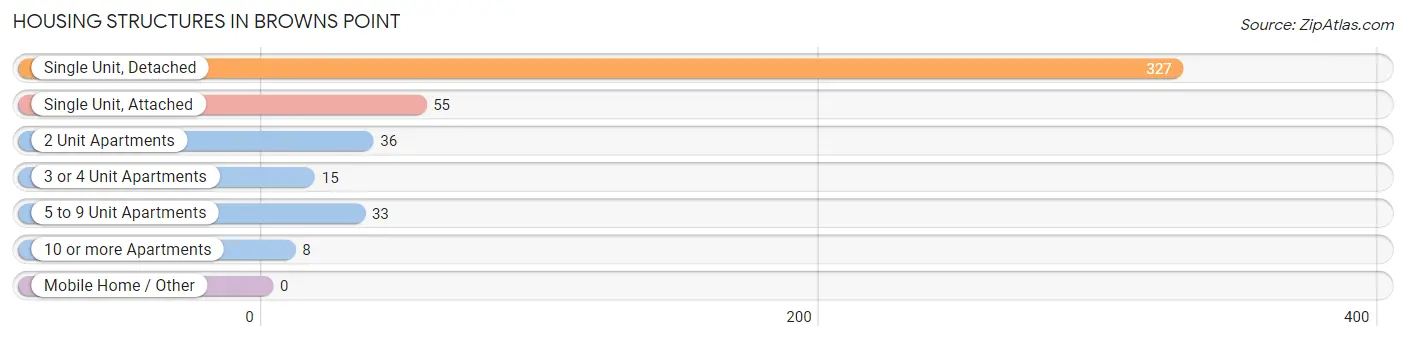
| Structure Type | # Housing Units | % Housing Units |
| Single Unit, Detached | 327 | 69.0% |
| Single Unit, Attached | 55 | 11.6% |
| 2 Unit Apartments | 36 | 7.6% |
| 3 or 4 Unit Apartments | 15 | 3.2% |
| 5 to 9 Unit Apartments | 33 | 7.0% |
| 10 or more Apartments | 8 | 1.7% |
| Mobile Home / Other | 0 | 0.0% |
| Total | 474 | 100.0% |
Housing Structures by Occupancy in Browns Point
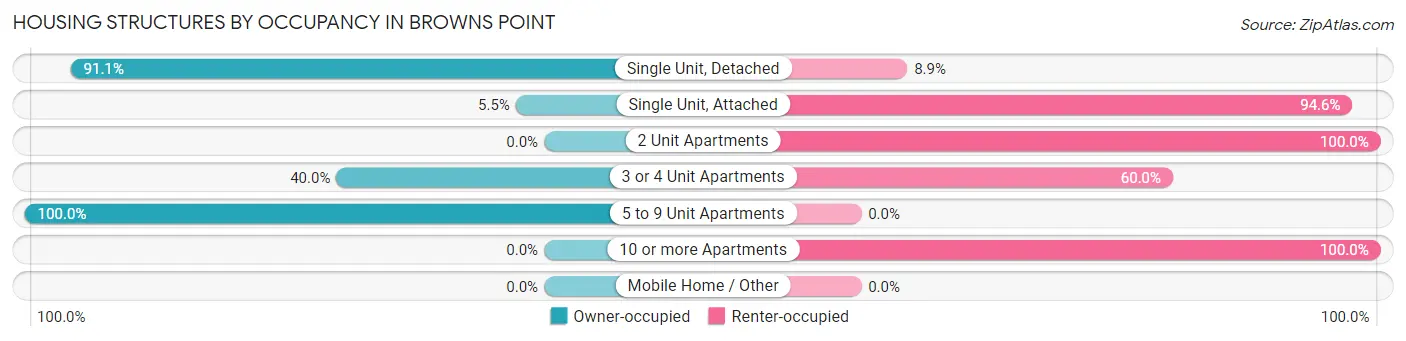
| Structure Type | Owner-occupied | Renter-occupied |
| Single Unit, Detached | 298 (91.1%) | 29 (8.9%) |
| Single Unit, Attached | 3 (5.4%) | 52 (94.6%) |
| 2 Unit Apartments | 0 (0.0%) | 36 (100.0%) |
| 3 or 4 Unit Apartments | 6 (40.0%) | 9 (60.0%) |
| 5 to 9 Unit Apartments | 33 (100.0%) | 0 (0.0%) |
| 10 or more Apartments | 0 (0.0%) | 8 (100.0%) |
| Mobile Home / Other | 0 (0.0%) | 0 (0.0%) |
| Total | 340 (71.7%) | 134 (28.3%) |
Housing Structures by Number of Rooms in Browns Point
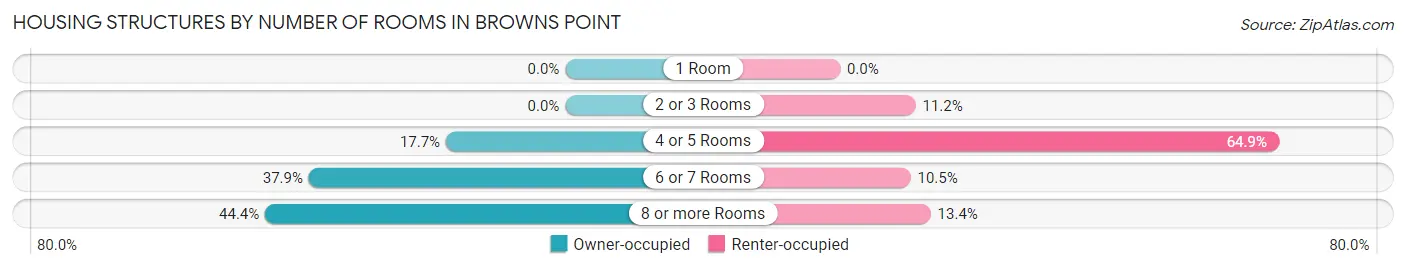
| Number of Rooms | Owner-occupied | Renter-occupied |
| 1 Room | 0 (0.0%) | 0 (0.0%) |
| 2 or 3 Rooms | 0 (0.0%) | 15 (11.2%) |
| 4 or 5 Rooms | 60 (17.6%) | 87 (64.9%) |
| 6 or 7 Rooms | 129 (37.9%) | 14 (10.4%) |
| 8 or more Rooms | 151 (44.4%) | 18 (13.4%) |
| Total | 340 (100.0%) | 134 (100.0%) |
Housing Structure by Heating Type in Browns Point
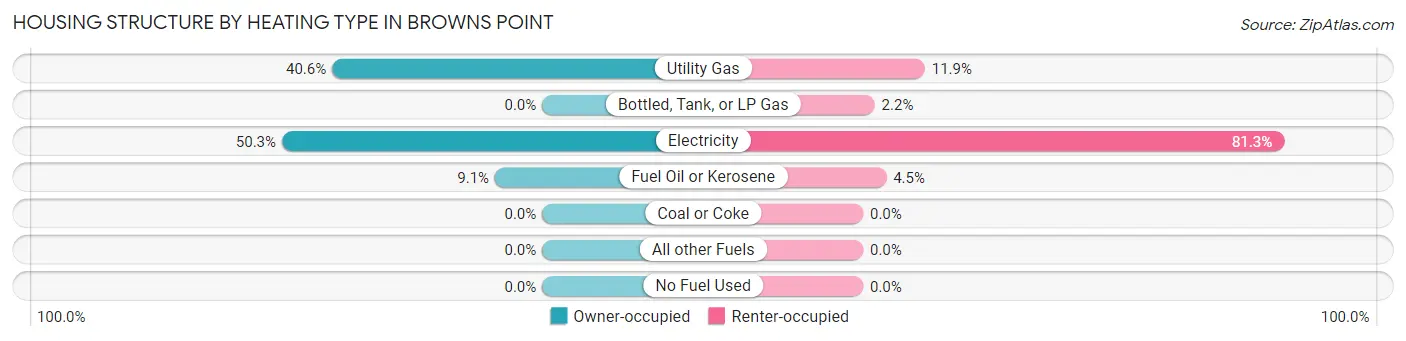
| Heating Type | Owner-occupied | Renter-occupied |
| Utility Gas | 138 (40.6%) | 16 (11.9%) |
| Bottled, Tank, or LP Gas | 0 (0.0%) | 3 (2.2%) |
| Electricity | 171 (50.3%) | 109 (81.3%) |
| Fuel Oil or Kerosene | 31 (9.1%) | 6 (4.5%) |
| Coal or Coke | 0 (0.0%) | 0 (0.0%) |
| All other Fuels | 0 (0.0%) | 0 (0.0%) |
| No Fuel Used | 0 (0.0%) | 0 (0.0%) |
| Total | 340 (100.0%) | 134 (100.0%) |
Household Vehicle Usage in Browns Point
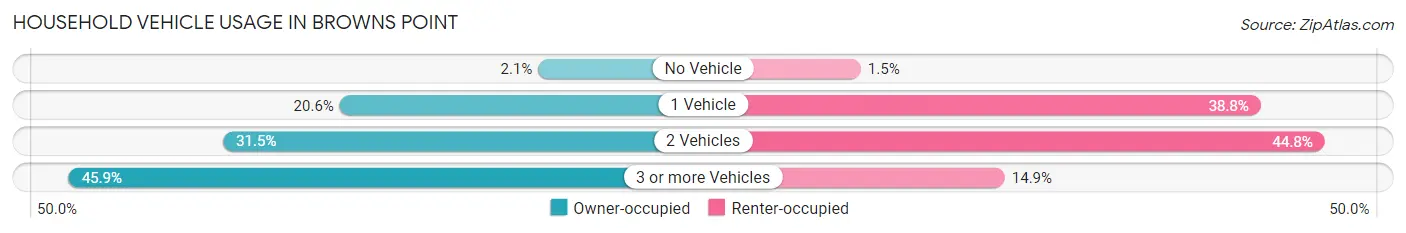
| Vehicles per Household | Owner-occupied | Renter-occupied |
| No Vehicle | 7 (2.1%) | 2 (1.5%) |
| 1 Vehicle | 70 (20.6%) | 52 (38.8%) |
| 2 Vehicles | 107 (31.5%) | 60 (44.8%) |
| 3 or more Vehicles | 156 (45.9%) | 20 (14.9%) |
| Total | 340 (100.0%) | 134 (100.0%) |
Real Estate & Mortgages in Browns Point
Real Estate and Mortgage Overview in Browns Point
| Characteristic | Without Mortgage | With Mortgage |
| Housing Units | 112 | 228 |
| Median Property Value | $635,100 | $756,800 |
| Median Household Income | $111,250 | $92 |
| Monthly Housing Costs | $987 | $107 |
| Real Estate Taxes | $8,043 | $0 |
Property Value by Mortgage Status in Browns Point
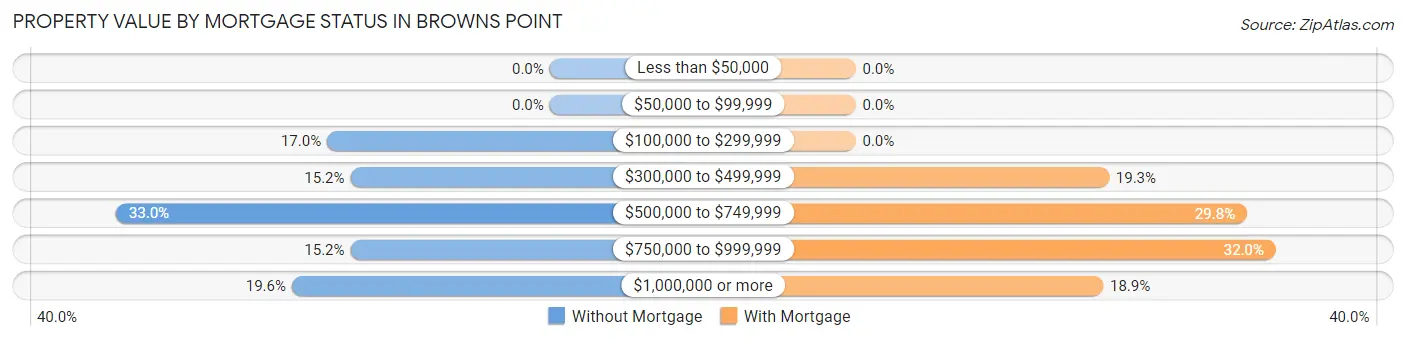
| Property Value | Without Mortgage | With Mortgage |
| Less than $50,000 | 0 (0.0%) | 0 (0.0%) |
| $50,000 to $99,999 | 0 (0.0%) | 0 (0.0%) |
| $100,000 to $299,999 | 19 (17.0%) | 0 (0.0%) |
| $300,000 to $499,999 | 17 (15.2%) | 44 (19.3%) |
| $500,000 to $749,999 | 37 (33.0%) | 68 (29.8%) |
| $750,000 to $999,999 | 17 (15.2%) | 73 (32.0%) |
| $1,000,000 or more | 22 (19.6%) | 43 (18.9%) |
| Total | 112 (100.0%) | 228 (100.0%) |
Household Income by Mortgage Status in Browns Point
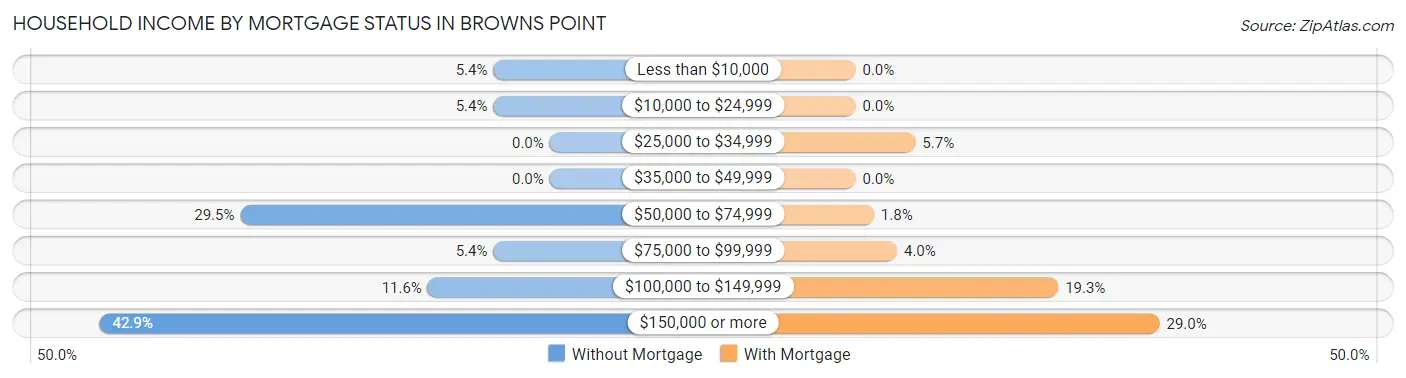
| Household Income | Without Mortgage | With Mortgage |
| Less than $10,000 | 6 (5.4%) | 0 (0.0%) |
| $10,000 to $24,999 | 6 (5.4%) | 0 (0.0%) |
| $25,000 to $34,999 | 0 (0.0%) | 13 (5.7%) |
| $35,000 to $49,999 | 0 (0.0%) | 0 (0.0%) |
| $50,000 to $74,999 | 33 (29.5%) | 4 (1.8%) |
| $75,000 to $99,999 | 6 (5.4%) | 9 (4.0%) |
| $100,000 to $149,999 | 13 (11.6%) | 44 (19.3%) |
| $150,000 or more | 48 (42.9%) | 66 (28.9%) |
| Total | 112 (100.0%) | 228 (100.0%) |
Property Value to Household Income Ratio in Browns Point
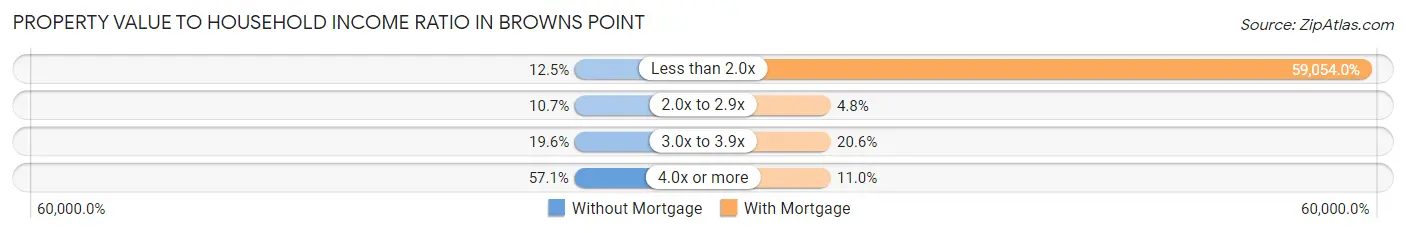
| Value-to-Income Ratio | Without Mortgage | With Mortgage |
| Less than 2.0x | 14 (12.5%) | 134,643 (59,053.9%) |
| 2.0x to 2.9x | 12 (10.7%) | 11 (4.8%) |
| 3.0x to 3.9x | 22 (19.6%) | 47 (20.6%) |
| 4.0x or more | 64 (57.1%) | 25 (11.0%) |
| Total | 112 (100.0%) | 228 (100.0%) |
Real Estate Taxes by Mortgage Status in Browns Point
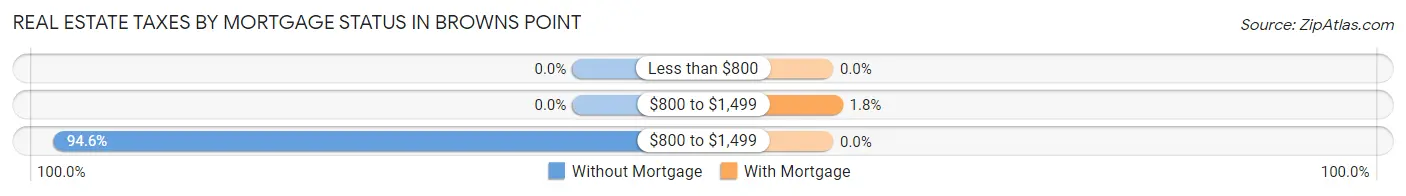
| Property Taxes | Without Mortgage | With Mortgage |
| Less than $800 | 0 (0.0%) | 0 (0.0%) |
| $800 to $1,499 | 0 (0.0%) | 4 (1.8%) |
| $800 to $1,499 | 106 (94.6%) | 0 (0.0%) |
| Total | 112 (100.0%) | 228 (100.0%) |
Health & Disability in Browns Point
Health Insurance Coverage by Age in Browns Point
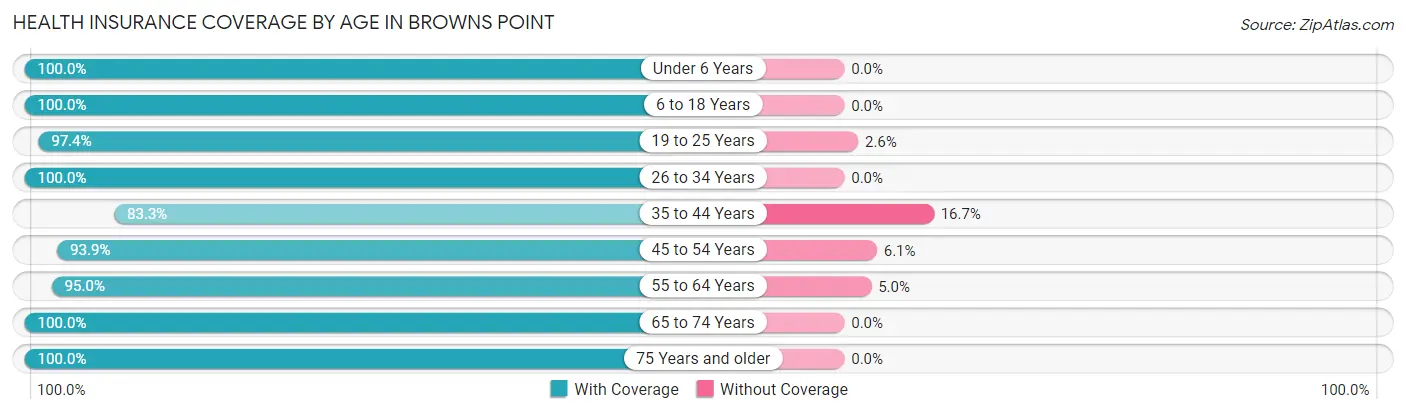
| Age Bracket | With Coverage | Without Coverage |
| Under 6 Years | 39 (100.0%) | 0 (0.0%) |
| 6 to 18 Years | 111 (100.0%) | 0 (0.0%) |
| 19 to 25 Years | 76 (97.4%) | 2 (2.6%) |
| 26 to 34 Years | 126 (100.0%) | 0 (0.0%) |
| 35 to 44 Years | 30 (83.3%) | 6 (16.7%) |
| 45 to 54 Years | 124 (93.9%) | 8 (6.1%) |
| 55 to 64 Years | 246 (95.0%) | 13 (5.0%) |
| 65 to 74 Years | 208 (100.0%) | 0 (0.0%) |
| 75 Years and older | 108 (100.0%) | 0 (0.0%) |
| Total | 1,068 (97.4%) | 29 (2.6%) |
Health Insurance Coverage by Citizenship Status in Browns Point
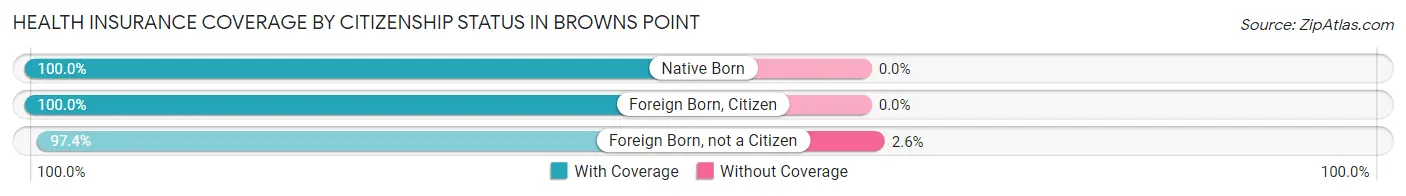
| Citizenship Status | With Coverage | Without Coverage |
| Native Born | 39 (100.0%) | 0 (0.0%) |
| Foreign Born, Citizen | 111 (100.0%) | 0 (0.0%) |
| Foreign Born, not a Citizen | 76 (97.4%) | 2 (2.6%) |
Health Insurance Coverage by Household Income in Browns Point
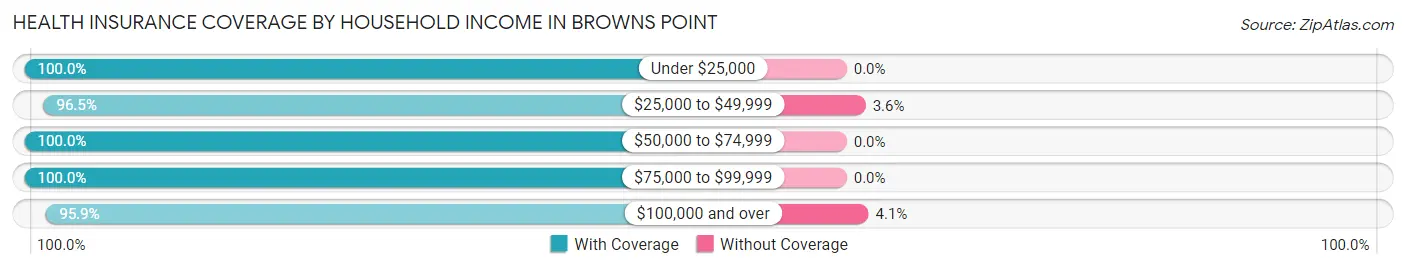
| Household Income | With Coverage | Without Coverage |
| Under $25,000 | 78 (100.0%) | 0 (0.0%) |
| $25,000 to $49,999 | 163 (96.5%) | 6 (3.5%) |
| $50,000 to $74,999 | 122 (100.0%) | 0 (0.0%) |
| $75,000 to $99,999 | 164 (100.0%) | 0 (0.0%) |
| $100,000 and over | 541 (95.9%) | 23 (4.1%) |
Public vs Private Health Insurance Coverage by Age in Browns Point
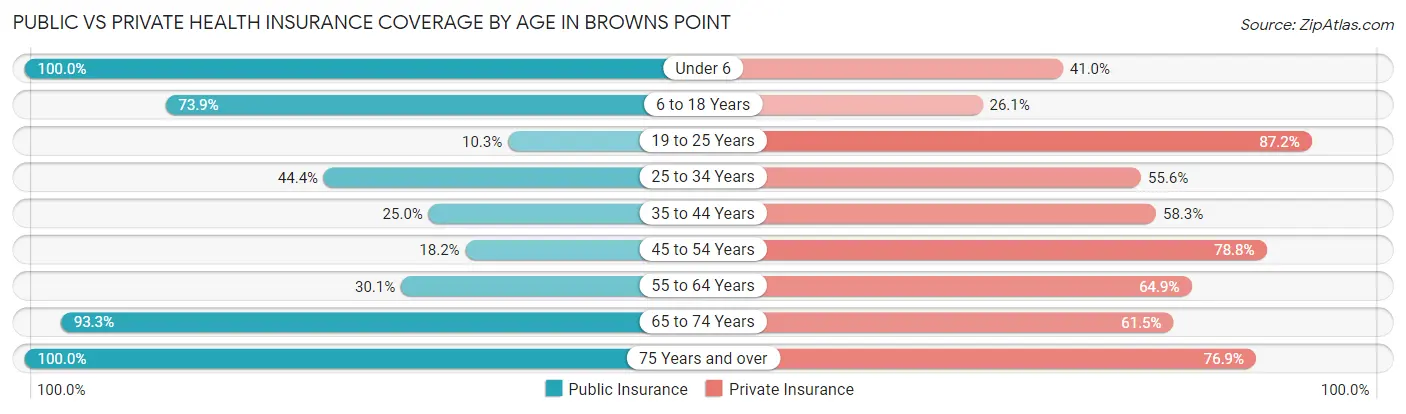
| Age Bracket | Public Insurance | Private Insurance |
| Under 6 | 39 (100.0%) | 16 (41.0%) |
| 6 to 18 Years | 82 (73.9%) | 29 (26.1%) |
| 19 to 25 Years | 8 (10.3%) | 68 (87.2%) |
| 25 to 34 Years | 56 (44.4%) | 70 (55.6%) |
| 35 to 44 Years | 9 (25.0%) | 21 (58.3%) |
| 45 to 54 Years | 24 (18.2%) | 104 (78.8%) |
| 55 to 64 Years | 78 (30.1%) | 168 (64.9%) |
| 65 to 74 Years | 194 (93.3%) | 128 (61.5%) |
| 75 Years and over | 108 (100.0%) | 83 (76.8%) |
| Total | 598 (54.5%) | 687 (62.6%) |
Disability Status by Sex by Age in Browns Point
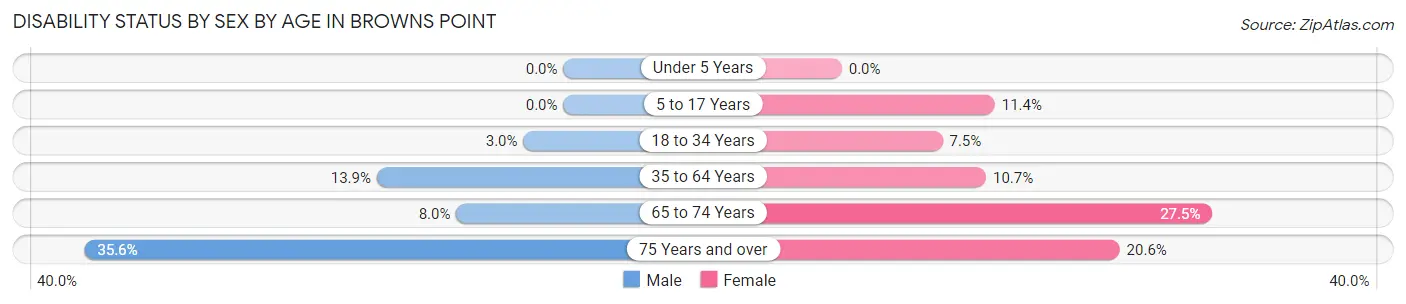
| Age Bracket | Male | Female |
| Under 5 Years | 0 (0.0%) | 0 (0.0%) |
| 5 to 17 Years | 0 (0.0%) | 5 (11.4%) |
| 18 to 34 Years | 3 (3.0%) | 8 (7.5%) |
| 35 to 64 Years | 32 (13.9%) | 21 (10.7%) |
| 65 to 74 Years | 7 (8.0%) | 33 (27.5%) |
| 75 Years and over | 16 (35.6%) | 13 (20.6%) |
Disability Class by Sex by Age in Browns Point
Disability Class: Hearing Difficulty
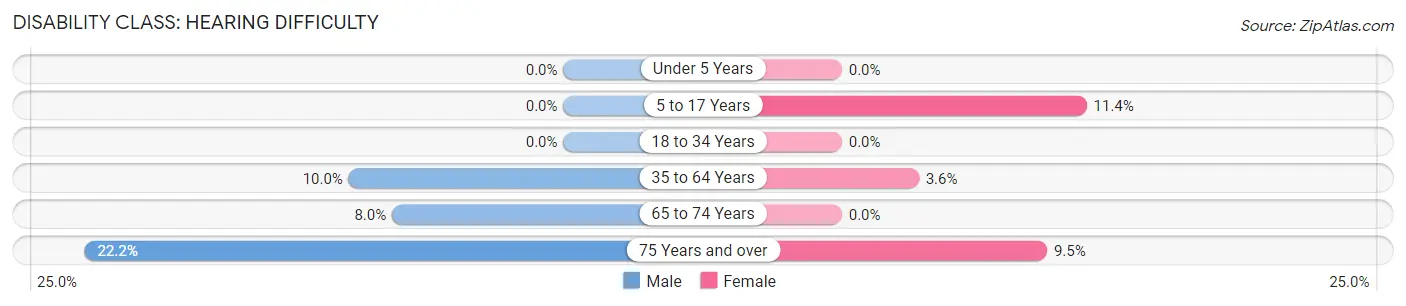
| Age Bracket | Male | Female |
| Under 5 Years | 0 (0.0%) | 0 (0.0%) |
| 5 to 17 Years | 0 (0.0%) | 5 (11.4%) |
| 18 to 34 Years | 0 (0.0%) | 0 (0.0%) |
| 35 to 64 Years | 23 (10.0%) | 7 (3.6%) |
| 65 to 74 Years | 7 (8.0%) | 0 (0.0%) |
| 75 Years and over | 10 (22.2%) | 6 (9.5%) |
Disability Class: Vision Difficulty
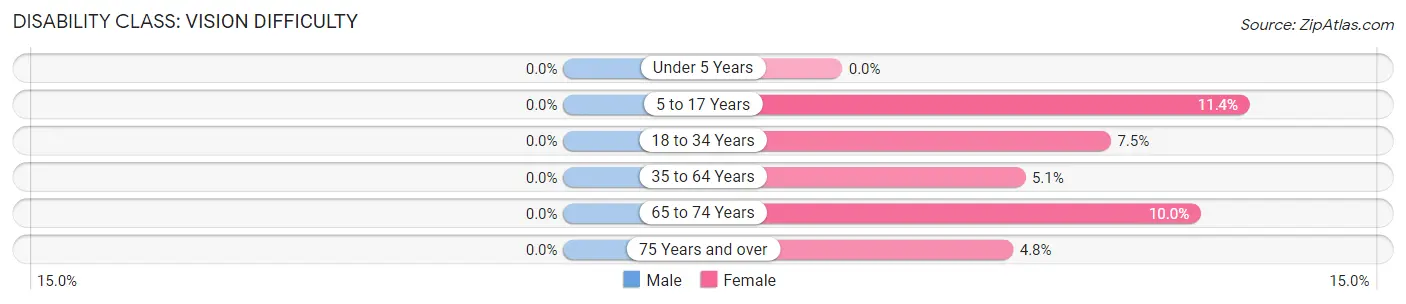
| Age Bracket | Male | Female |
| Under 5 Years | 0 (0.0%) | 0 (0.0%) |
| 5 to 17 Years | 0 (0.0%) | 5 (11.4%) |
| 18 to 34 Years | 0 (0.0%) | 8 (7.5%) |
| 35 to 64 Years | 0 (0.0%) | 10 (5.1%) |
| 65 to 74 Years | 0 (0.0%) | 12 (10.0%) |
| 75 Years and over | 0 (0.0%) | 3 (4.8%) |
Disability Class: Cognitive Difficulty
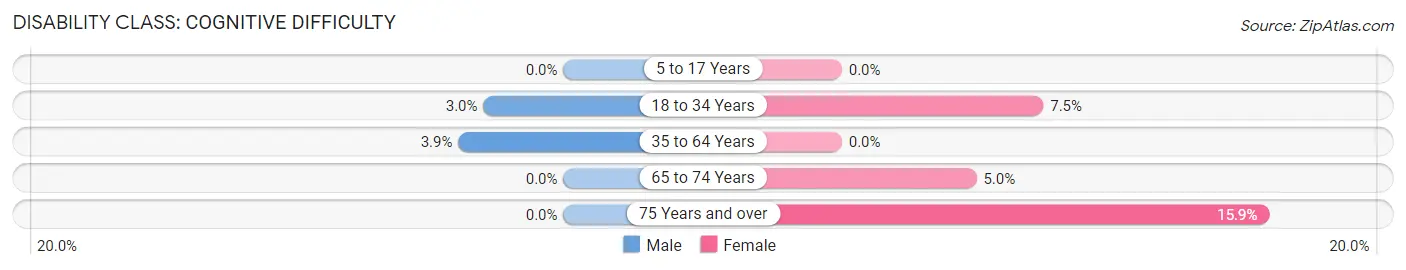
| Age Bracket | Male | Female |
| 5 to 17 Years | 0 (0.0%) | 0 (0.0%) |
| 18 to 34 Years | 3 (3.0%) | 8 (7.5%) |
| 35 to 64 Years | 9 (3.9%) | 0 (0.0%) |
| 65 to 74 Years | 0 (0.0%) | 6 (5.0%) |
| 75 Years and over | 0 (0.0%) | 10 (15.9%) |
Disability Class: Ambulatory Difficulty
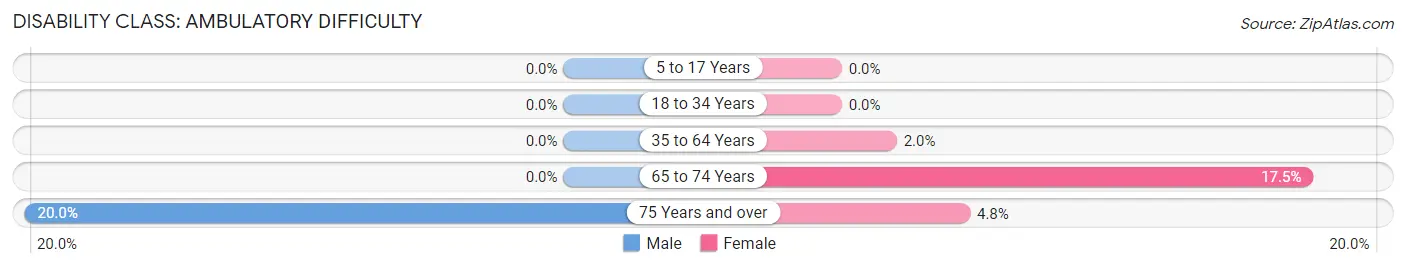
| Age Bracket | Male | Female |
| 5 to 17 Years | 0 (0.0%) | 0 (0.0%) |
| 18 to 34 Years | 0 (0.0%) | 0 (0.0%) |
| 35 to 64 Years | 0 (0.0%) | 4 (2.0%) |
| 65 to 74 Years | 0 (0.0%) | 21 (17.5%) |
| 75 Years and over | 9 (20.0%) | 3 (4.8%) |
Disability Class: Self-Care Difficulty
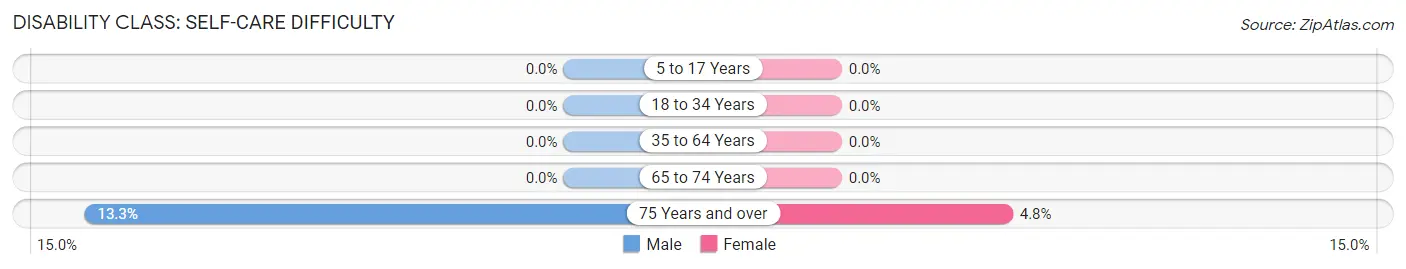
| Age Bracket | Male | Female |
| 5 to 17 Years | 0 (0.0%) | 0 (0.0%) |
| 18 to 34 Years | 0 (0.0%) | 0 (0.0%) |
| 35 to 64 Years | 0 (0.0%) | 0 (0.0%) |
| 65 to 74 Years | 0 (0.0%) | 0 (0.0%) |
| 75 Years and over | 6 (13.3%) | 3 (4.8%) |
Technology Access in Browns Point
Computing Device Access in Browns Point
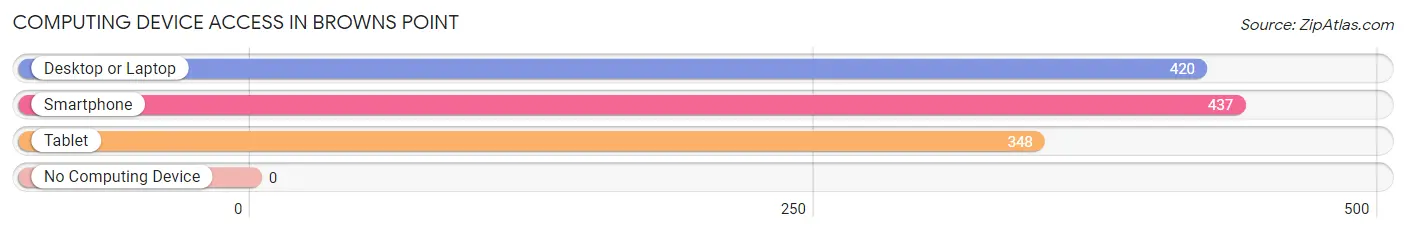
| Device Type | # Households | % Households |
| Desktop or Laptop | 420 | 88.6% |
| Smartphone | 437 | 92.2% |
| Tablet | 348 | 73.4% |
| No Computing Device | 0 | 0.0% |
| Total | 474 | 100.0% |
Internet Access in Browns Point
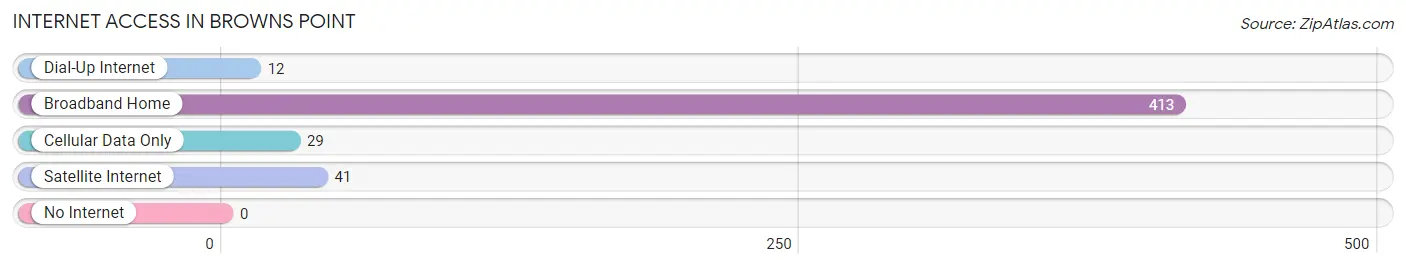
| Internet Type | # Households | % Households |
| Dial-Up Internet | 12 | 2.5% |
| Broadband Home | 413 | 87.1% |
| Cellular Data Only | 29 | 6.1% |
| Satellite Internet | 41 | 8.6% |
| No Internet | 0 | 0.0% |
| Total | 474 | 100.0% |
Browns Point Summary
Browns Point is a small community located in Pierce County, Washington, United States. It is situated on the Puget Sound, just north of Tacoma. The population was 4,845 at the 2010 census.
History
The area now known as Browns Point was first inhabited by the Nisqually people, who lived in the area for thousands of years before the arrival of European settlers. The first European settlers arrived in the area in the late 1800s, and the area was officially incorporated as a town in 1909.
The town was named after William Brown, who was one of the first settlers in the area. He was a farmer and a logger, and he built a sawmill in the area. The sawmill was the first industry in the area, and it helped to spur the growth of the town.
The town grew steadily throughout the 20th century, and by the 1950s it had become a popular summer destination for tourists. The town was also home to a number of resorts, which attracted visitors from all over the country.
Geography
Browns Point is located at 47°14'25"N 122°25'45"W (47.240278, -122.429167). It is situated on the Puget Sound, just north of Tacoma. The town is bordered by the cities of Tacoma, Fife, and Milton.
The town has a total area of 4.2 square miles, all of which is land. The terrain is mostly flat, with some hills in the northern part of the town. The town is located in a temperate rainforest climate, with mild temperatures year-round.
Economy
The economy of Browns Point is largely based on tourism and retail. The town is home to a number of resorts, which attract visitors from all over the country. The town also has a number of retail stores, restaurants, and other businesses.
The town is also home to a number of small businesses, including a marina, a boat repair shop, and a seafood processing plant. The town is also home to a number of small manufacturing companies, which produce a variety of products.
Demographics
As of the 2010 census, the population of Browns Point was 4,845. The racial makeup of the town was 87.3% White, 4.2% Asian, 2.2% African American, 0.7% Native American, 0.2% Pacific Islander, and 4.6% from other races.
The median household income in Browns Point was $60,938, and the median family income was $68,938. The per capita income in the town was $27,938. About 8.3% of the population was below the poverty line.
Conclusion
Browns Point is a small community located in Pierce County, Washington, United States. It is situated on the Puget Sound, just north of Tacoma. The population was 4,845 at the 2010 census. The town was first inhabited by the Nisqually people, and was later settled by European settlers in the late 1800s. The economy of Browns Point is largely based on tourism and retail, and the town is home to a number of resorts, restaurants, and other businesses. The population of Browns Point is mostly White, with a small percentage of Asian, African American, Native American, and Pacific Islander residents. The median household income in Browns Point was $60,938, and the per capita income was $27,938.
Common Questions
What is Per Capita Income in Browns Point?
Per Capita income in Browns Point is $64,340.
What is the Median Family Income in Browns Point?
Median Family Income in Browns Point is $117,813.
What is the Median Household income in Browns Point?
Median Household Income in Browns Point is $97,917.
What is Income or Wage Gap in Browns Point?
Income or Wage Gap in Browns Point is 50.4%.
Women in Browns Point earn 49.6 cents for every dollar earned by a man.
What is Inequality or Gini Index in Browns Point?
Inequality or Gini Index in Browns Point is 0.47.
What is the Total Population of Browns Point?
Total Population of Browns Point is 1,097.
What is the Total Male Population of Browns Point?
Total Male Population of Browns Point is 561.
What is the Total Female Population of Browns Point?
Total Female Population of Browns Point is 536.
What is the Ratio of Males per 100 Females in Browns Point?
There are 104.66 Males per 100 Females in Browns Point.
What is the Ratio of Females per 100 Males in Browns Point?
There are 95.54 Females per 100 Males in Browns Point.
What is the Median Population Age in Browns Point?
Median Population Age in Browns Point is 56.3 Years.
What is the Average Family Size in Browns Point
Average Family Size in Browns Point is 2.6 People.
What is the Average Household Size in Browns Point
Average Household Size in Browns Point is 2.3 People.
How Large is the Labor Force in Browns Point?
There are 484 People in the Labor Forcein in Browns Point.
What is the Percentage of People in the Labor Force in Browns Point?
50.4% of People are in the Labor Force in Browns Point.
What is the Unemployment Rate in Browns Point?
Unemployment Rate in Browns Point is 5.4%.