Cities with the Highest Percentage of South American Population in Illinois
RELATED REPORTS & OPTIONS
South American
Illinois
Compare Cities
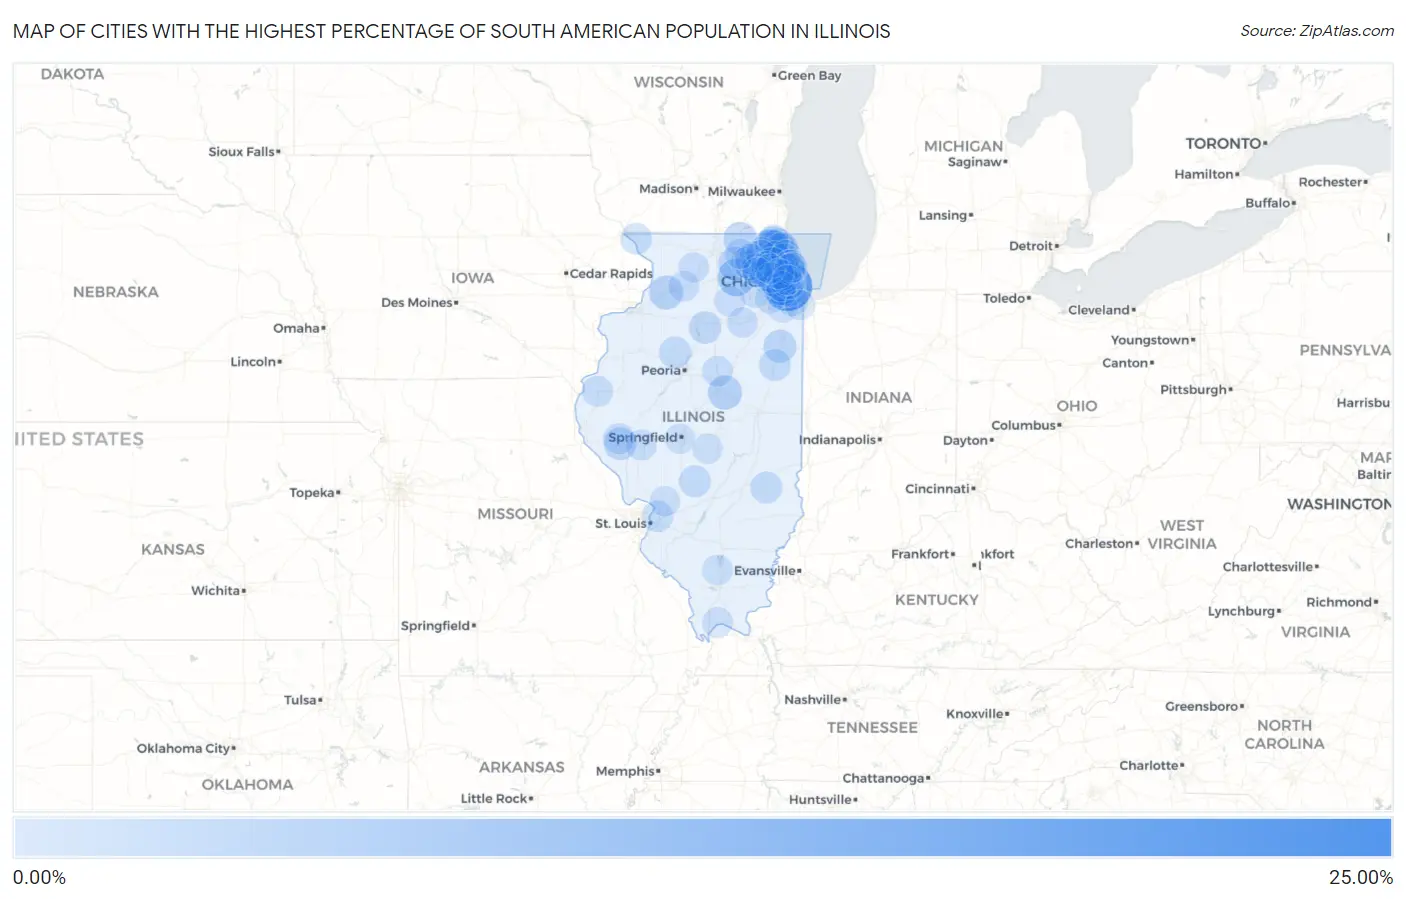
Map of Cities with the Highest Percentage of South American Population in Illinois
0.00%
25.00%
Cities with the Highest Percentage of South American Population in Illinois
| City | South American | vs State | vs National | |
| 1. | Andres | 21.95% | 0.80%(+21.1)#1 | 1.28%(+20.7)#50 |
| 2. | Forest View | 17.72% | 0.80%(+16.9)#2 | 1.28%(+16.4)#70 |
| 3. | Rosemont | 8.28% | 0.80%(+7.48)#3 | 1.28%(+7.00)#284 |
| 4. | Cortland | 6.91% | 0.80%(+6.10)#4 | 1.28%(+5.62)#375 |
| 5. | River Grove | 4.93% | 0.80%(+4.12)#5 | 1.28%(+3.64)#619 |
| 6. | East Dundee | 4.81% | 0.80%(+4.01)#6 | 1.28%(+3.53)#639 |
| 7. | Downs | 4.31% | 0.80%(+3.51)#7 | 1.28%(+3.03)#751 |
| 8. | Lyndon | 4.28% | 0.80%(+3.47)#8 | 1.28%(+2.99)#766 |
| 9. | Lyons | 4.27% | 0.80%(+3.46)#9 | 1.28%(+2.98)#771 |
| 10. | Genoa | 3.91% | 0.80%(+3.10)#10 | 1.28%(+2.62)#876 |
| 11. | Harvard | 3.65% | 0.80%(+2.84)#11 | 1.28%(+2.36)#960 |
| 12. | Indian Head Park | 3.53% | 0.80%(+2.73)#12 | 1.28%(+2.25)#991 |
| 13. | Chebanse | 3.25% | 0.80%(+2.45)#13 | 1.28%(+1.97)#1,098 |
| 14. | Bloomingdale | 3.12% | 0.80%(+2.32)#14 | 1.28%(+1.84)#1,157 |
| 15. | Griggsville | 3.12% | 0.80%(+2.31)#15 | 1.28%(+1.83)#1,159 |
| 16. | Round Lake Park | 3.03% | 0.80%(+2.23)#16 | 1.28%(+1.75)#1,204 |
| 17. | Granville | 2.85% | 0.80%(+2.05)#17 | 1.28%(+1.57)#1,301 |
| 18. | Franklin Park | 2.82% | 0.80%(+2.02)#18 | 1.28%(+1.54)#1,312 |
| 19. | Elmwood Park | 2.76% | 0.80%(+1.96)#19 | 1.28%(+1.48)#1,353 |
| 20. | Countryside | 2.75% | 0.80%(+1.95)#20 | 1.28%(+1.47)#1,359 |
| 21. | Knollwood | 2.72% | 0.80%(+1.92)#21 | 1.28%(+1.44)#1,376 |
| 22. | Justice | 2.52% | 0.80%(+1.72)#22 | 1.28%(+1.24)#1,482 |
| 23. | Rose Hill | 2.50% | 0.80%(+1.70)#23 | 1.28%(+1.22)#1,495 |
| 24. | Norridge | 2.47% | 0.80%(+1.66)#24 | 1.28%(+1.18)#1,518 |
| 25. | Gilman | 2.42% | 0.80%(+1.62)#25 | 1.28%(+1.14)#1,553 |
| 26. | Princeville | 2.40% | 0.80%(+1.60)#26 | 1.28%(+1.12)#1,565 |
| 27. | Hainesville | 2.40% | 0.80%(+1.59)#27 | 1.28%(+1.11)#1,572 |
| 28. | Irving | 2.32% | 0.80%(+1.52)#28 | 1.28%(+1.04)#1,626 |
| 29. | Carol Stream | 2.29% | 0.80%(+1.49)#29 | 1.28%(+1.01)#1,639 |
| 30. | Third Lake | 2.14% | 0.80%(+1.34)#30 | 1.28%(+0.859)#1,758 |
| 31. | Posen | 2.13% | 0.80%(+1.33)#31 | 1.28%(+0.848)#1,769 |
| 32. | Berwyn | 2.02% | 0.80%(+1.22)#32 | 1.28%(+0.738)#1,880 |
| 33. | Pontoon Beach | 2.02% | 0.80%(+1.22)#33 | 1.28%(+0.737)#1,881 |
| 34. | Streamwood | 2.02% | 0.80%(+1.22)#34 | 1.28%(+0.737)#1,882 |
| 35. | Melrose Park | 1.95% | 0.80%(+1.15)#35 | 1.28%(+0.671)#1,940 |
| 36. | Galena | 1.91% | 0.80%(+1.10)#36 | 1.28%(+0.622)#1,991 |
| 37. | Chicago | 1.79% | 0.80%(+0.987)#37 | 1.28%(+0.508)#2,104 |
| 38. | Oak Brook | 1.77% | 0.80%(+0.970)#38 | 1.28%(+0.490)#2,118 |
| 39. | Perry | 1.77% | 0.80%(+0.970)#39 | 1.28%(+0.490)#2,119 |
| 40. | Hometown | 1.77% | 0.80%(+0.965)#40 | 1.28%(+0.485)#2,128 |
| 41. | Green Oaks | 1.76% | 0.80%(+0.955)#41 | 1.28%(+0.475)#2,136 |
| 42. | Lincolnwood | 1.75% | 0.80%(+0.945)#42 | 1.28%(+0.465)#2,152 |
| 43. | Kenilworth | 1.69% | 0.80%(+0.892)#43 | 1.28%(+0.412)#2,208 |
| 44. | Harwood Heights | 1.69% | 0.80%(+0.885)#44 | 1.28%(+0.406)#2,213 |
| 45. | Hampshire | 1.68% | 0.80%(+0.873)#45 | 1.28%(+0.393)#2,232 |
| 46. | Hanover Park | 1.65% | 0.80%(+0.852)#46 | 1.28%(+0.372)#2,253 |
| 47. | Carthage | 1.64% | 0.80%(+0.837)#47 | 1.28%(+0.357)#2,264 |
| 48. | Round Lake | 1.62% | 0.80%(+0.819)#48 | 1.28%(+0.339)#2,295 |
| 49. | Burbank | 1.62% | 0.80%(+0.818)#49 | 1.28%(+0.338)#2,297 |
| 50. | Wheeling | 1.56% | 0.80%(+0.758)#50 | 1.28%(+0.278)#2,372 |
| 51. | Gurnee | 1.55% | 0.80%(+0.748)#51 | 1.28%(+0.268)#2,383 |
| 52. | Lynnville | 1.55% | 0.80%(+0.747)#52 | 1.28%(+0.267)#2,384 |
| 53. | Kappa | 1.52% | 0.80%(+0.712)#53 | 1.28%(+0.232)#2,428 |
| 54. | Oakwood Hills | 1.49% | 0.80%(+0.692)#54 | 1.28%(+0.212)#2,459 |
| 55. | Nelson | 1.47% | 0.80%(+0.667)#55 | 1.28%(+0.187)#2,495 |
| 56. | Maywood | 1.43% | 0.80%(+0.629)#56 | 1.28%(+0.149)#2,557 |
| 57. | Buckner | 1.43% | 0.80%(+0.625)#57 | 1.28%(+0.145)#2,563 |
| 58. | New Grand Chain | 1.43% | 0.80%(+0.625)#58 | 1.28%(+0.145)#2,564 |
| 59. | Montgomery | 1.41% | 0.80%(+0.611)#59 | 1.28%(+0.131)#2,587 |
| 60. | North Chicago | 1.40% | 0.80%(+0.602)#60 | 1.28%(+0.122)#2,602 |
| 61. | Cicero | 1.40% | 0.80%(+0.601)#61 | 1.28%(+0.121)#2,605 |
| 62. | Leland | 1.38% | 0.80%(+0.581)#62 | 1.28%(+0.101)#2,646 |
| 63. | Pingree Grove | 1.36% | 0.80%(+0.558)#63 | 1.28%(+0.078)#2,683 |
| 64. | Lake In The Hills | 1.36% | 0.80%(+0.557)#64 | 1.28%(+0.077)#2,684 |
| 65. | Grayslake | 1.35% | 0.80%(+0.543)#65 | 1.28%(+0.063)#2,704 |
| 66. | Burr Ridge | 1.34% | 0.80%(+0.535)#66 | 1.28%(+0.055)#2,717 |
| 67. | Des Plaines | 1.33% | 0.80%(+0.531)#67 | 1.28%(+0.052)#2,722 |
| 68. | Lombard | 1.32% | 0.80%(+0.518)#68 | 1.28%(+0.038)#2,747 |
| 69. | Huntley | 1.28% | 0.80%(+0.481)#69 | 1.28%(+0.001)#2,812 |
| 70. | Oakbrook Terrace | 1.26% | 0.80%(+0.458)#70 | 1.28%(-0.022)#2,845 |
| 71. | Long Grove | 1.23% | 0.80%(+0.429)#71 | 1.28%(-0.051)#2,905 |
| 72. | Elgin | 1.22% | 0.80%(+0.421)#72 | 1.28%(-0.059)#2,928 |
| 73. | Cary | 1.22% | 0.80%(+0.416)#73 | 1.28%(-0.064)#2,938 |
| 74. | Marengo | 1.20% | 0.80%(+0.401)#74 | 1.28%(-0.078)#2,973 |
| 75. | Forest Park | 1.19% | 0.80%(+0.383)#75 | 1.28%(-0.097)#3,022 |
| 76. | Deerfield | 1.18% | 0.80%(+0.381)#76 | 1.28%(-0.099)#3,027 |
| 77. | Seneca | 1.17% | 0.80%(+0.366)#77 | 1.28%(-0.114)#3,058 |
| 78. | Lindenhurst | 1.17% | 0.80%(+0.363)#78 | 1.28%(-0.117)#3,064 |
| 79. | Schiller Park | 1.16% | 0.80%(+0.361)#79 | 1.28%(-0.119)#3,066 |
| 80. | Mount Morris | 1.16% | 0.80%(+0.353)#80 | 1.28%(-0.126)#3,083 |
| 81. | Bartlett | 1.15% | 0.80%(+0.348)#81 | 1.28%(-0.132)#3,102 |
| 82. | Hoffman Estates | 1.14% | 0.80%(+0.337)#82 | 1.28%(-0.143)#3,127 |
| 83. | Highwood | 1.13% | 0.80%(+0.326)#83 | 1.28%(-0.154)#3,152 |
| 84. | Wilmette | 1.10% | 0.80%(+0.301)#84 | 1.28%(-0.179)#3,198 |
| 85. | Stonington | 1.10% | 0.80%(+0.296)#85 | 1.28%(-0.184)#3,215 |
| 86. | Mokena | 1.10% | 0.80%(+0.293)#86 | 1.28%(-0.187)#3,224 |
| 87. | Jerome | 1.09% | 0.80%(+0.291)#87 | 1.28%(-0.189)#3,229 |
| 88. | Romeoville | 1.07% | 0.80%(+0.263)#88 | 1.28%(-0.217)#3,298 |
| 89. | Holiday Shores | 1.07% | 0.80%(+0.262)#89 | 1.28%(-0.218)#3,302 |
| 90. | Palatine | 1.07% | 0.80%(+0.262)#90 | 1.28%(-0.218)#3,304 |
| 91. | Glendale Heights | 1.06% | 0.80%(+0.261)#91 | 1.28%(-0.219)#3,306 |
| 92. | Willow Springs | 1.04% | 0.80%(+0.237)#92 | 1.28%(-0.243)#3,357 |
| 93. | Skokie | 1.04% | 0.80%(+0.236)#93 | 1.28%(-0.244)#3,363 |
| 94. | Western Springs | 1.02% | 0.80%(+0.215)#94 | 1.28%(-0.265)#3,407 |
| 95. | Lansing | 0.98% | 0.80%(+0.175)#95 | 1.28%(-0.304)#3,497 |
| 96. | Evanston | 0.97% | 0.80%(+0.167)#96 | 1.28%(-0.313)#3,531 |
| 97. | Bensenville | 0.96% | 0.80%(+0.161)#97 | 1.28%(-0.319)#3,556 |
| 98. | South Elgin | 0.96% | 0.80%(+0.157)#98 | 1.28%(-0.323)#3,571 |
| 99. | Schaumburg | 0.96% | 0.80%(+0.157)#99 | 1.28%(-0.323)#3,572 |
| 100. | Oak Park | 0.96% | 0.80%(+0.153)#100 | 1.28%(-0.326)#3,582 |
Common Questions
What are the Top 10 Cities with the Highest Percentage of South American Population in Illinois?
Top 10 Cities with the Highest Percentage of South American Population in Illinois are:
#1
17.72%
#2
8.28%
#3
6.91%
#4
4.93%
#5
4.81%
#6
4.31%
#7
4.28%
#8
4.27%
#9
3.91%
#10
3.65%
What city has the Highest Percentage of South American Population in Illinois?
Forest View has the Highest Percentage of South American Population in Illinois with 17.72%.
What is the Percentage of South American Population in the State of Illinois?
Percentage of South American Population in Illinois is 0.80%.
What is the Percentage of South American Population in the United States?
Percentage of South American Population in the United States is 1.28%.