Cities with the Highest Percentage of South American Population in New York
RELATED REPORTS & OPTIONS
South American
New York
Compare Cities
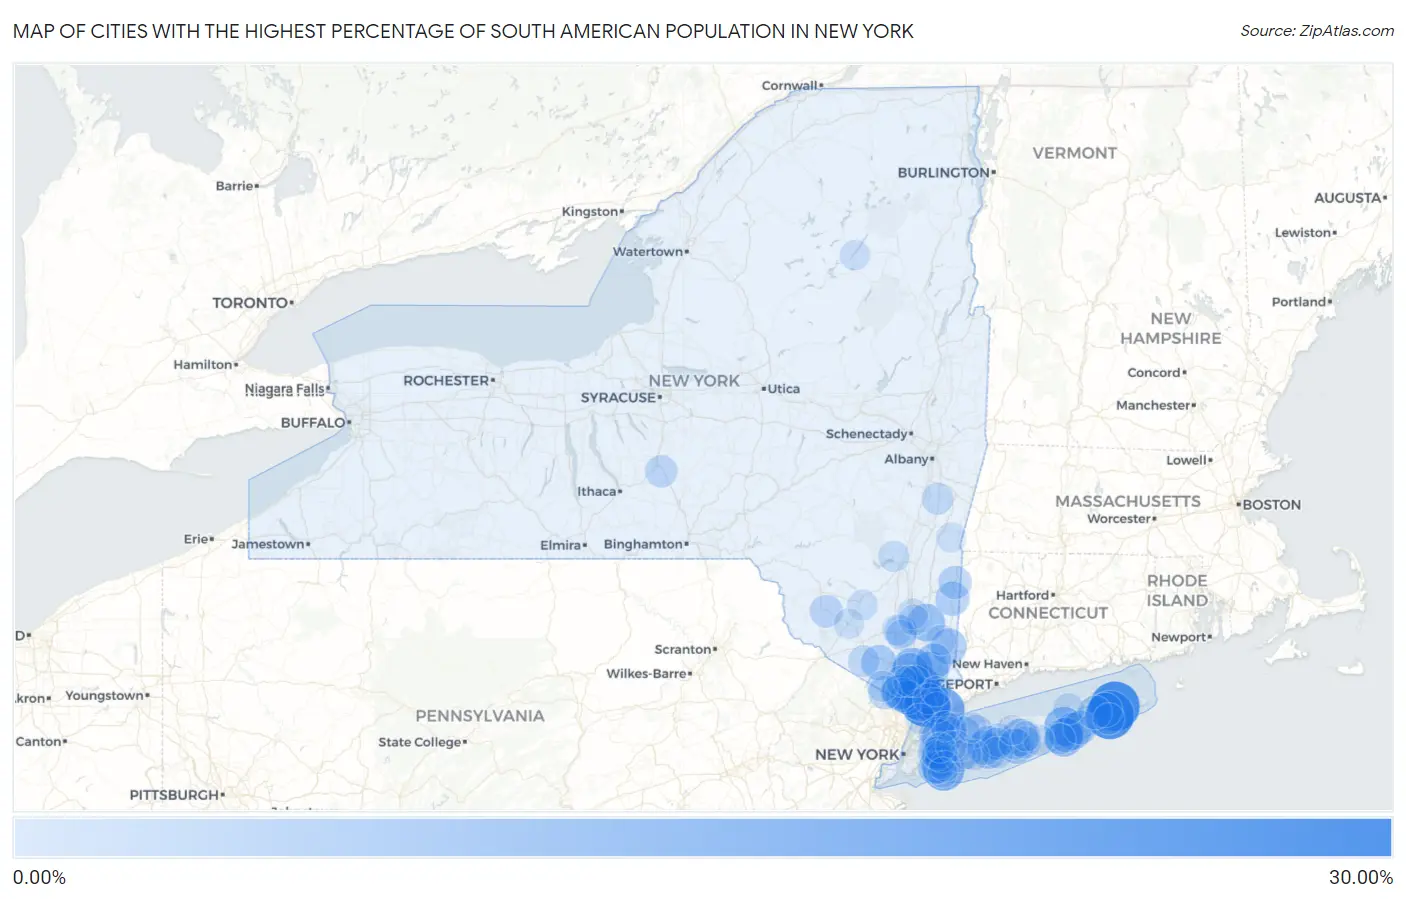
Map of Cities with the Highest Percentage of South American Population in New York
0.00%
30.00%
Cities with the Highest Percentage of South American Population in New York
| City | South American | vs State | vs National | |
| 1. | Springs | 28.51% | 3.26%(+25.3)#1 | 1.28%(+27.2)#21 |
| 2. | East Hampton North | 27.19% | 3.26%(+23.9)#2 | 1.28%(+25.9)#24 |
| 3. | Elmsford | 27.18% | 3.26%(+23.9)#3 | 1.28%(+25.9)#25 |
| 4. | Sleepy Hollow | 22.72% | 3.26%(+19.5)#4 | 1.28%(+21.4)#45 |
| 5. | Port Chester | 21.98% | 3.26%(+18.7)#5 | 1.28%(+20.7)#49 |
| 6. | Ossining | 20.73% | 3.26%(+17.5)#6 | 1.28%(+19.5)#56 |
| 7. | Westernville | 19.90% | 3.26%(+16.6)#7 | 1.28%(+18.6)#61 |
| 8. | Island Park | 18.46% | 3.26%(+15.2)#8 | 1.28%(+17.2)#67 |
| 9. | Peekskill | 15.96% | 3.26%(+12.7)#9 | 1.28%(+14.7)#86 |
| 10. | Flanders | 15.46% | 3.26%(+12.2)#10 | 1.28%(+14.2)#94 |
| 11. | Quogue | 14.84% | 3.26%(+11.6)#11 | 1.28%(+13.6)#103 |
| 12. | Hopewell Junction | 13.71% | 3.26%(+10.5)#12 | 1.28%(+12.4)#124 |
| 13. | Medford | 13.70% | 3.26%(+10.4)#13 | 1.28%(+12.4)#125 |
| 14. | Hampton Bays | 13.47% | 3.26%(+10.2)#14 | 1.28%(+12.2)#129 |
| 15. | Fairview Cdp Westchester County | 13.45% | 3.26%(+10.2)#15 | 1.28%(+12.2)#130 |
| 16. | Yorktown Heights | 13.23% | 3.26%(+9.97)#16 | 1.28%(+11.9)#134 |
| 17. | Buchanan | 12.76% | 3.26%(+9.51)#17 | 1.28%(+11.5)#144 |
| 18. | White Plains | 12.70% | 3.26%(+9.44)#18 | 1.28%(+11.4)#147 |
| 19. | Manorhaven | 12.48% | 3.26%(+9.23)#19 | 1.28%(+11.2)#150 |
| 20. | Brewster Hill | 11.88% | 3.26%(+8.62)#20 | 1.28%(+10.6)#159 |
| 21. | Hillcrest | 11.80% | 3.26%(+8.54)#21 | 1.28%(+10.5)#164 |
| 22. | Shenorock | 11.52% | 3.26%(+8.27)#22 | 1.28%(+10.2)#168 |
| 23. | Brentwood | 11.11% | 3.26%(+7.86)#23 | 1.28%(+9.83)#176 |
| 24. | Bay Shore | 11.07% | 3.26%(+7.81)#24 | 1.28%(+9.79)#178 |
| 25. | Baywood | 10.94% | 3.26%(+7.68)#25 | 1.28%(+9.66)#182 |
| 26. | Walton Park | 10.90% | 3.26%(+7.64)#26 | 1.28%(+9.61)#183 |
| 27. | Patchogue | 10.78% | 3.26%(+7.52)#27 | 1.28%(+9.49)#188 |
| 28. | Spring Valley | 10.74% | 3.26%(+7.49)#28 | 1.28%(+9.46)#189 |
| 29. | Bellerose Terrace | 10.63% | 3.26%(+7.38)#29 | 1.28%(+9.35)#191 |
| 30. | East Quogue | 10.62% | 3.26%(+7.37)#30 | 1.28%(+9.34)#192 |
| 31. | Northwest Harbor | 10.29% | 3.26%(+7.03)#31 | 1.28%(+9.01)#200 |
| 32. | Glen Head | 10.23% | 3.26%(+6.97)#32 | 1.28%(+8.94)#202 |
| 33. | New Hyde Park | 10.01% | 3.26%(+6.76)#33 | 1.28%(+8.73)#210 |
| 34. | South Floral Park | 10.01% | 3.26%(+6.75)#34 | 1.28%(+8.73)#211 |
| 35. | Baxter Estates | 9.93% | 3.26%(+6.67)#35 | 1.28%(+8.65)#213 |
| 36. | Nanuet | 9.88% | 3.26%(+6.62)#36 | 1.28%(+8.59)#216 |
| 37. | West Nyack | 9.77% | 3.26%(+6.51)#37 | 1.28%(+8.48)#219 |
| 38. | Dover Plains | 9.62% | 3.26%(+6.36)#38 | 1.28%(+8.34)#223 |
| 39. | Shinnecock Hills | 9.56% | 3.26%(+6.30)#39 | 1.28%(+8.27)#225 |
| 40. | Noyack | 9.30% | 3.26%(+6.04)#40 | 1.28%(+8.01)#239 |
| 41. | Valley Stream | 9.23% | 3.26%(+5.98)#41 | 1.28%(+7.95)#240 |
| 42. | Cedarhurst | 9.16% | 3.26%(+5.90)#42 | 1.28%(+7.87)#243 |
| 43. | Hillburn | 8.84% | 3.26%(+5.59)#43 | 1.28%(+7.56)#255 |
| 44. | Amenia | 8.78% | 3.26%(+5.53)#44 | 1.28%(+7.50)#259 |
| 45. | Islandia | 8.74% | 3.26%(+5.49)#45 | 1.28%(+7.46)#260 |
| 46. | Greenlawn | 8.45% | 3.26%(+5.19)#46 | 1.28%(+7.17)#275 |
| 47. | Lynbrook | 8.26% | 3.26%(+5.01)#47 | 1.28%(+6.98)#286 |
| 48. | Monticello | 8.15% | 3.26%(+4.90)#48 | 1.28%(+6.87)#292 |
| 49. | Irvington | 8.01% | 3.26%(+4.76)#49 | 1.28%(+6.73)#303 |
| 50. | Balmville | 7.96% | 3.26%(+4.70)#50 | 1.28%(+6.68)#305 |
| 51. | Bellerose | 7.71% | 3.26%(+4.45)#51 | 1.28%(+6.42)#317 |
| 52. | Laurel Hollow | 7.71% | 3.26%(+4.45)#52 | 1.28%(+6.42)#318 |
| 53. | Blodgett Mills | 7.69% | 3.26%(+4.44)#53 | 1.28%(+6.41)#322 |
| 54. | Woodsburgh | 7.55% | 3.26%(+4.30)#54 | 1.28%(+6.27)#329 |
| 55. | Franklin Square | 7.39% | 3.26%(+4.14)#55 | 1.28%(+6.11)#338 |
| 56. | Central Islip | 7.39% | 3.26%(+4.13)#56 | 1.28%(+6.10)#340 |
| 57. | North Bellport | 7.22% | 3.26%(+3.96)#57 | 1.28%(+5.93)#353 |
| 58. | Kinderhook | 7.03% | 3.26%(+3.78)#58 | 1.28%(+5.75)#366 |
| 59. | North Wantagh | 6.88% | 3.26%(+3.62)#59 | 1.28%(+5.59)#378 |
| 60. | Florida | 6.84% | 3.26%(+3.59)#60 | 1.28%(+5.56)#381 |
| 61. | East Islip | 6.81% | 3.26%(+3.55)#61 | 1.28%(+5.52)#387 |
| 62. | Croton On Hudson | 6.76% | 3.26%(+3.51)#62 | 1.28%(+5.48)#392 |
| 63. | North Patchogue | 6.76% | 3.26%(+3.50)#63 | 1.28%(+5.47)#393 |
| 64. | Locust Valley | 6.65% | 3.26%(+3.39)#64 | 1.28%(+5.36)#403 |
| 65. | Mattituck | 6.44% | 3.26%(+3.18)#65 | 1.28%(+5.15)#423 |
| 66. | Brewster Heights | 6.42% | 3.26%(+3.16)#66 | 1.28%(+5.14)#424 |
| 67. | East Hampton | 6.38% | 3.26%(+3.12)#67 | 1.28%(+5.09)#426 |
| 68. | Mount Ivy | 6.38% | 3.26%(+3.12)#68 | 1.28%(+5.09)#427 |
| 69. | Haverstraw | 6.34% | 3.26%(+3.08)#69 | 1.28%(+5.06)#435 |
| 70. | Danby | 6.29% | 3.26%(+3.03)#70 | 1.28%(+5.01)#437 |
| 71. | Sloatsburg | 6.25% | 3.26%(+3.00)#71 | 1.28%(+4.97)#441 |
| 72. | Zena | 6.20% | 3.26%(+2.94)#72 | 1.28%(+4.92)#450 |
| 73. | Hicksville | 6.10% | 3.26%(+2.84)#73 | 1.28%(+4.82)#457 |
| 74. | Quiogue | 6.10% | 3.26%(+2.84)#74 | 1.28%(+4.82)#459 |
| 75. | Tuxedo | 6.05% | 3.26%(+2.80)#75 | 1.28%(+4.77)#464 |
| 76. | Elmont | 6.04% | 3.26%(+2.79)#76 | 1.28%(+4.76)#466 |
| 77. | Gardnertown | 6.04% | 3.26%(+2.78)#77 | 1.28%(+4.75)#469 |
| 78. | Valhalla | 6.00% | 3.26%(+2.74)#78 | 1.28%(+4.71)#474 |
| 79. | Moriches | 5.98% | 3.26%(+2.72)#79 | 1.28%(+4.70)#477 |
| 80. | Crown Heights | 5.91% | 3.26%(+2.65)#80 | 1.28%(+4.62)#489 |
| 81. | South Farmingdale | 5.77% | 3.26%(+2.51)#81 | 1.28%(+4.49)#502 |
| 82. | Ellenville | 5.77% | 3.26%(+2.51)#82 | 1.28%(+4.48)#503 |
| 83. | North Lindenhurst | 5.72% | 3.26%(+2.46)#83 | 1.28%(+4.44)#512 |
| 84. | Westbury | 5.70% | 3.26%(+2.44)#84 | 1.28%(+4.42)#514 |
| 85. | Oceanside | 5.64% | 3.26%(+2.38)#85 | 1.28%(+4.36)#520 |
| 86. | Newburgh | 5.60% | 3.26%(+2.34)#86 | 1.28%(+4.32)#523 |
| 87. | Harrison | 5.55% | 3.26%(+2.30)#87 | 1.28%(+4.27)#529 |
| 88. | Halesite | 5.50% | 3.26%(+2.25)#88 | 1.28%(+4.22)#532 |
| 89. | Wappingers Falls | 5.49% | 3.26%(+2.23)#89 | 1.28%(+4.21)#534 |
| 90. | Lake Carmel | 5.48% | 3.26%(+2.22)#90 | 1.28%(+4.19)#539 |
| 91. | Long Lake | 5.41% | 3.26%(+2.15)#91 | 1.28%(+4.12)#549 |
| 92. | Glen Cove | 5.32% | 3.26%(+2.06)#92 | 1.28%(+4.03)#562 |
| 93. | Wurtsboro | 5.25% | 3.26%(+2.00)#93 | 1.28%(+3.97)#570 |
| 94. | Yonkers | 5.23% | 3.26%(+1.98)#94 | 1.28%(+3.95)#572 |
| 95. | Armonk | 5.21% | 3.26%(+1.95)#95 | 1.28%(+3.92)#574 |
| 96. | Selden | 5.19% | 3.26%(+1.94)#96 | 1.28%(+3.91)#578 |
| 97. | Manhasset Hills | 5.17% | 3.26%(+1.92)#97 | 1.28%(+3.89)#581 |
| 98. | Copake Lake | 5.14% | 3.26%(+1.88)#98 | 1.28%(+3.86)#586 |
| 99. | Yaphank | 5.09% | 3.26%(+1.83)#99 | 1.28%(+3.81)#590 |
| 100. | Long Beach | 5.06% | 3.26%(+1.80)#100 | 1.28%(+3.77)#598 |
Common Questions
What are the Top 10 Cities with the Highest Percentage of South American Population in New York?
Top 10 Cities with the Highest Percentage of South American Population in New York are:
#1
28.51%
#2
27.19%
#3
27.18%
#4
22.72%
#5
21.98%
#6
20.73%
#7
18.46%
#8
15.96%
#9
15.46%
#10
14.84%
What city has the Highest Percentage of South American Population in New York?
Springs has the Highest Percentage of South American Population in New York with 28.51%.
What is the Percentage of South American Population in the State of New York?
Percentage of South American Population in New York is 3.26%.
What is the Percentage of South American Population in the United States?
Percentage of South American Population in the United States is 1.28%.