Cities with the Highest Percentage of South American Population in Maryland
RELATED REPORTS & OPTIONS
South American
Maryland
Compare Cities
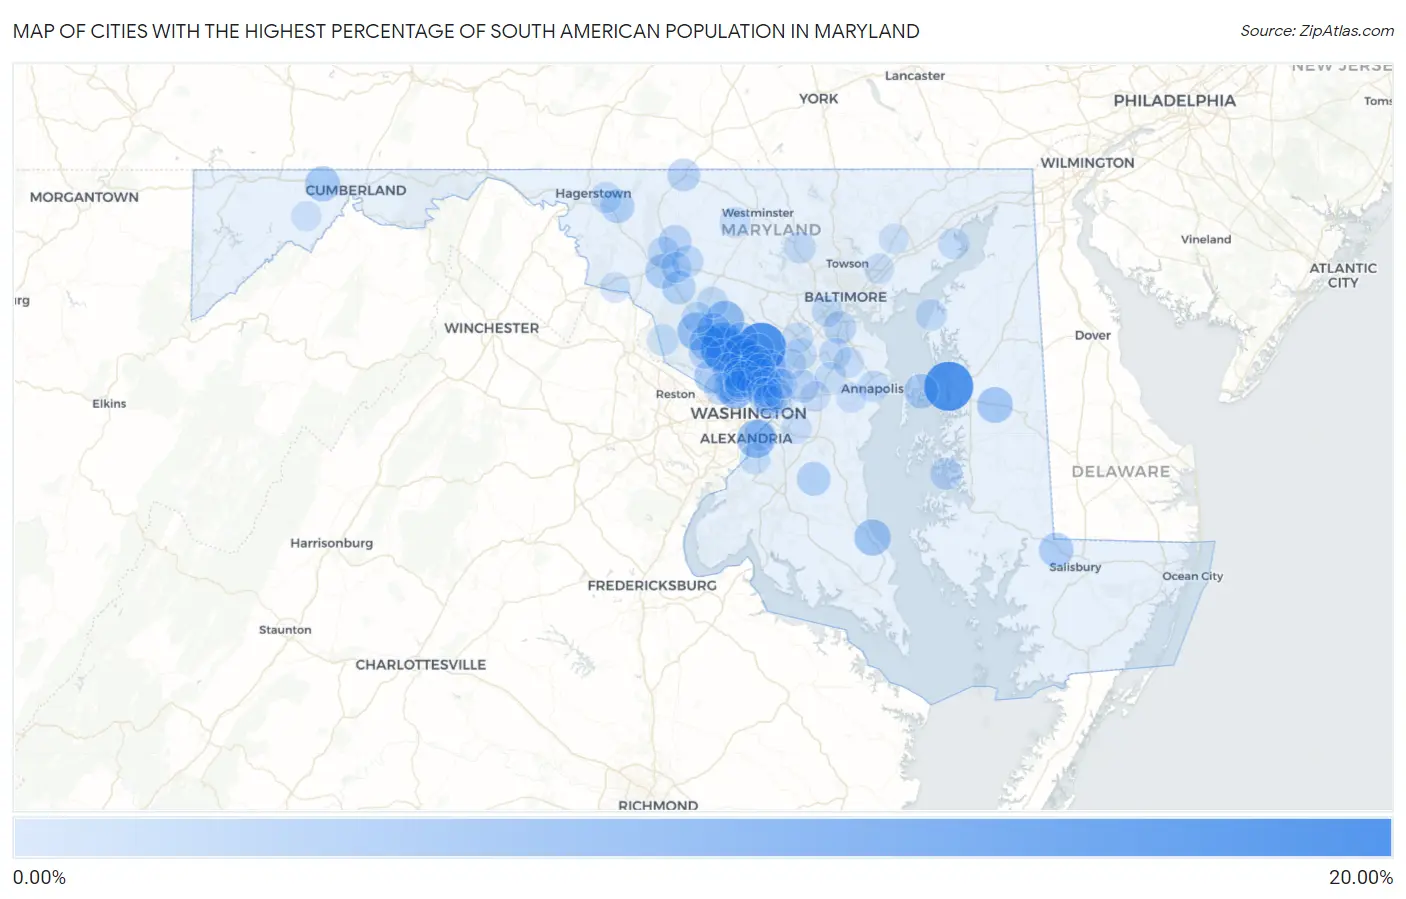
Map of Cities with the Highest Percentage of South American Population in Maryland
0.00%
20.00%
Cities with the Highest Percentage of South American Population in Maryland
| City | South American | vs State | vs National | |
| 1. | Spencerville | 15.82% | 1.46%(+14.4)#1 | 1.28%(+14.5)#87 |
| 2. | Queenstown | 15.46% | 1.46%(+14.0)#2 | 1.28%(+14.2)#93 |
| 3. | Derwood | 10.97% | 1.46%(+9.51)#3 | 1.28%(+9.69)#180 |
| 4. | Flower Hill | 9.32% | 1.46%(+7.86)#4 | 1.28%(+8.03)#236 |
| 5. | Redland | 8.60% | 1.46%(+7.14)#5 | 1.28%(+7.32)#264 |
| 6. | Aspen Hill | 7.51% | 1.46%(+6.05)#6 | 1.28%(+6.23)#332 |
| 7. | Laytonsville | 7.47% | 1.46%(+6.01)#7 | 1.28%(+6.19)#334 |
| 8. | Forest Heights | 7.35% | 1.46%(+5.89)#8 | 1.28%(+6.06)#345 |
| 9. | Glenmont | 7.31% | 1.46%(+5.85)#9 | 1.28%(+6.02)#352 |
| 10. | Germantown | 6.91% | 1.46%(+5.46)#10 | 1.28%(+5.63)#374 |
| 11. | Crumpton | 6.39% | 1.46%(+4.93)#11 | 1.28%(+5.11)#425 |
| 12. | St Leonard | 5.95% | 1.46%(+4.49)#12 | 1.28%(+4.67)#485 |
| 13. | North Kensington | 5.89% | 1.46%(+4.43)#13 | 1.28%(+4.61)#491 |
| 14. | Gaithersburg | 5.78% | 1.46%(+4.32)#14 | 1.28%(+4.50)#501 |
| 15. | Leisure World | 5.59% | 1.46%(+4.13)#15 | 1.28%(+4.31)#525 |
| 16. | Queen Anne | 5.56% | 1.46%(+4.10)#16 | 1.28%(+4.27)#528 |
| 17. | Wheaton | 5.42% | 1.46%(+3.96)#17 | 1.28%(+4.13)#547 |
| 18. | Zihlman | 5.06% | 1.46%(+3.60)#18 | 1.28%(+3.78)#596 |
| 19. | Four Corners | 4.98% | 1.46%(+3.52)#19 | 1.28%(+3.70)#608 |
| 20. | Somerset | 4.96% | 1.46%(+3.50)#20 | 1.28%(+3.68)#615 |
| 21. | Rockville | 4.88% | 1.46%(+3.42)#21 | 1.28%(+3.60)#625 |
| 22. | Ballenger Creek | 4.72% | 1.46%(+3.26)#22 | 1.28%(+3.44)#664 |
| 23. | North Bethesda | 4.68% | 1.46%(+3.22)#23 | 1.28%(+3.39)#676 |
| 24. | Chester | 4.65% | 1.46%(+3.19)#24 | 1.28%(+3.36)#678 |
| 25. | Hebron | 4.61% | 1.46%(+3.16)#25 | 1.28%(+3.33)#681 |
| 26. | Potomac | 4.49% | 1.46%(+3.03)#26 | 1.28%(+3.21)#716 |
| 27. | Montgomery Village | 4.44% | 1.46%(+2.98)#27 | 1.28%(+3.16)#722 |
| 28. | Layhill | 4.30% | 1.46%(+2.85)#28 | 1.28%(+3.02)#755 |
| 29. | Burnt Mills | 4.23% | 1.46%(+2.77)#29 | 1.28%(+2.94)#786 |
| 30. | Baden | 4.15% | 1.46%(+2.69)#30 | 1.28%(+2.87)#810 |
| 31. | Mount Aetna | 4.05% | 1.46%(+2.60)#31 | 1.28%(+2.77)#837 |
| 32. | Urbana | 4.03% | 1.46%(+2.57)#32 | 1.28%(+2.75)#841 |
| 33. | Kemp Mill | 3.97% | 1.46%(+2.51)#33 | 1.28%(+2.69)#860 |
| 34. | Olney | 3.86% | 1.46%(+2.40)#34 | 1.28%(+2.58)#892 |
| 35. | Calverton | 3.82% | 1.46%(+2.36)#35 | 1.28%(+2.54)#902 |
| 36. | Bethesda | 3.75% | 1.46%(+2.29)#36 | 1.28%(+2.47)#923 |
| 37. | Friendship Heights Village | 3.66% | 1.46%(+2.20)#37 | 1.28%(+2.38)#953 |
| 38. | Cloverly | 3.43% | 1.46%(+1.97)#38 | 1.28%(+2.14)#1,033 |
| 39. | Walkersville | 3.41% | 1.46%(+1.96)#39 | 1.28%(+2.13)#1,037 |
| 40. | Emmitsburg | 3.41% | 1.46%(+1.95)#40 | 1.28%(+2.12)#1,042 |
| 41. | Ferndale | 3.40% | 1.46%(+1.94)#41 | 1.28%(+2.11)#1,044 |
| 42. | Woodlawn Cdp Prince George S County | 3.33% | 1.46%(+1.87)#42 | 1.28%(+2.04)#1,074 |
| 43. | Glenn Dale | 3.31% | 1.46%(+1.85)#43 | 1.28%(+2.03)#1,076 |
| 44. | North Potomac | 3.31% | 1.46%(+1.85)#44 | 1.28%(+2.03)#1,079 |
| 45. | Colmar Manor | 3.17% | 1.46%(+1.71)#45 | 1.28%(+1.88)#1,132 |
| 46. | Kensington | 3.12% | 1.46%(+1.67)#46 | 1.28%(+1.84)#1,156 |
| 47. | North Chevy Chase | 3.08% | 1.46%(+1.63)#47 | 1.28%(+1.80)#1,179 |
| 48. | Frederick | 3.02% | 1.46%(+1.56)#48 | 1.28%(+1.74)#1,210 |
| 49. | Cabin John | 2.96% | 1.46%(+1.50)#49 | 1.28%(+1.68)#1,239 |
| 50. | Hillandale | 2.94% | 1.46%(+1.48)#50 | 1.28%(+1.66)#1,246 |
| 51. | Oxford | 2.94% | 1.46%(+1.48)#51 | 1.28%(+1.65)#1,247 |
| 52. | Linganore | 2.88% | 1.46%(+1.42)#52 | 1.28%(+1.60)#1,280 |
| 53. | Silver Spring | 2.86% | 1.46%(+1.40)#53 | 1.28%(+1.58)#1,299 |
| 54. | Gambrills | 2.80% | 1.46%(+1.34)#54 | 1.28%(+1.51)#1,328 |
| 55. | Reisterstown | 2.80% | 1.46%(+1.34)#55 | 1.28%(+1.51)#1,331 |
| 56. | Mount Rainier | 2.78% | 1.46%(+1.33)#56 | 1.28%(+1.50)#1,340 |
| 57. | Beltsville | 2.77% | 1.46%(+1.31)#57 | 1.28%(+1.49)#1,349 |
| 58. | Glassmanor | 2.75% | 1.46%(+1.29)#58 | 1.28%(+1.47)#1,362 |
| 59. | Berwyn Heights | 2.75% | 1.46%(+1.29)#59 | 1.28%(+1.46)#1,364 |
| 60. | Chevy Chase View | 2.67% | 1.46%(+1.21)#60 | 1.28%(+1.39)#1,396 |
| 61. | Damascus | 2.54% | 1.46%(+1.08)#61 | 1.28%(+1.26)#1,470 |
| 62. | Naval Academy | 2.53% | 1.46%(+1.07)#62 | 1.28%(+1.25)#1,478 |
| 63. | Chevy Chase Section Five | 2.51% | 1.46%(+1.05)#63 | 1.28%(+1.23)#1,488 |
| 64. | Arbutus | 2.44% | 1.46%(+0.980)#64 | 1.28%(+1.16)#1,541 |
| 65. | Poolesville | 2.43% | 1.46%(+0.968)#65 | 1.28%(+1.14)#1,548 |
| 66. | Tolchester | 2.41% | 1.46%(+0.954)#66 | 1.28%(+1.13)#1,556 |
| 67. | Robinwood | 2.41% | 1.46%(+0.953)#67 | 1.28%(+1.13)#1,557 |
| 68. | Clarksburg | 2.39% | 1.46%(+0.927)#68 | 1.28%(+1.10)#1,578 |
| 69. | Takoma Park | 2.38% | 1.46%(+0.924)#69 | 1.28%(+1.10)#1,584 |
| 70. | Colesville | 2.38% | 1.46%(+0.920)#70 | 1.28%(+1.10)#1,587 |
| 71. | Aberdeen Proving Ground | 2.33% | 1.46%(+0.872)#71 | 1.28%(+1.05)#1,622 |
| 72. | Maryland City | 2.32% | 1.46%(+0.858)#72 | 1.28%(+1.03)#1,631 |
| 73. | Fort Washington | 2.31% | 1.46%(+0.853)#73 | 1.28%(+1.03)#1,632 |
| 74. | Bartonsville | 2.28% | 1.46%(+0.817)#74 | 1.28%(+0.992)#1,650 |
| 75. | College Park | 2.25% | 1.46%(+0.793)#75 | 1.28%(+0.969)#1,670 |
| 76. | Ten Mile Creek | 2.25% | 1.46%(+0.791)#76 | 1.28%(+0.966)#1,674 |
| 77. | New Windsor | 2.22% | 1.46%(+0.765)#77 | 1.28%(+0.941)#1,696 |
| 78. | Crofton | 2.12% | 1.46%(+0.657)#78 | 1.28%(+0.832)#1,787 |
| 79. | Chevy Chase | 2.08% | 1.46%(+0.625)#79 | 1.28%(+0.801)#1,815 |
| 80. | Langley Park | 2.07% | 1.46%(+0.612)#80 | 1.28%(+0.788)#1,833 |
| 81. | Forest Glen | 1.97% | 1.46%(+0.510)#81 | 1.28%(+0.685)#1,926 |
| 82. | Adelphi | 1.95% | 1.46%(+0.495)#82 | 1.28%(+0.670)#1,941 |
| 83. | Brunswick | 1.93% | 1.46%(+0.469)#83 | 1.28%(+0.645)#1,967 |
| 84. | Savage | 1.93% | 1.46%(+0.468)#84 | 1.28%(+0.643)#1,971 |
| 85. | Arden On The Severn | 1.91% | 1.46%(+0.449)#85 | 1.28%(+0.624)#1,989 |
| 86. | South Laurel | 1.87% | 1.46%(+0.416)#86 | 1.28%(+0.592)#2,008 |
| 87. | Riva | 1.84% | 1.46%(+0.381)#87 | 1.28%(+0.556)#2,055 |
| 88. | North Brentwood | 1.83% | 1.46%(+0.369)#88 | 1.28%(+0.545)#2,066 |
| 89. | Westphalia | 1.80% | 1.46%(+0.344)#89 | 1.28%(+0.520)#2,090 |
| 90. | White Oak | 1.79% | 1.46%(+0.336)#90 | 1.28%(+0.512)#2,100 |
| 91. | White Marsh | 1.74% | 1.46%(+0.283)#91 | 1.28%(+0.458)#2,158 |
| 92. | Chillum | 1.74% | 1.46%(+0.282)#92 | 1.28%(+0.457)#2,159 |
| 93. | Bowie | 1.72% | 1.46%(+0.261)#93 | 1.28%(+0.436)#2,178 |
| 94. | Cottage City | 1.70% | 1.46%(+0.245)#94 | 1.28%(+0.421)#2,199 |
| 95. | Pleasant Hills | 1.63% | 1.46%(+0.172)#95 | 1.28%(+0.347)#2,283 |
| 96. | Landover Hills | 1.61% | 1.46%(+0.147)#96 | 1.28%(+0.322)#2,317 |
| 97. | Lonaconing | 1.59% | 1.46%(+0.129)#97 | 1.28%(+0.304)#2,336 |
| 98. | East Riverdale | 1.56% | 1.46%(+0.101)#98 | 1.28%(+0.277)#2,373 |
| 99. | Hyattsville | 1.54% | 1.46%(+0.086)#99 | 1.28%(+0.261)#2,394 |
| 100. | Greenbelt | 1.52% | 1.46%(+0.063)#100 | 1.28%(+0.238)#2,418 |
Common Questions
What are the Top 10 Cities with the Highest Percentage of South American Population in Maryland?
Top 10 Cities with the Highest Percentage of South American Population in Maryland are:
#1
15.82%
#2
15.46%
#3
10.97%
#4
8.60%
#5
7.51%
#6
7.47%
#7
7.35%
#8
7.31%
#9
6.91%
#10
5.95%
What city has the Highest Percentage of South American Population in Maryland?
Spencerville has the Highest Percentage of South American Population in Maryland with 15.82%.
What is the Percentage of South American Population in the State of Maryland?
Percentage of South American Population in Maryland is 1.46%.
What is the Percentage of South American Population in the United States?
Percentage of South American Population in the United States is 1.28%.