Gilroy, CA Map & Demographics
Gilroy Map
Gilroy Overview
$44,660
PER CAPITA INCOME
$133,555
AVG FAMILY INCOME
$127,391
AVG HOUSEHOLD INCOME
37.5%
WAGE / INCOME GAP [ % ]
62.5¢/ $1
WAGE / INCOME GAP [ $ ]
$12,723
FAMILY INCOME DEFICIT
0.41
INEQUALITY / GINI INDEX
58,696
TOTAL POPULATION
29,291
MALE POPULATION
29,405
FEMALE POPULATION
99.61
MALES / 100 FEMALES
100.39
FEMALES / 100 MALES
35.2
MEDIAN AGE
3.7
AVG FAMILY SIZE
3.4
AVG HOUSEHOLD SIZE
29,295
LABOR FORCE [ PEOPLE ]
67.1%
PERCENT IN LABOR FORCE
5.9%
UNEMPLOYMENT RATE
Gilroy Zip Codes
Income in Gilroy
Income Overview in Gilroy
Per Capita Income in Gilroy is $44,660, while median incomes of families and households are $133,555 and $127,391 respectively.
| Characteristic | Number | Measure |
| Per Capita Income | 58,696 | $44,660 |
| Median Family Income | 13,858 | $133,555 |
| Mean Family Income | 13,858 | $159,536 |
| Median Household Income | 16,969 | $127,391 |
| Mean Household Income | 16,969 | $150,963 |
| Income Deficit | 13,858 | $12,723 |
| Wage / Income Gap (%) | 58,696 | 37.46% |
| Wage / Income Gap ($) | 58,696 | 62.54¢ per $1 |
| Gini / Inequality Index | 58,696 | 0.41 |
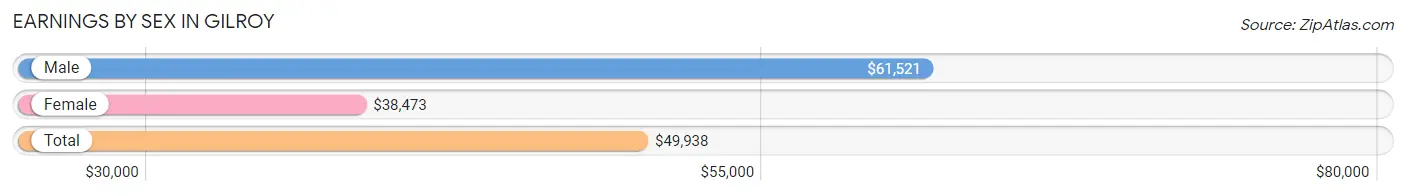
Earnings by Sex in Gilroy
Average Earnings in Gilroy are $49,938, $61,521 for men and $38,473 for women, a difference of 37.5%.
| Sex | Number | Average Earnings |
| Male | 16,238 (54.3%) | $61,521 |
| Female | 13,682 (45.7%) | $38,473 |
| Total | 29,920 (100.0%) | $49,938 |
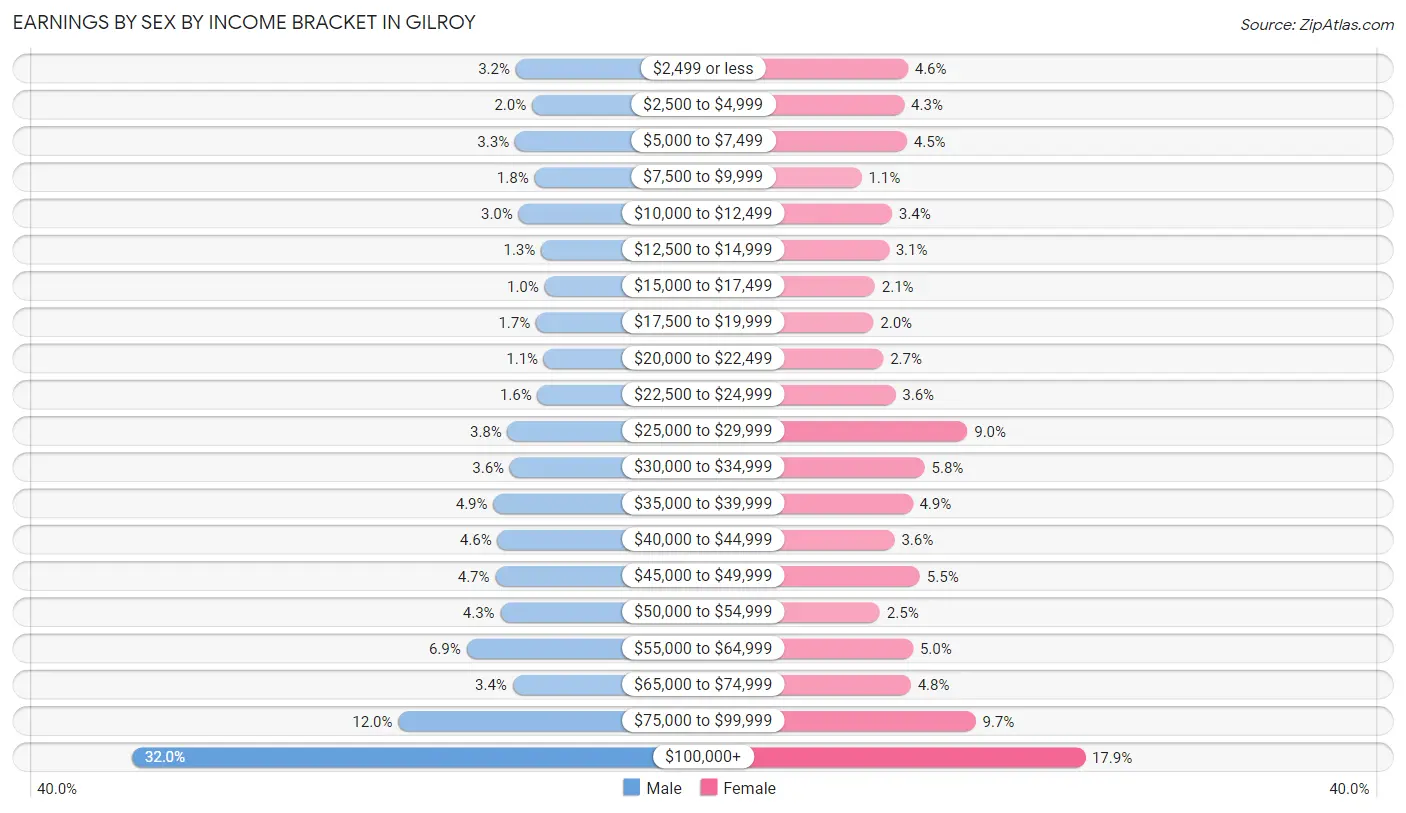
Earnings by Sex by Income Bracket in Gilroy
The most common earnings brackets in Gilroy are $100,000+ for men (5,190 | 32.0%) and $100,000+ for women (2,442 | 17.8%).
| Income | Male | Female |
| $2,499 or less | 518 (3.2%) | 625 (4.6%) |
| $2,500 to $4,999 | 320 (2.0%) | 588 (4.3%) |
| $5,000 to $7,499 | 528 (3.3%) | 616 (4.5%) |
| $7,500 to $9,999 | 291 (1.8%) | 150 (1.1%) |
| $10,000 to $12,499 | 484 (3.0%) | 462 (3.4%) |
| $12,500 to $14,999 | 209 (1.3%) | 430 (3.1%) |
| $15,000 to $17,499 | 168 (1.0%) | 288 (2.1%) |
| $17,500 to $19,999 | 271 (1.7%) | 272 (2.0%) |
| $20,000 to $22,499 | 176 (1.1%) | 373 (2.7%) |
| $22,500 to $24,999 | 253 (1.6%) | 498 (3.6%) |
| $25,000 to $29,999 | 617 (3.8%) | 1,236 (9.0%) |
| $30,000 to $34,999 | 590 (3.6%) | 798 (5.8%) |
| $35,000 to $39,999 | 791 (4.9%) | 673 (4.9%) |
| $40,000 to $44,999 | 741 (4.6%) | 488 (3.6%) |
| $45,000 to $49,999 | 767 (4.7%) | 750 (5.5%) |
| $50,000 to $54,999 | 704 (4.3%) | 339 (2.5%) |
| $55,000 to $64,999 | 1,117 (6.9%) | 678 (5.0%) |
| $65,000 to $74,999 | 556 (3.4%) | 656 (4.8%) |
| $75,000 to $99,999 | 1,947 (12.0%) | 1,320 (9.7%) |
| $100,000+ | 5,190 (32.0%) | 2,442 (17.8%) |
| Total | 16,238 (100.0%) | 13,682 (100.0%) |
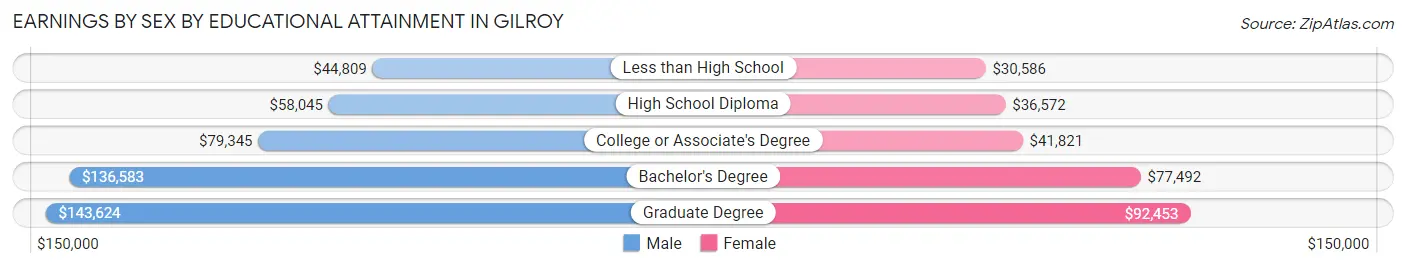
Earnings by Sex by Educational Attainment in Gilroy
Average earnings in Gilroy are $78,828 for men and $46,129 for women, a difference of 41.5%. Men with an educational attainment of graduate degree enjoy the highest average annual earnings of $143,624, while those with less than high school education earn the least with $44,809. Women with an educational attainment of graduate degree earn the most with the average annual earnings of $92,453, while those with less than high school education have the smallest earnings of $30,586.
| Educational Attainment | Male Income | Female Income |
| Less than High School | $44,809 | $30,586 |
| High School Diploma | $58,045 | $36,572 |
| College or Associate's Degree | $79,345 | $41,821 |
| Bachelor's Degree | $136,583 | $77,492 |
| Graduate Degree | $143,624 | $92,453 |
| Total | $78,828 | $46,129 |
Family Income in Gilroy
Family Income Brackets in Gilroy
According to the Gilroy family income data, there are 3,797 families falling into the $200,000+ income range, which is the most common income bracket and makes up 27.4% of all families. Conversely, the $10,000 to $14,999 income bracket is the least frequent group with only 83 families (0.6%) belonging to this category.
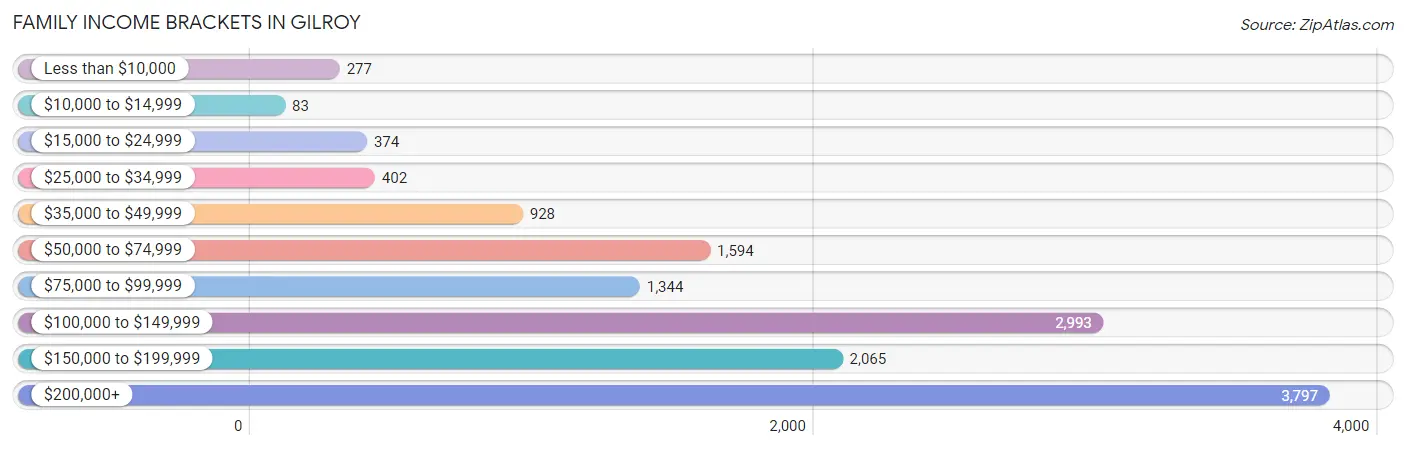
| Income Bracket | # Families | % Families |
| Less than $10,000 | 277 | 2.0% |
| $10,000 to $14,999 | 83 | 0.6% |
| $15,000 to $24,999 | 374 | 2.7% |
| $25,000 to $34,999 | 402 | 2.9% |
| $35,000 to $49,999 | 928 | 6.7% |
| $50,000 to $74,999 | 1,594 | 11.5% |
| $75,000 to $99,999 | 1,344 | 9.7% |
| $100,000 to $149,999 | 2,993 | 21.6% |
| $150,000 to $199,999 | 2,065 | 14.9% |
| $200,000+ | 3,797 | 27.4% |
Family Income by Famaliy Size in Gilroy
7+ person families (515 | 3.7%) account for the highest median family income in Gilroy with $185,687 per family, while 2-person families (4,561 | 32.9%) have the highest median income of $53,255 per family member.
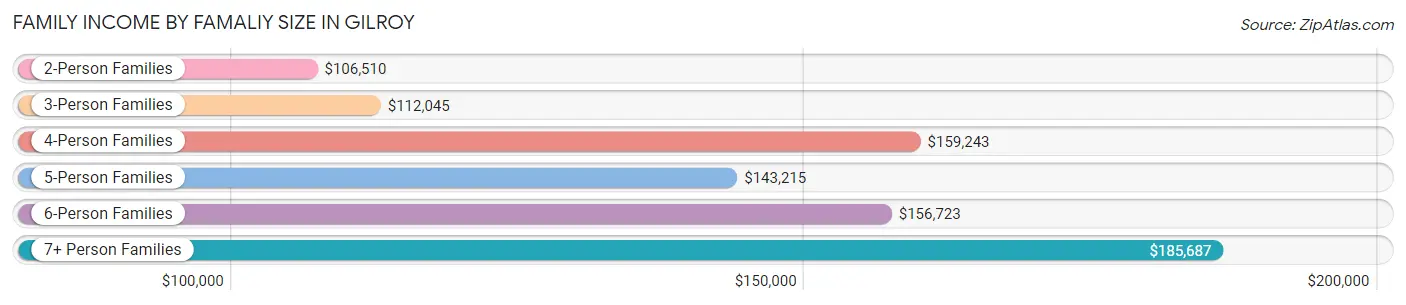
| Income Bracket | # Families | Median Income |
| 2-Person Families | 4,561 (32.9%) | $106,510 |
| 3-Person Families | 3,024 (21.8%) | $112,045 |
| 4-Person Families | 2,828 (20.4%) | $159,243 |
| 5-Person Families | 2,089 (15.1%) | $143,215 |
| 6-Person Families | 841 (6.1%) | $156,723 |
| 7+ Person Families | 515 (3.7%) | $185,687 |
| Total | 13,858 (100.0%) | $133,555 |
Family Income by Number of Earners in Gilroy
The median family income in Gilroy is $133,555, with families comprising 3+ earners (3,039) having the highest median family income of $190,375, while families with no earners (1,272) have the lowest median family income of $61,500, accounting for 21.9% and 9.2% of families, respectively.
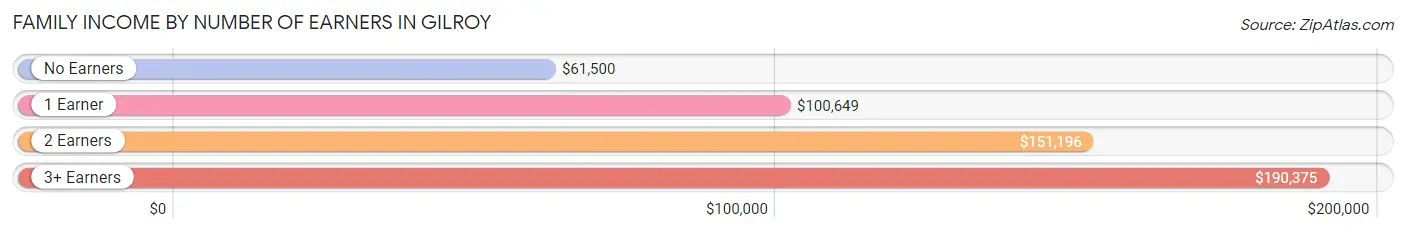
| Number of Earners | # Families | Median Income |
| No Earners | 1,272 (9.2%) | $61,500 |
| 1 Earner | 4,289 (30.9%) | $100,649 |
| 2 Earners | 5,258 (37.9%) | $151,196 |
| 3+ Earners | 3,039 (21.9%) | $190,375 |
| Total | 13,858 (100.0%) | $133,555 |
Household Income in Gilroy
Household Income Brackets in Gilroy
With 4,191 households falling in the category, the $200,000+ income range is the most frequent in Gilroy, accounting for 24.7% of all households. In contrast, only 288 households (1.7%) fall into the $10,000 to $14,999 income bracket, making it the least populous group.
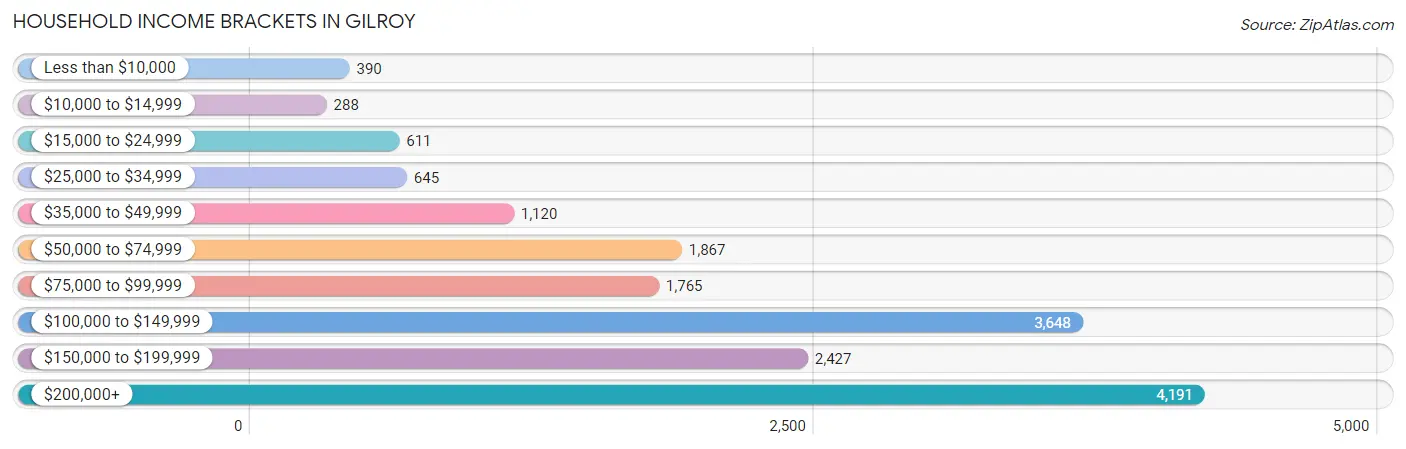
| Income Bracket | # Households | % Households |
| Less than $10,000 | 390 | 2.3% |
| $10,000 to $14,999 | 288 | 1.7% |
| $15,000 to $24,999 | 611 | 3.6% |
| $25,000 to $34,999 | 645 | 3.8% |
| $35,000 to $49,999 | 1,120 | 6.6% |
| $50,000 to $74,999 | 1,867 | 11.0% |
| $75,000 to $99,999 | 1,765 | 10.4% |
| $100,000 to $149,999 | 3,648 | 21.5% |
| $150,000 to $199,999 | 2,427 | 14.3% |
| $200,000+ | 4,191 | 24.7% |
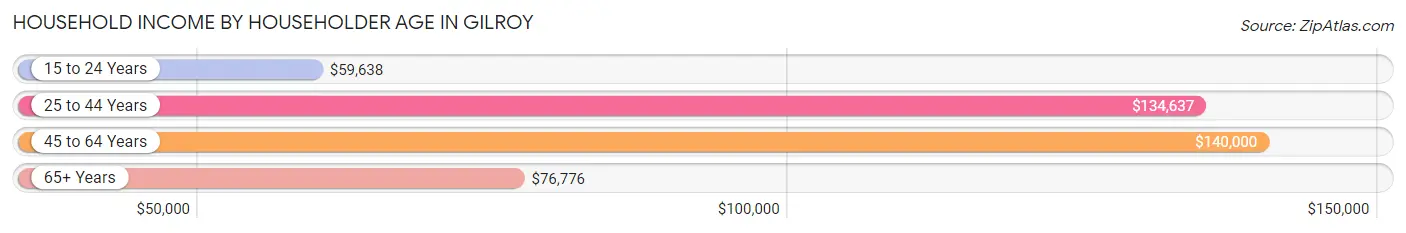
Household Income by Householder Age in Gilroy
The median household income in Gilroy is $127,391, with the highest median household income of $140,000 found in the 45 to 64 years age bracket for the primary householder. A total of 6,856 households (40.4%) fall into this category. Meanwhile, the 15 to 24 years age bracket for the primary householder has the lowest median household income of $59,638, with 365 households (2.1%) in this group.
| Income Bracket | # Households | Median Income |
| 15 to 24 Years | 365 (2.1%) | $59,638 |
| 25 to 44 Years | 6,046 (35.6%) | $134,637 |
| 45 to 64 Years | 6,856 (40.4%) | $140,000 |
| 65+ Years | 3,702 (21.8%) | $76,776 |
| Total | 16,969 (100.0%) | $127,391 |
Poverty in Gilroy
Income Below Poverty by Sex and Age in Gilroy
With 5.5% poverty level for males and 10.2% for females among the residents of Gilroy, 16 and 17 year old males and 16 and 17 year old females are the most vulnerable to poverty, with 100 males (9.8%) and 219 females (31.2%) in their respective age groups living below the poverty level.
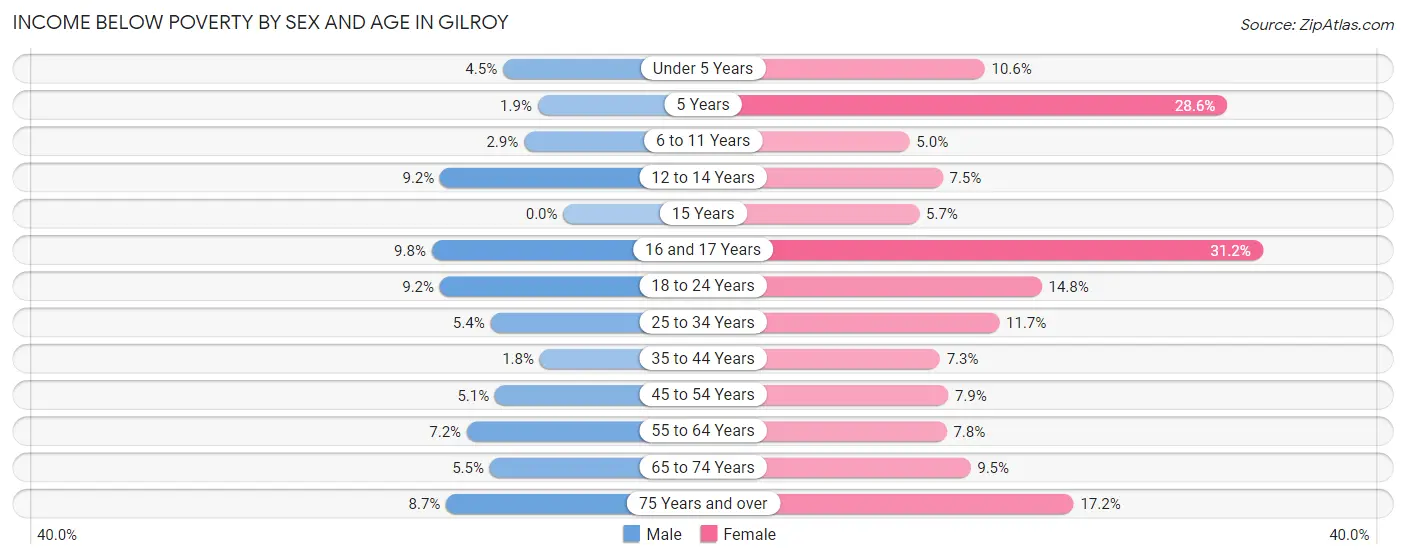
| Age Bracket | Male | Female |
| Under 5 Years | 86 (4.5%) | 190 (10.6%) |
| 5 Years | 11 (1.9%) | 117 (28.6%) |
| 6 to 11 Years | 74 (2.9%) | 150 (5.0%) |
| 12 to 14 Years | 164 (9.1%) | 118 (7.5%) |
| 15 Years | 0 (0.0%) | 23 (5.7%) |
| 16 and 17 Years | 100 (9.8%) | 219 (31.2%) |
| 18 to 24 Years | 288 (9.2%) | 370 (14.8%) |
| 25 to 34 Years | 170 (5.4%) | 435 (11.7%) |
| 35 to 44 Years | 75 (1.8%) | 291 (7.3%) |
| 45 to 54 Years | 186 (5.1%) | 296 (7.9%) |
| 55 to 64 Years | 219 (7.2%) | 261 (7.8%) |
| 65 to 74 Years | 101 (5.5%) | 234 (9.5%) |
| 75 Years and over | 106 (8.7%) | 278 (17.2%) |
| Total | 1,580 (5.5%) | 2,982 (10.2%) |
Income Above Poverty by Sex and Age in Gilroy
According to the poverty statistics in Gilroy, males aged 15 years and females aged 6 to 11 years are the age groups that are most secure financially, with 100.0% of males and 95.0% of females in these age groups living above the poverty line.
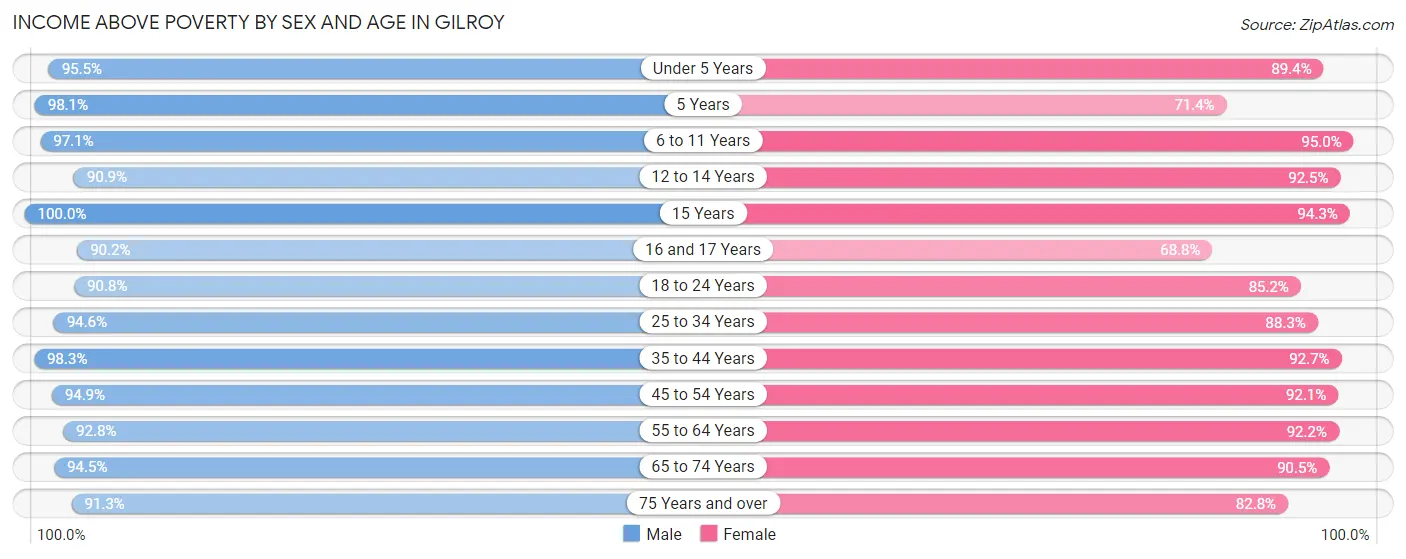
| Age Bracket | Male | Female |
| Under 5 Years | 1,835 (95.5%) | 1,603 (89.4%) |
| 5 Years | 569 (98.1%) | 292 (71.4%) |
| 6 to 11 Years | 2,457 (97.1%) | 2,837 (95.0%) |
| 12 to 14 Years | 1,628 (90.8%) | 1,460 (92.5%) |
| 15 Years | 688 (100.0%) | 378 (94.3%) |
| 16 and 17 Years | 924 (90.2%) | 482 (68.8%) |
| 18 to 24 Years | 2,851 (90.8%) | 2,125 (85.2%) |
| 25 to 34 Years | 2,972 (94.6%) | 3,288 (88.3%) |
| 35 to 44 Years | 4,211 (98.3%) | 3,713 (92.7%) |
| 45 to 54 Years | 3,483 (94.9%) | 3,461 (92.1%) |
| 55 to 64 Years | 2,839 (92.8%) | 3,100 (92.2%) |
| 65 to 74 Years | 1,748 (94.5%) | 2,218 (90.5%) |
| 75 Years and over | 1,113 (91.3%) | 1,338 (82.8%) |
| Total | 27,318 (94.5%) | 26,295 (89.8%) |
Income Below Poverty Among Married-Couple Families in Gilroy
The poverty statistics for married-couple families in Gilroy show that 2.1% or 202 of the total 9,775 families live below the poverty line. Families with 3 or 4 children have the highest poverty rate of 2.7%, comprising of 45 families. On the other hand, families with 5 or more children have the lowest poverty rate of 0.0%, which includes 0 families.
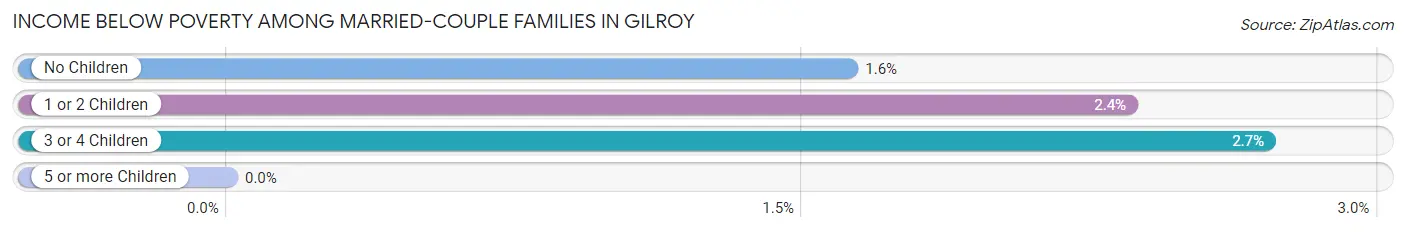
| Children | Above Poverty | Below Poverty |
| No Children | 4,365 (98.4%) | 72 (1.6%) |
| 1 or 2 Children | 3,533 (97.7%) | 85 (2.4%) |
| 3 or 4 Children | 1,618 (97.3%) | 45 (2.7%) |
| 5 or more Children | 57 (100.0%) | 0 (0.0%) |
| Total | 9,573 (97.9%) | 202 (2.1%) |
Income Below Poverty Among Single-Parent Households in Gilroy
According to the poverty data in Gilroy, 7.5% or 83 single-father households and 13.4% or 400 single-mother households are living below the poverty line. Among single-father households, those with 3 or 4 children have the highest poverty rate, with 44 households (45.8%) experiencing poverty. Likewise, among single-mother households, those with 3 or 4 children have the highest poverty rate, with 53 households (21.5%) falling below the poverty line.
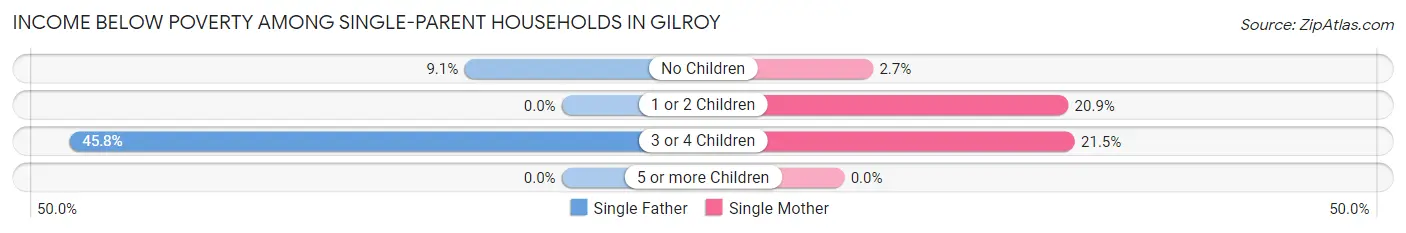
| Children | Single Father | Single Mother |
| No Children | 39 (9.1%) | 32 (2.7%) |
| 1 or 2 Children | 0 (0.0%) | 315 (20.9%) |
| 3 or 4 Children | 44 (45.8%) | 53 (21.5%) |
| 5 or more Children | 0 (0.0%) | 0 (0.0%) |
| Total | 83 (7.5%) | 400 (13.4%) |
Income Below Poverty Among Married-Couple vs Single-Parent Households in Gilroy
The poverty data for Gilroy shows that 202 of the married-couple family households (2.1%) and 483 of the single-parent households (11.8%) are living below the poverty level. Within the married-couple family households, those with 3 or 4 children have the highest poverty rate, with 45 households (2.7%) falling below the poverty line. Among the single-parent households, those with 3 or 4 children have the highest poverty rate, with 97 household (28.3%) living below poverty.
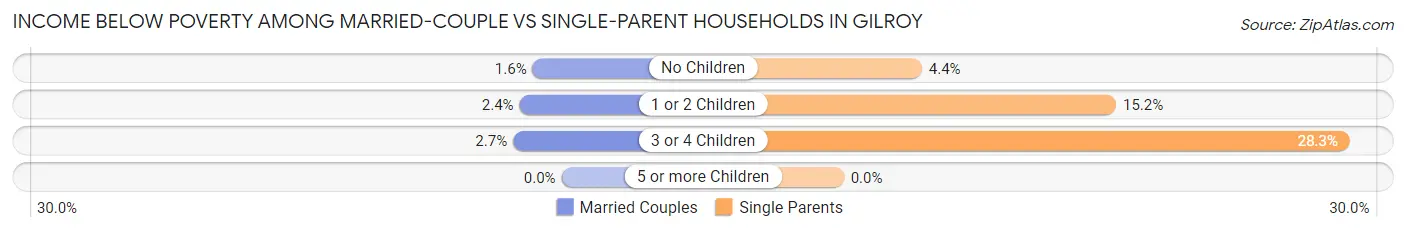
| Children | Married-Couple Families | Single-Parent Households |
| No Children | 72 (1.6%) | 71 (4.4%) |
| 1 or 2 Children | 85 (2.4%) | 315 (15.2%) |
| 3 or 4 Children | 45 (2.7%) | 97 (28.3%) |
| 5 or more Children | 0 (0.0%) | 0 (0.0%) |
| Total | 202 (2.1%) | 483 (11.8%) |
Race in Gilroy
The most populous races in Gilroy are Hispanic or Latino (34,511 | 58.8%), White / Caucasian (26,397 | 45.0%), and Two or more Races (16,560 | 28.2%).
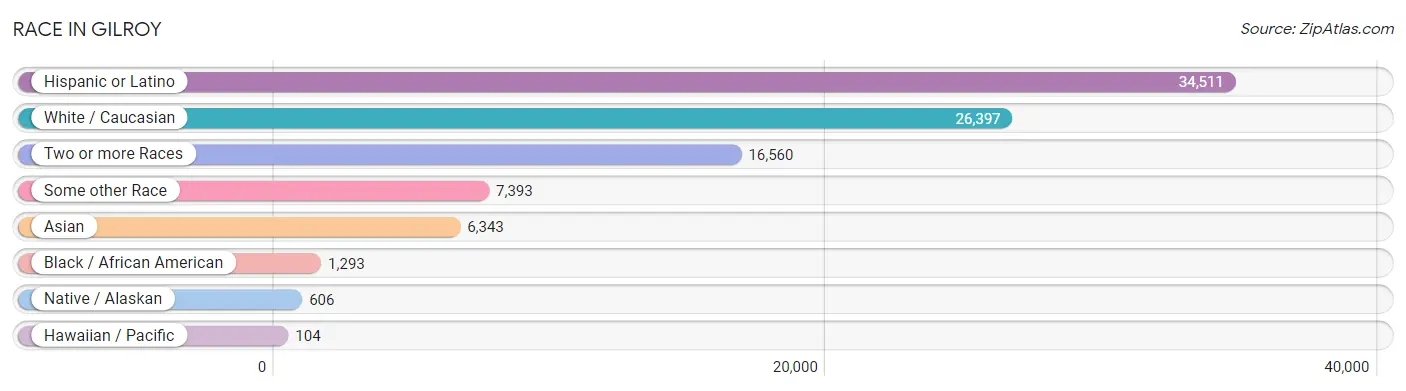
| Race | # Population | % Population |
| Asian | 6,343 | 10.8% |
| Black / African American | 1,293 | 2.2% |
| Hawaiian / Pacific | 104 | 0.2% |
| Hispanic or Latino | 34,511 | 58.8% |
| Native / Alaskan | 606 | 1.0% |
| White / Caucasian | 26,397 | 45.0% |
| Two or more Races | 16,560 | 28.2% |
| Some other Race | 7,393 | 12.6% |
| Total | 58,696 | 100.0% |
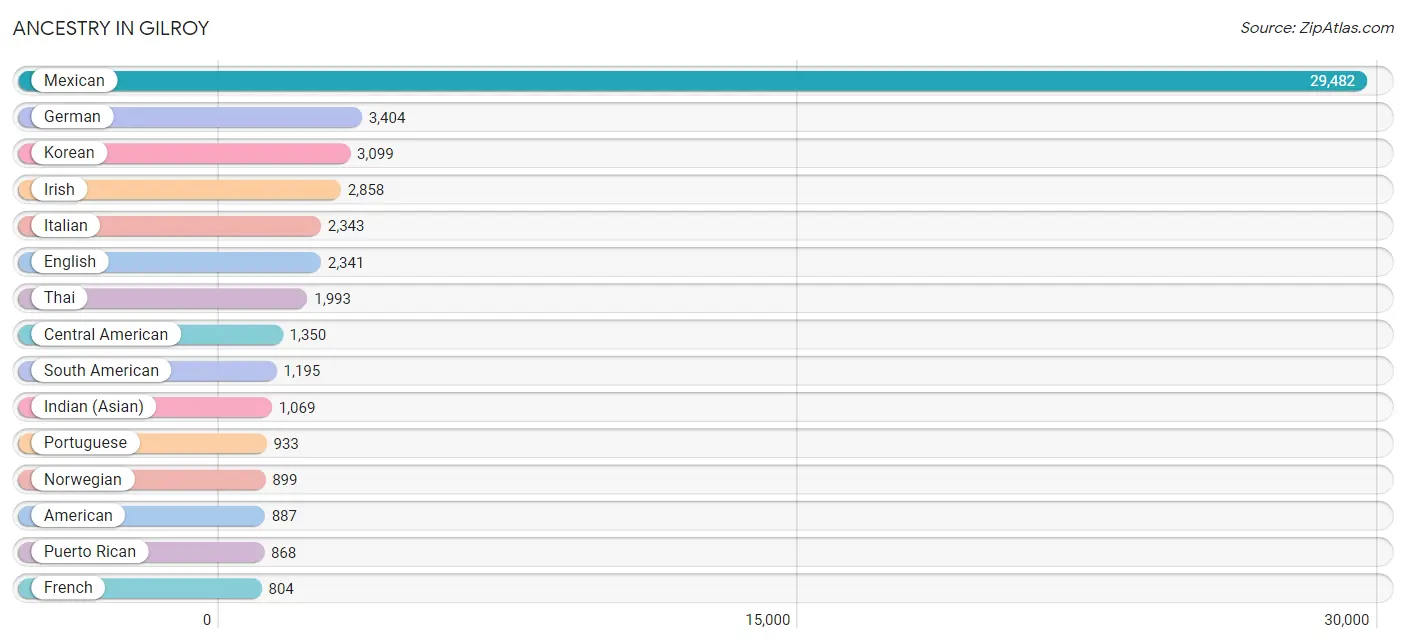
Ancestry in Gilroy
The most populous ancestries reported in Gilroy are Mexican (29,482 | 50.2%), German (3,404 | 5.8%), Korean (3,099 | 5.3%), Irish (2,858 | 4.9%), and Italian (2,343 | 4.0%), together accounting for 70.2% of all Gilroy residents.
| Ancestry | # Population | % Population |
| African | 58 | 0.1% |
| American | 887 | 1.5% |
| Apache | 74 | 0.1% |
| Arab | 199 | 0.3% |
| Argentinean | 307 | 0.5% |
| Assyrian / Chaldean / Syriac | 15 | 0.0% |
| Australian | 161 | 0.3% |
| Austrian | 116 | 0.2% |
| Bangladeshi | 75 | 0.1% |
| Basque | 70 | 0.1% |
| Bhutanese | 595 | 1.0% |
| Blackfeet | 19 | 0.0% |
| Bolivian | 28 | 0.1% |
| Brazilian | 8 | 0.0% |
| British | 263 | 0.4% |
| Burmese | 481 | 0.8% |
| Cambodian | 58 | 0.1% |
| Canadian | 26 | 0.0% |
| Central American | 1,350 | 2.3% |
| Central American Indian | 131 | 0.2% |
| Cherokee | 161 | 0.3% |
| Chilean | 45 | 0.1% |
| Choctaw | 9 | 0.0% |
| Colombian | 633 | 1.1% |
| Cuban | 321 | 0.5% |
| Czech | 30 | 0.1% |
| Czechoslovakian | 20 | 0.0% |
| Danish | 278 | 0.5% |
| Dutch | 514 | 0.9% |
| Eastern European | 112 | 0.2% |
| Ecuadorian | 13 | 0.0% |
| Egyptian | 91 | 0.2% |
| English | 2,341 | 4.0% |
| European | 702 | 1.2% |
| Filipino | 22 | 0.0% |
| Finnish | 90 | 0.2% |
| French | 804 | 1.4% |
| French Canadian | 144 | 0.3% |
| German | 3,404 | 5.8% |
| Greek | 151 | 0.3% |
| Guamanian / Chamorro | 202 | 0.3% |
| Guatemalan | 376 | 0.6% |
| Guyanese | 40 | 0.1% |
| Haitian | 28 | 0.1% |
| Honduran | 235 | 0.4% |
| Hopi | 36 | 0.1% |
| Hungarian | 212 | 0.4% |
| Icelander | 283 | 0.5% |
| Indian (Asian) | 1,069 | 1.8% |
| Indonesian | 5 | 0.0% |
| Inupiat | 194 | 0.3% |
| Iranian | 369 | 0.6% |
| Irish | 2,858 | 4.9% |
| Israeli | 10 | 0.0% |
| Italian | 2,343 | 4.0% |
| Japanese | 98 | 0.2% |
| Jordanian | 77 | 0.1% |
| Korean | 3,099 | 5.3% |
| Laotian | 101 | 0.2% |
| Latvian | 9 | 0.0% |
| Lebanese | 8 | 0.0% |
| Lithuanian | 14 | 0.0% |
| Malaysian | 88 | 0.2% |
| Mexican | 29,482 | 50.2% |
| Mexican American Indian | 527 | 0.9% |
| Native Hawaiian | 156 | 0.3% |
| Navajo | 111 | 0.2% |
| Nicaraguan | 132 | 0.2% |
| Nigerian | 8 | 0.0% |
| Northern European | 36 | 0.1% |
| Norwegian | 899 | 1.5% |
| Pakistani | 7 | 0.0% |
| Palestinian | 4 | 0.0% |
| Peruvian | 161 | 0.3% |
| Polish | 234 | 0.4% |
| Portuguese | 933 | 1.6% |
| Pueblo | 11 | 0.0% |
| Puerto Rican | 868 | 1.5% |
| Russian | 169 | 0.3% |
| Salvadoran | 567 | 1.0% |
| Samoan | 33 | 0.1% |
| Scandinavian | 95 | 0.2% |
| Scotch-Irish | 306 | 0.5% |
| Scottish | 591 | 1.0% |
| Slavic | 17 | 0.0% |
| Slovak | 17 | 0.0% |
| Somali | 14 | 0.0% |
| South African | 30 | 0.1% |
| South American | 1,195 | 2.0% |
| Spaniard | 338 | 0.6% |
| Spanish | 261 | 0.4% |
| Sri Lankan | 778 | 1.3% |
| Subsaharan African | 344 | 0.6% |
| Swedish | 441 | 0.7% |
| Swiss | 121 | 0.2% |
| Thai | 1,993 | 3.4% |
| Tongan | 164 | 0.3% |
| Turkish | 14 | 0.0% |
| Ukrainian | 147 | 0.3% |
| Venezuelan | 8 | 0.0% |
| Vietnamese | 141 | 0.2% |
| Welsh | 206 | 0.4% |
| Yaqui | 127 | 0.2% |
| Yugoslavian | 56 | 0.1% | View All 104 Rows |
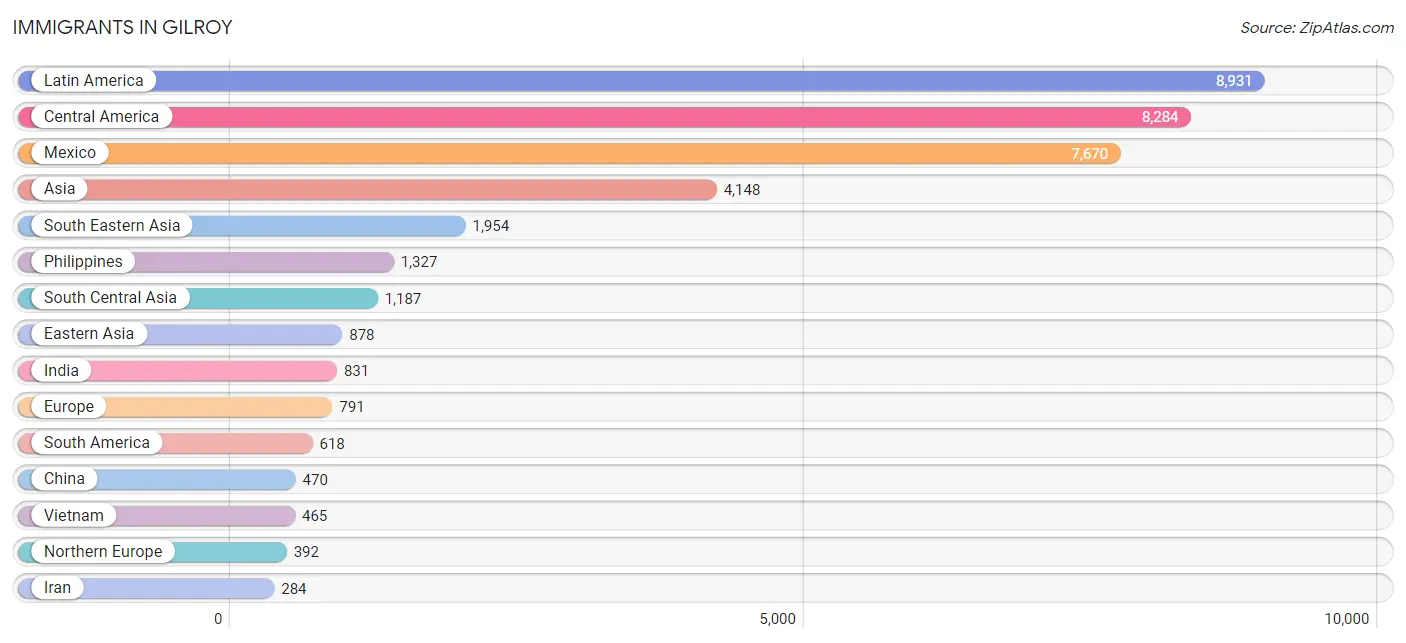
Immigrants in Gilroy
The most numerous immigrant groups reported in Gilroy came from Latin America (8,931 | 15.2%), Central America (8,284 | 14.1%), Mexico (7,670 | 13.1%), Asia (4,148 | 7.1%), and South Eastern Asia (1,954 | 3.3%), together accounting for 52.8% of all Gilroy residents.
| Immigration Origin | # Population | % Population |
| Africa | 241 | 0.4% |
| Argentina | 231 | 0.4% |
| Asia | 4,148 | 7.1% |
| Australia | 56 | 0.1% |
| Bangladesh | 42 | 0.1% |
| Bolivia | 7 | 0.0% |
| Cambodia | 87 | 0.2% |
| Cameroon | 124 | 0.2% |
| Canada | 144 | 0.3% |
| Caribbean | 29 | 0.1% |
| Central America | 8,284 | 14.1% |
| Chile | 9 | 0.0% |
| China | 470 | 0.8% |
| Colombia | 196 | 0.3% |
| Cuba | 20 | 0.0% |
| Denmark | 37 | 0.1% |
| Eastern Africa | 22 | 0.0% |
| Eastern Asia | 878 | 1.5% |
| Eastern Europe | 151 | 0.3% |
| Ecuador | 13 | 0.0% |
| Egypt | 20 | 0.0% |
| El Salvador | 277 | 0.5% |
| England | 57 | 0.1% |
| Europe | 791 | 1.3% |
| Fiji | 22 | 0.0% |
| Germany | 54 | 0.1% |
| Greece | 17 | 0.0% |
| Guatemala | 193 | 0.3% |
| Guyana | 40 | 0.1% |
| Haiti | 9 | 0.0% |
| Honduras | 99 | 0.2% |
| Hong Kong | 54 | 0.1% |
| India | 831 | 1.4% |
| Iran | 284 | 0.5% |
| Iraq | 15 | 0.0% |
| Israel | 14 | 0.0% |
| Italy | 44 | 0.1% |
| Japan | 131 | 0.2% |
| Jordan | 72 | 0.1% |
| Korea | 277 | 0.5% |
| Latin America | 8,931 | 15.2% |
| Lithuania | 14 | 0.0% |
| Malaysia | 12 | 0.0% |
| Mexico | 7,670 | 13.1% |
| Middle Africa | 124 | 0.2% |
| Nicaragua | 45 | 0.1% |
| Nigeria | 8 | 0.0% |
| Northern Africa | 20 | 0.0% |
| Northern Europe | 392 | 0.7% |
| Oceania | 108 | 0.2% |
| Pakistan | 30 | 0.1% |
| Peru | 84 | 0.1% |
| Philippines | 1,327 | 2.3% |
| Portugal | 119 | 0.2% |
| Russia | 60 | 0.1% |
| Singapore | 11 | 0.0% |
| South Africa | 67 | 0.1% |
| South America | 618 | 1.1% |
| South Central Asia | 1,187 | 2.0% |
| South Eastern Asia | 1,954 | 3.3% |
| Southern Europe | 194 | 0.3% |
| Spain | 14 | 0.0% |
| Sweden | 27 | 0.1% |
| Taiwan | 69 | 0.1% |
| Thailand | 31 | 0.1% |
| Turkey | 14 | 0.0% |
| Uganda | 22 | 0.0% |
| Ukraine | 29 | 0.1% |
| Venezuela | 23 | 0.0% |
| Vietnam | 465 | 0.8% |
| Western Africa | 8 | 0.0% |
| Western Asia | 129 | 0.2% |
| Western Europe | 54 | 0.1% | View All 73 Rows |
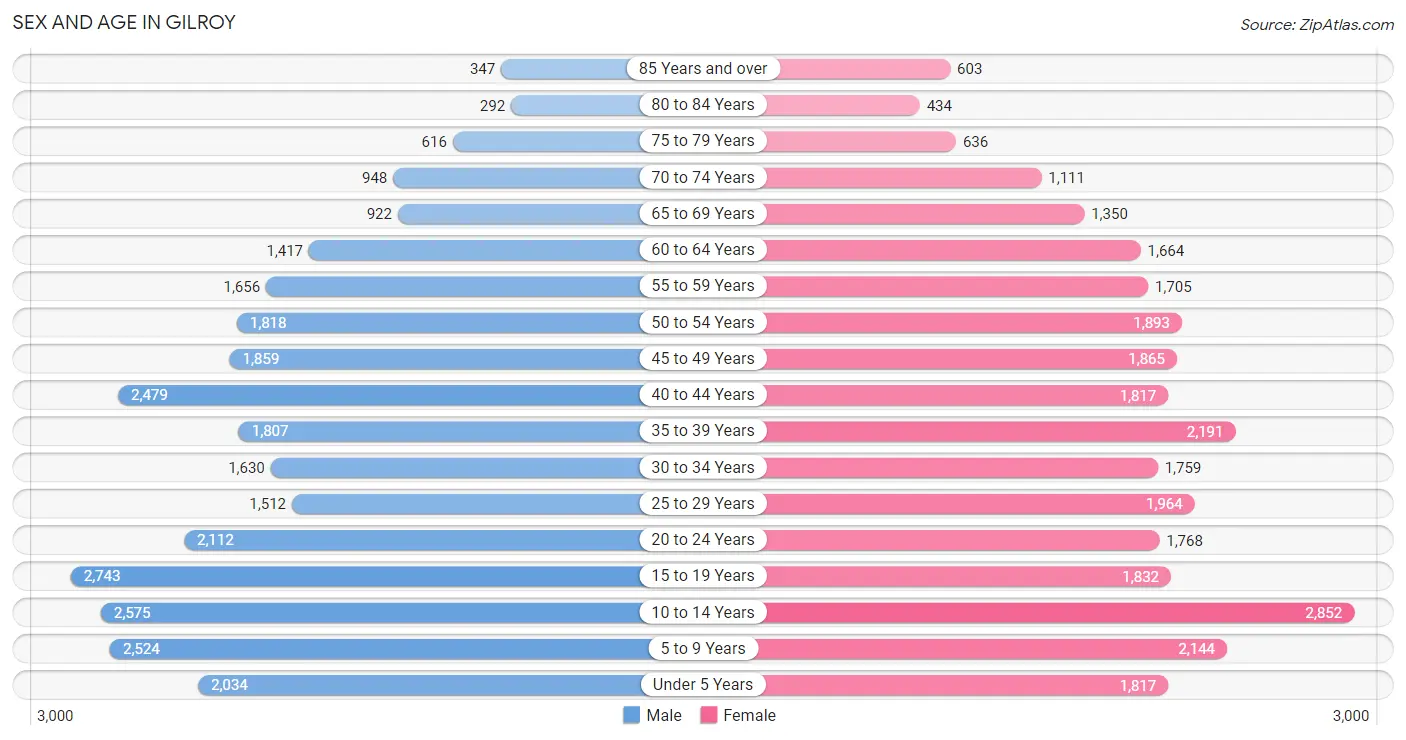
Sex and Age in Gilroy
Sex and Age in Gilroy
The most populous age groups in Gilroy are 15 to 19 Years (2,743 | 9.4%) for men and 10 to 14 Years (2,852 | 9.7%) for women.
| Age Bracket | Male | Female |
| Under 5 Years | 2,034 (6.9%) | 1,817 (6.2%) |
| 5 to 9 Years | 2,524 (8.6%) | 2,144 (7.3%) |
| 10 to 14 Years | 2,575 (8.8%) | 2,852 (9.7%) |
| 15 to 19 Years | 2,743 (9.4%) | 1,832 (6.2%) |
| 20 to 24 Years | 2,112 (7.2%) | 1,768 (6.0%) |
| 25 to 29 Years | 1,512 (5.2%) | 1,964 (6.7%) |
| 30 to 34 Years | 1,630 (5.6%) | 1,759 (6.0%) |
| 35 to 39 Years | 1,807 (6.2%) | 2,191 (7.4%) |
| 40 to 44 Years | 2,479 (8.5%) | 1,817 (6.2%) |
| 45 to 49 Years | 1,859 (6.4%) | 1,865 (6.3%) |
| 50 to 54 Years | 1,818 (6.2%) | 1,893 (6.4%) |
| 55 to 59 Years | 1,656 (5.7%) | 1,705 (5.8%) |
| 60 to 64 Years | 1,417 (4.8%) | 1,664 (5.7%) |
| 65 to 69 Years | 922 (3.2%) | 1,350 (4.6%) |
| 70 to 74 Years | 948 (3.2%) | 1,111 (3.8%) |
| 75 to 79 Years | 616 (2.1%) | 636 (2.2%) |
| 80 to 84 Years | 292 (1.0%) | 434 (1.5%) |
| 85 Years and over | 347 (1.2%) | 603 (2.1%) |
| Total | 29,291 (100.0%) | 29,405 (100.0%) |
Families and Households in Gilroy
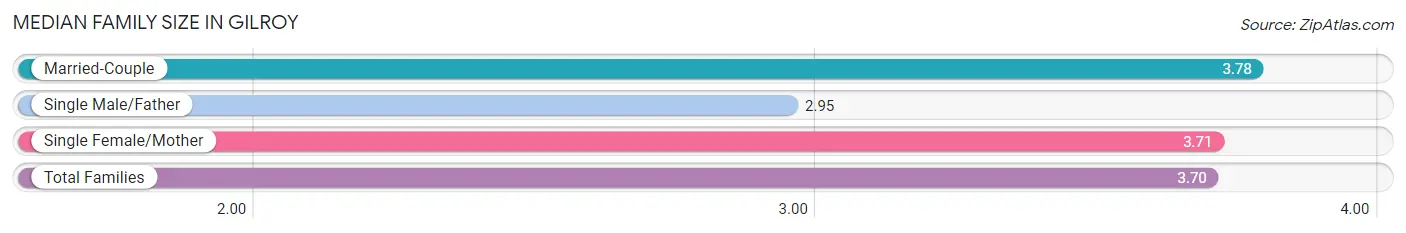
Median Family Size in Gilroy
The median family size in Gilroy is 3.70 persons per family, with married-couple families (9,775 | 70.5%) accounting for the largest median family size of 3.78 persons per family. On the other hand, single male/father families (1,100 | 7.9%) represent the smallest median family size with 2.95 persons per family.
| Family Type | # Families | Family Size |
| Married-Couple | 9,775 (70.5%) | 3.78 |
| Single Male/Father | 1,100 (7.9%) | 2.95 |
| Single Female/Mother | 2,983 (21.5%) | 3.71 |
| Total Families | 13,858 (100.0%) | 3.70 |
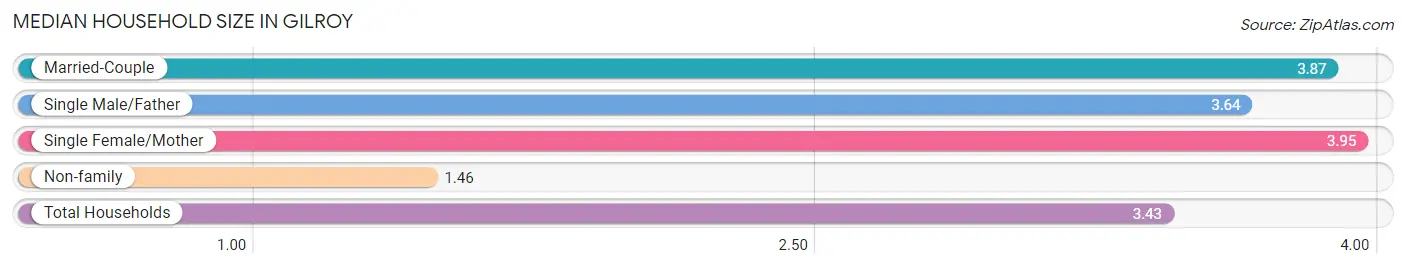
Median Household Size in Gilroy
The median household size in Gilroy is 3.43 persons per household, with single female/mother households (2,983 | 17.6%) accounting for the largest median household size of 3.95 persons per household. non-family households (3,111 | 18.3%) represent the smallest median household size with 1.46 persons per household.
| Household Type | # Households | Household Size |
| Married-Couple | 9,775 (57.6%) | 3.87 |
| Single Male/Father | 1,100 (6.5%) | 3.64 |
| Single Female/Mother | 2,983 (17.6%) | 3.95 |
| Non-family | 3,111 (18.3%) | 1.46 |
| Total Households | 16,969 (100.0%) | 3.43 |
Household Size by Marriage Status in Gilroy
Out of a total of 16,969 households in Gilroy, 13,858 (81.7%) are family households, while 3,111 (18.3%) are nonfamily households. The most numerous type of family households are 2-person households, comprising 4,082, and the most common type of nonfamily households are 1-person households, comprising 2,272.
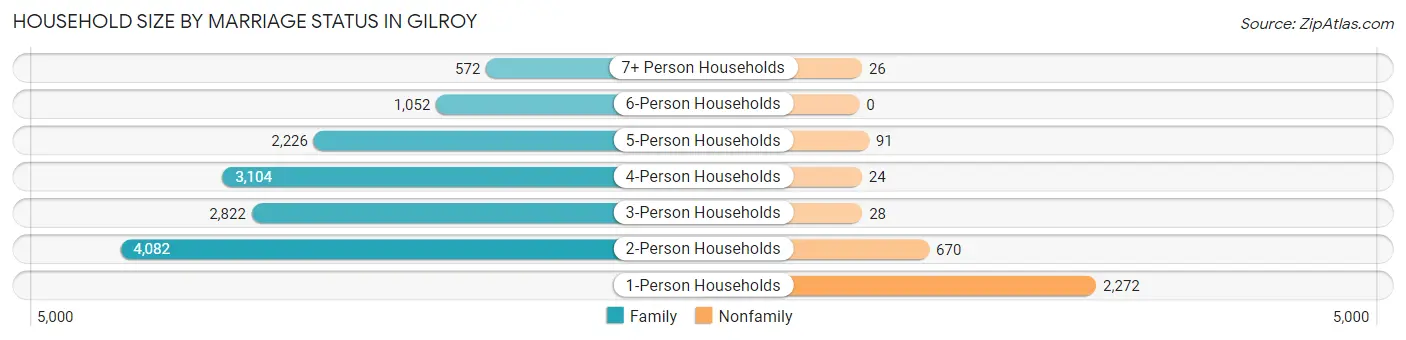
| Household Size | Family Households | Nonfamily Households |
| 1-Person Households | - | 2,272 (13.4%) |
| 2-Person Households | 4,082 (24.1%) | 670 (4.0%) |
| 3-Person Households | 2,822 (16.6%) | 28 (0.2%) |
| 4-Person Households | 3,104 (18.3%) | 24 (0.1%) |
| 5-Person Households | 2,226 (13.1%) | 91 (0.5%) |
| 6-Person Households | 1,052 (6.2%) | 0 (0.0%) |
| 7+ Person Households | 572 (3.4%) | 26 (0.2%) |
| Total | 13,858 (81.7%) | 3,111 (18.3%) |
Female Fertility in Gilroy
Fertility by Age in Gilroy
Average fertility rate in Gilroy is 52.0 births per 1,000 women. Women in the age bracket of 20 to 34 years have the highest fertility rate with 98.0 births per 1,000 women. Women in the age bracket of 20 to 34 years acount for 76.1% of all women with births.
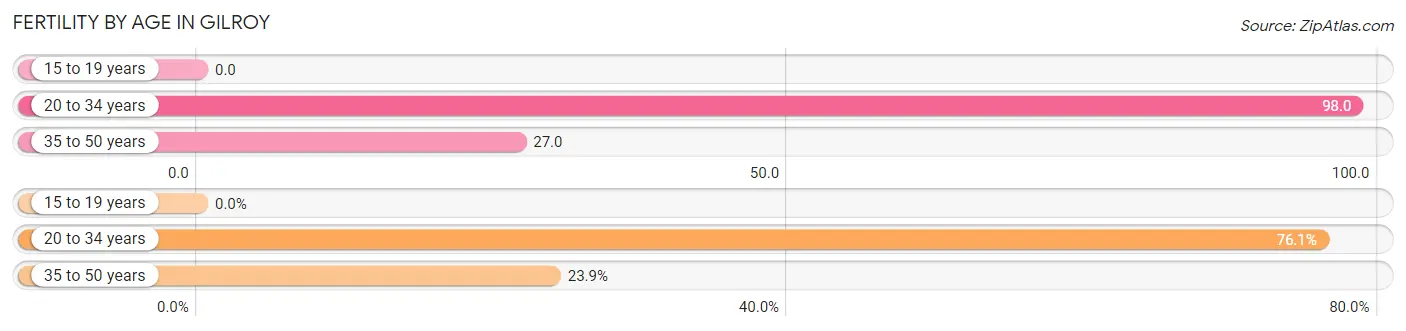
| Age Bracket | Women with Births | Births / 1,000 Women |
| 15 to 19 years | 0 (0.0%) | 0.0 |
| 20 to 34 years | 537 (76.1%) | 98.0 |
| 35 to 50 years | 169 (23.9%) | 27.0 |
| Total | 706 (100.0%) | 52.0 |
Fertility by Age by Marriage Status in Gilroy
77.2% of women with births (706) in Gilroy are married. The highest percentage of unmarried women with births falls into 20 to 34 years age bracket with 30.0% of them unmarried at the time of birth, while the lowest percentage of unmarried women with births belong to 35 to 50 years age bracket with 0.0% of them unmarried.
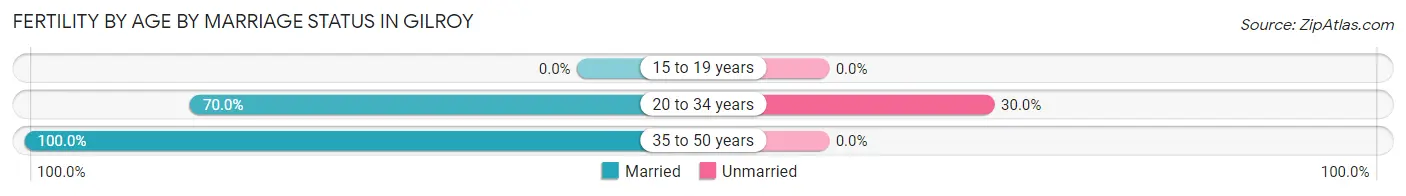
| Age Bracket | Married | Unmarried |
| 15 to 19 years | 0 (0.0%) | 0 (0.0%) |
| 20 to 34 years | 376 (70.0%) | 161 (30.0%) |
| 35 to 50 years | 169 (100.0%) | 0 (0.0%) |
| Total | 545 (77.2%) | 161 (22.8%) |
Fertility by Education in Gilroy
Average fertility rate in Gilroy is 52.0 births per 1,000 women. Women with the education attainment of college or associate's degree have the highest fertility rate of 77.0 births per 1,000 women, while women with the education attainment of high school diploma have the lowest fertility at 13.0 births per 1,000 women. Women with the education attainment of college or associate's degree represent 53.8% of all women with births.
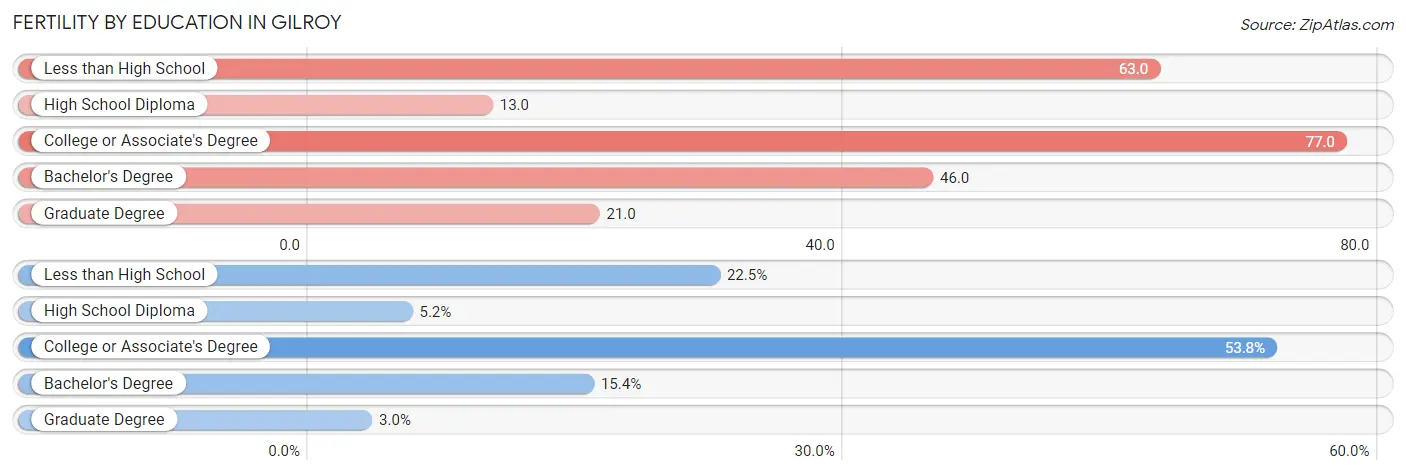
| Educational Attainment | Women with Births | Births / 1,000 Women |
| Less than High School | 159 (22.5%) | 63.0 |
| High School Diploma | 37 (5.2%) | 13.0 |
| College or Associate's Degree | 380 (53.8%) | 77.0 |
| Bachelor's Degree | 109 (15.4%) | 46.0 |
| Graduate Degree | 21 (3.0%) | 21.0 |
| Total | 706 (100.0%) | 52.0 |
Fertility by Education by Marriage Status in Gilroy
22.8% of women with births in Gilroy are unmarried. Women with the educational attainment of bachelor's degree are most likely to be married with 100.0% of them married at childbirth, while women with the educational attainment of high school diploma are least likely to be married with 59.5% of them unmarried at childbirth.
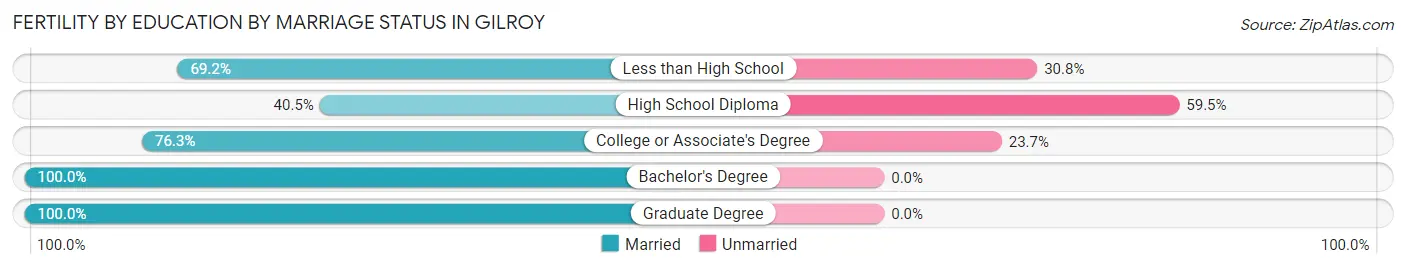
| Educational Attainment | Married | Unmarried |
| Less than High School | 110 (69.2%) | 49 (30.8%) |
| High School Diploma | 15 (40.5%) | 22 (59.5%) |
| College or Associate's Degree | 290 (76.3%) | 90 (23.7%) |
| Bachelor's Degree | 109 (100.0%) | 0 (0.0%) |
| Graduate Degree | 21 (100.0%) | 0 (0.0%) |
| Total | 545 (77.2%) | 161 (22.8%) |
Employment Characteristics in Gilroy
Employment by Class of Employer in Gilroy
Among the 26,162 employed individuals in Gilroy, private company employees (18,295 | 69.9%), local government employees (2,801 | 10.7%), and not-for-profit organizations (1,580 | 6.0%) make up the most common classes of employment.
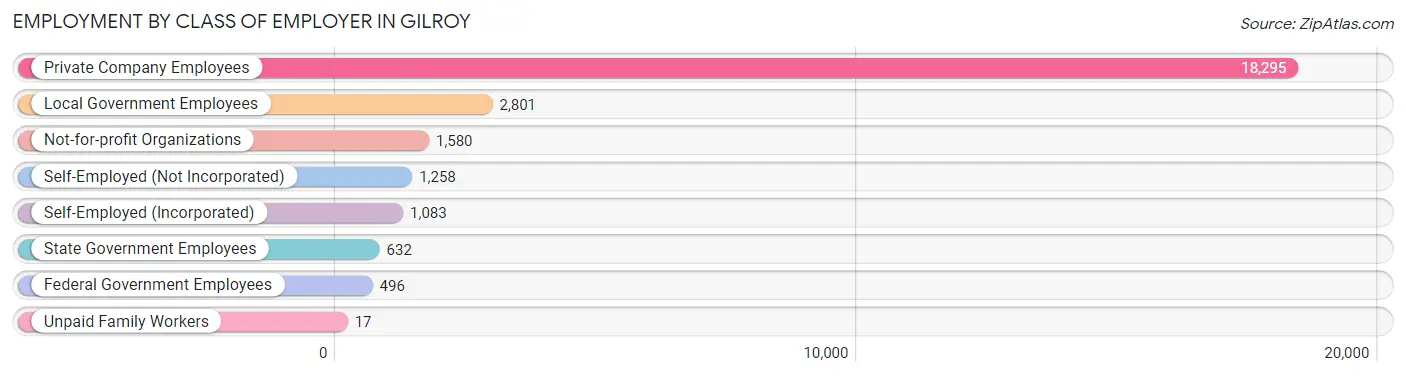
| Employer Class | # Employees | % Employees |
| Private Company Employees | 18,295 | 69.9% |
| Self-Employed (Incorporated) | 1,083 | 4.1% |
| Self-Employed (Not Incorporated) | 1,258 | 4.8% |
| Not-for-profit Organizations | 1,580 | 6.0% |
| Local Government Employees | 2,801 | 10.7% |
| State Government Employees | 632 | 2.4% |
| Federal Government Employees | 496 | 1.9% |
| Unpaid Family Workers | 17 | 0.1% |
| Total | 26,162 | 100.0% |
Employment Status by Age in Gilroy
According to the labor force statistics for Gilroy, out of the total population over 16 years of age (43,659), 67.1% or 29,295 individuals are in the labor force, with 5.9% or 1,728 of them unemployed. The age group with the highest labor force participation rate is 30 to 34 years, with 89.4% or 3,030 individuals in the labor force. Within the labor force, the 16 to 19 years age range has the highest percentage of unemployed individuals, with 15.6% or 248 of them being unemployed.
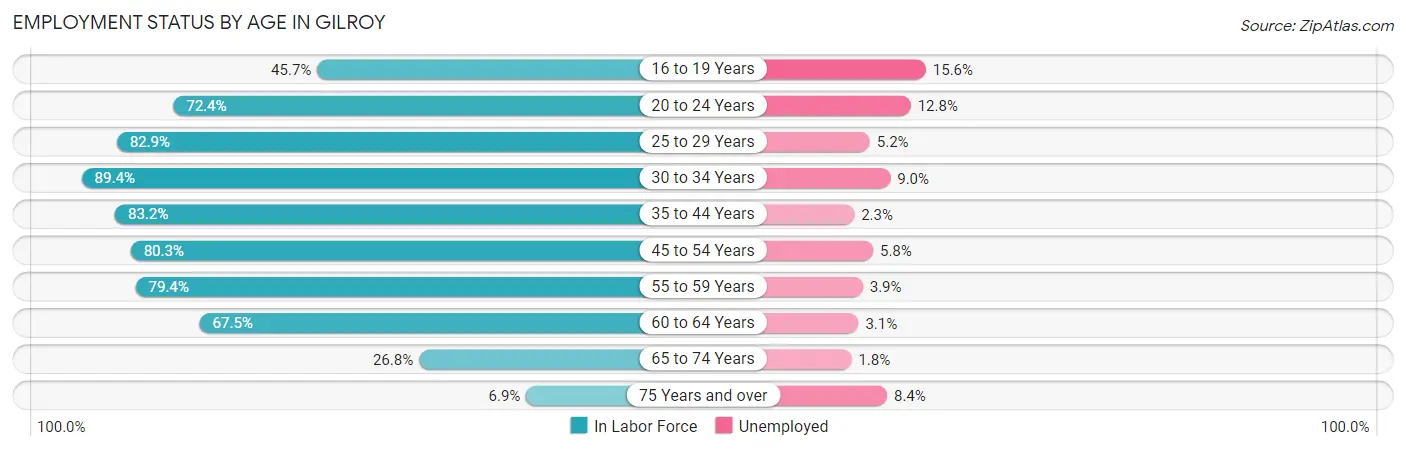
| Age Bracket | In Labor Force | Unemployed |
| 16 to 19 Years | 1,592 (45.7%) | 248 (15.6%) |
| 20 to 24 Years | 2,809 (72.4%) | 360 (12.8%) |
| 25 to 29 Years | 2,882 (82.9%) | 150 (5.2%) |
| 30 to 34 Years | 3,030 (89.4%) | 273 (9.0%) |
| 35 to 44 Years | 6,901 (83.2%) | 159 (2.3%) |
| 45 to 54 Years | 5,970 (80.3%) | 346 (5.8%) |
| 55 to 59 Years | 2,669 (79.4%) | 104 (3.9%) |
| 60 to 64 Years | 2,080 (67.5%) | 64 (3.1%) |
| 65 to 74 Years | 1,161 (26.8%) | 21 (1.8%) |
| 75 Years and over | 202 (6.9%) | 17 (8.4%) |
| Total | 29,295 (67.1%) | 1,728 (5.9%) |
Employment Status by Educational Attainment in Gilroy
According to labor force statistics for Gilroy, 81.0% of individuals (23,519) out of the total population between 25 and 64 years of age (29,036) are in the labor force, with 4.6% or 1,082 of them being unemployed. The group with the highest labor force participation rate are those with the educational attainment of bachelor's degree or higher, with 85.4% or 7,133 individuals in the labor force. Within the labor force, individuals with less than high school education have the highest percentage of unemployment, with 7.6% or 261 of them being unemployed.
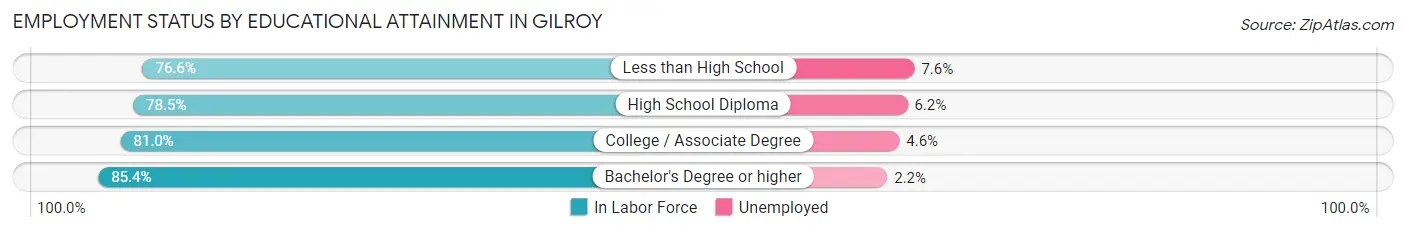
| Educational Attainment | In Labor Force | Unemployed |
| Less than High School | 3,435 (76.6%) | 341 (7.6%) |
| High School Diploma | 4,928 (78.5%) | 389 (6.2%) |
| College / Associate Degree | 8,037 (81.0%) | 456 (4.6%) |
| Bachelor's Degree or higher | 7,133 (85.4%) | 184 (2.2%) |
| Total | 23,519 (81.0%) | 1,336 (4.6%) |
Employment Occupations by Sex in Gilroy
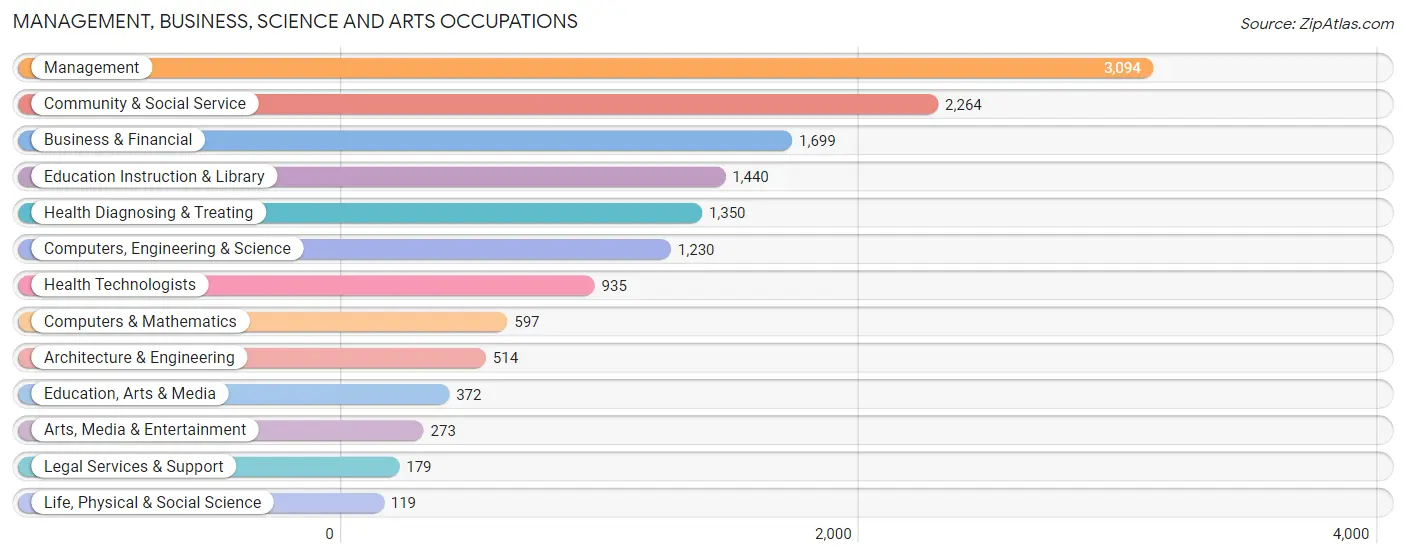
Management, Business, Science and Arts Occupations
The most common Management, Business, Science and Arts occupations in Gilroy are Management (3,094 | 11.2%), Community & Social Service (2,264 | 8.2%), Business & Financial (1,699 | 6.2%), Education Instruction & Library (1,440 | 5.2%), and Health Diagnosing & Treating (1,350 | 4.9%).
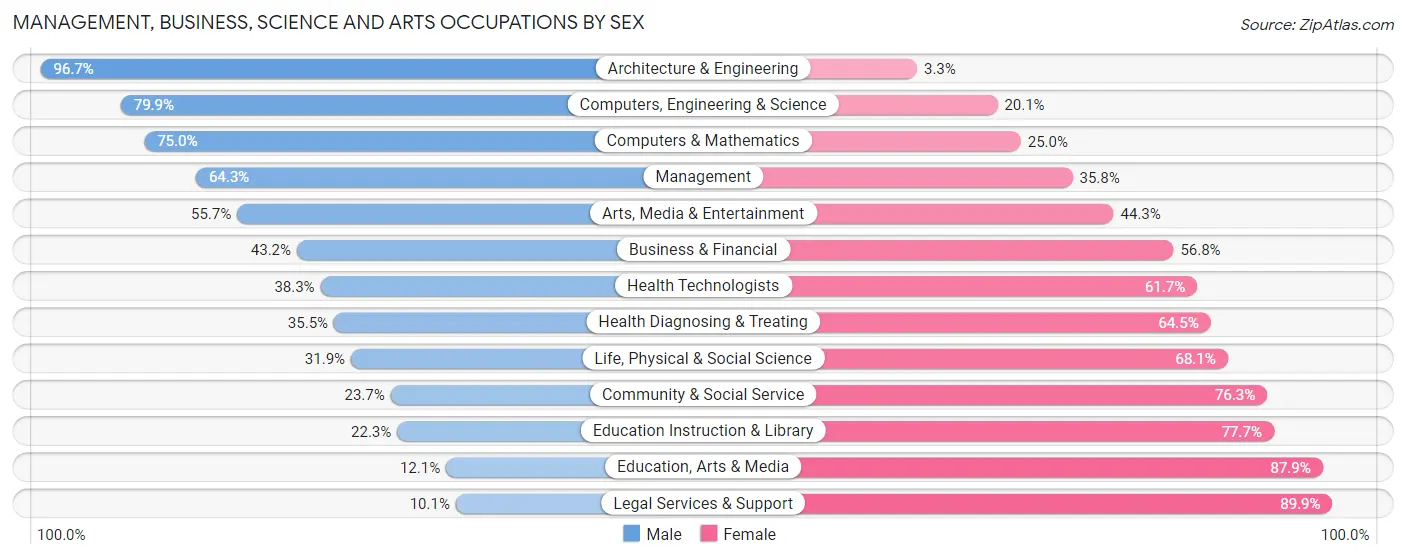
Management, Business, Science and Arts Occupations by Sex
Within the Management, Business, Science and Arts occupations in Gilroy, the most male-oriented occupations are Architecture & Engineering (96.7%), Computers, Engineering & Science (79.9%), and Computers & Mathematics (75.0%), while the most female-oriented occupations are Legal Services & Support (89.9%), Education, Arts & Media (87.9%), and Education Instruction & Library (77.7%).
| Occupation | Male | Female |
| Management | 1,988 (64.2%) | 1,106 (35.7%) |
| Business & Financial | 734 (43.2%) | 965 (56.8%) |
| Computers, Engineering & Science | 983 (79.9%) | 247 (20.1%) |
| Computers & Mathematics | 448 (75.0%) | 149 (25.0%) |
| Architecture & Engineering | 497 (96.7%) | 17 (3.3%) |
| Life, Physical & Social Science | 38 (31.9%) | 81 (68.1%) |
| Community & Social Service | 536 (23.7%) | 1,728 (76.3%) |
| Education, Arts & Media | 45 (12.1%) | 327 (87.9%) |
| Legal Services & Support | 18 (10.1%) | 161 (89.9%) |
| Education Instruction & Library | 321 (22.3%) | 1,119 (77.7%) |
| Arts, Media & Entertainment | 152 (55.7%) | 121 (44.3%) |
| Health Diagnosing & Treating | 479 (35.5%) | 871 (64.5%) |
| Health Technologists | 358 (38.3%) | 577 (61.7%) |
| Total (Category) | 4,720 (49.0%) | 4,917 (51.0%) |
| Total (Overall) | 15,070 (54.7%) | 12,471 (45.3%) |
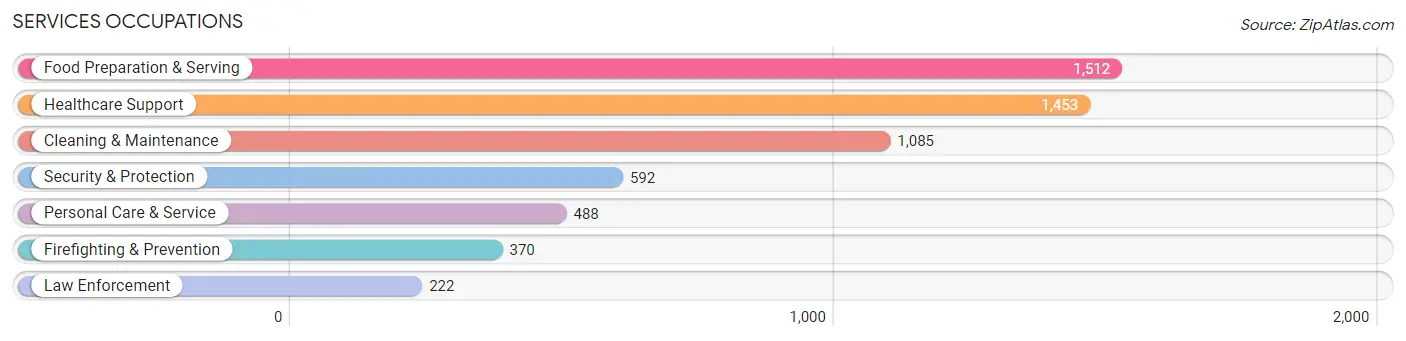
Services Occupations
The most common Services occupations in Gilroy are Food Preparation & Serving (1,512 | 5.5%), Healthcare Support (1,453 | 5.3%), Cleaning & Maintenance (1,085 | 3.9%), Security & Protection (592 | 2.1%), and Personal Care & Service (488 | 1.8%).
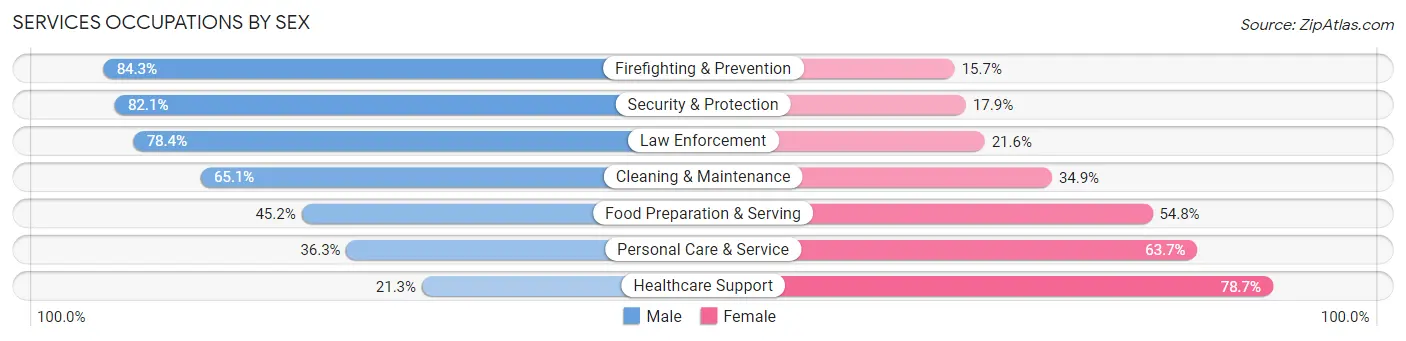
Services Occupations by Sex
Within the Services occupations in Gilroy, the most male-oriented occupations are Firefighting & Prevention (84.3%), Security & Protection (82.1%), and Law Enforcement (78.4%), while the most female-oriented occupations are Healthcare Support (78.7%), Personal Care & Service (63.7%), and Food Preparation & Serving (54.8%).
| Occupation | Male | Female |
| Healthcare Support | 310 (21.3%) | 1,143 (78.7%) |
| Security & Protection | 486 (82.1%) | 106 (17.9%) |
| Firefighting & Prevention | 312 (84.3%) | 58 (15.7%) |
| Law Enforcement | 174 (78.4%) | 48 (21.6%) |
| Food Preparation & Serving | 683 (45.2%) | 829 (54.8%) |
| Cleaning & Maintenance | 706 (65.1%) | 379 (34.9%) |
| Personal Care & Service | 177 (36.3%) | 311 (63.7%) |
| Total (Category) | 2,362 (46.0%) | 2,768 (54.0%) |
| Total (Overall) | 15,070 (54.7%) | 12,471 (45.3%) |
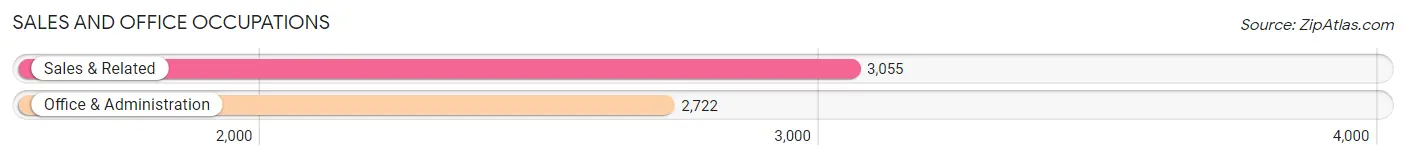
Sales and Office Occupations
The most common Sales and Office occupations in Gilroy are Sales & Related (3,055 | 11.1%), and Office & Administration (2,722 | 9.9%).
Sales and Office Occupations by Sex
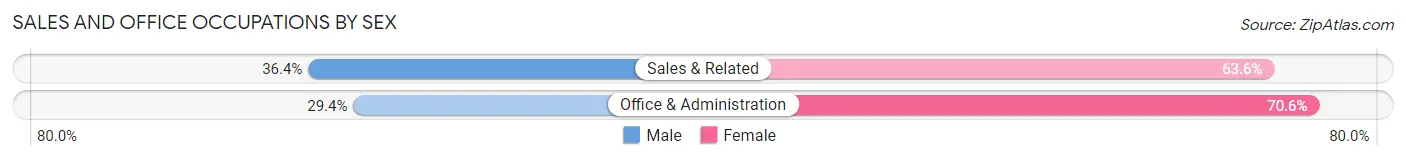
| Occupation | Male | Female |
| Sales & Related | 1,111 (36.4%) | 1,944 (63.6%) |
| Office & Administration | 801 (29.4%) | 1,921 (70.6%) |
| Total (Category) | 1,912 (33.1%) | 3,865 (66.9%) |
| Total (Overall) | 15,070 (54.7%) | 12,471 (45.3%) |
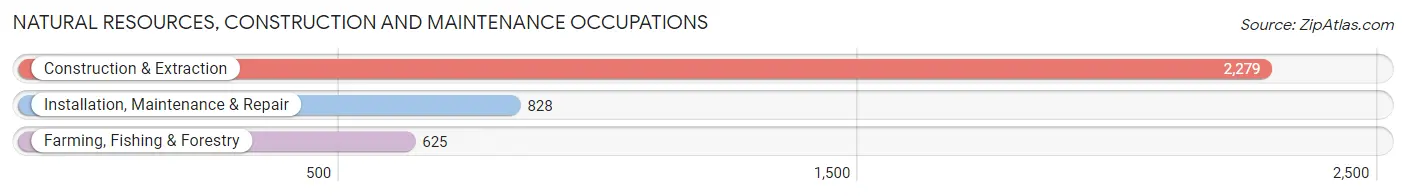
Natural Resources, Construction and Maintenance Occupations
The most common Natural Resources, Construction and Maintenance occupations in Gilroy are Construction & Extraction (2,279 | 8.3%), Installation, Maintenance & Repair (828 | 3.0%), and Farming, Fishing & Forestry (625 | 2.3%).
Natural Resources, Construction and Maintenance Occupations by Sex
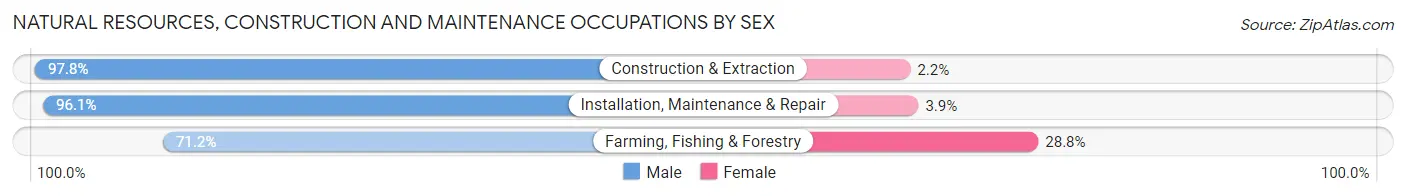
| Occupation | Male | Female |
| Farming, Fishing & Forestry | 445 (71.2%) | 180 (28.8%) |
| Construction & Extraction | 2,229 (97.8%) | 50 (2.2%) |
| Installation, Maintenance & Repair | 796 (96.1%) | 32 (3.9%) |
| Total (Category) | 3,470 (93.0%) | 262 (7.0%) |
| Total (Overall) | 15,070 (54.7%) | 12,471 (45.3%) |
Production, Transportation and Moving Occupations
The most common Production, Transportation and Moving occupations in Gilroy are Production (1,374 | 5.0%), Material Moving (1,040 | 3.8%), and Transportation (851 | 3.1%).
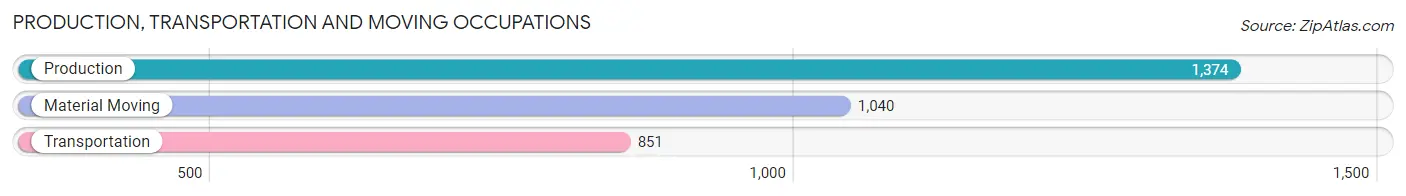
Production, Transportation and Moving Occupations by Sex
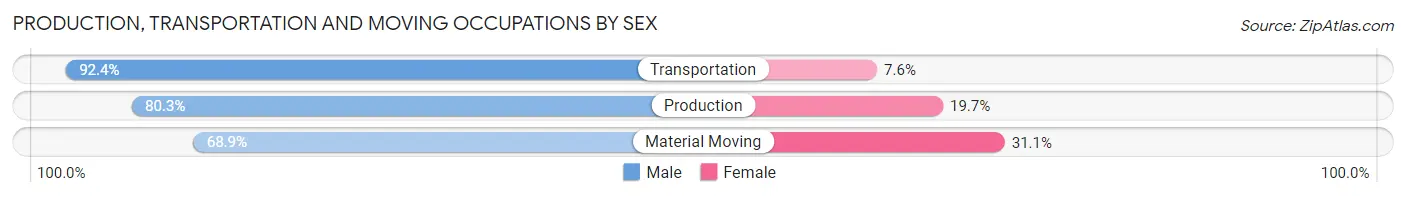
| Occupation | Male | Female |
| Production | 1,103 (80.3%) | 271 (19.7%) |
| Transportation | 786 (92.4%) | 65 (7.6%) |
| Material Moving | 717 (68.9%) | 323 (31.1%) |
| Total (Category) | 2,606 (79.8%) | 659 (20.2%) |
| Total (Overall) | 15,070 (54.7%) | 12,471 (45.3%) |
Employment Industries by Sex in Gilroy
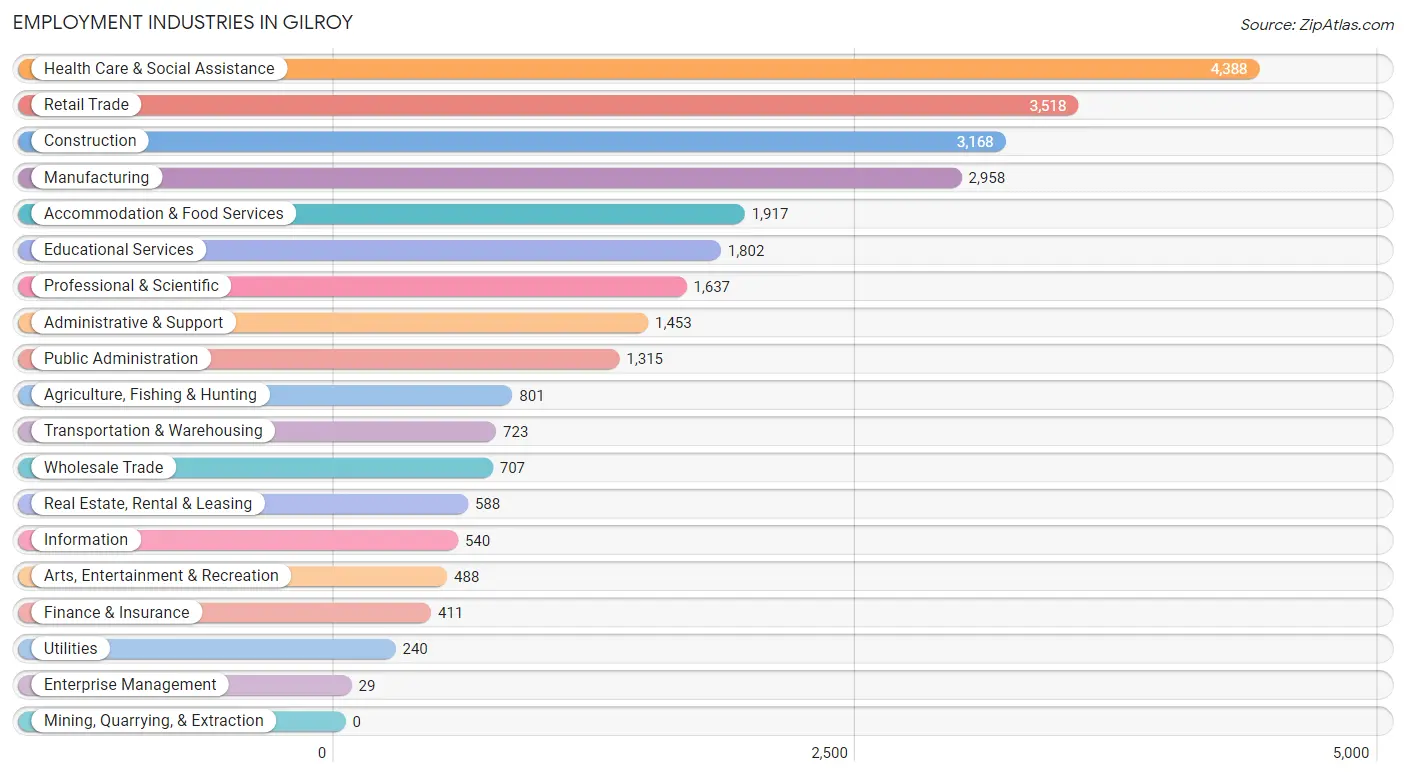
Employment Industries in Gilroy
The major employment industries in Gilroy include Health Care & Social Assistance (4,388 | 15.9%), Retail Trade (3,518 | 12.8%), Construction (3,168 | 11.5%), Manufacturing (2,958 | 10.7%), and Accommodation & Food Services (1,917 | 7.0%).
Employment Industries by Sex in Gilroy
The Gilroy industries that see more men than women are Construction (91.4%), Utilities (90.0%), and Transportation & Warehousing (87.0%), whereas the industries that tend to have a higher number of women are Enterprise Management (100.0%), Health Care & Social Assistance (78.9%), and Educational Services (73.6%).
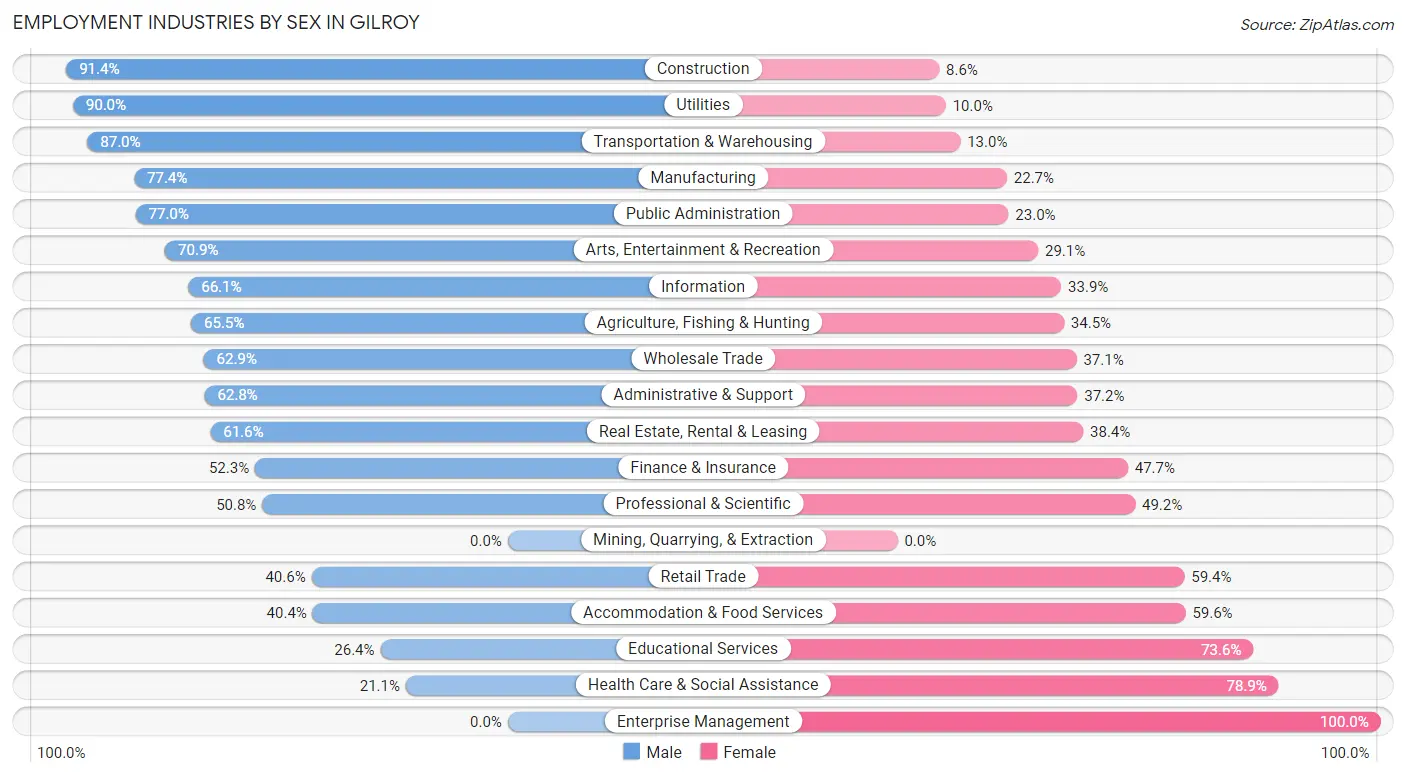
| Industry | Male | Female |
| Agriculture, Fishing & Hunting | 525 (65.5%) | 276 (34.5%) |
| Mining, Quarrying, & Extraction | 0 (0.0%) | 0 (0.0%) |
| Construction | 2,895 (91.4%) | 273 (8.6%) |
| Manufacturing | 2,288 (77.3%) | 670 (22.7%) |
| Wholesale Trade | 445 (62.9%) | 262 (37.1%) |
| Retail Trade | 1,429 (40.6%) | 2,089 (59.4%) |
| Transportation & Warehousing | 629 (87.0%) | 94 (13.0%) |
| Utilities | 216 (90.0%) | 24 (10.0%) |
| Information | 357 (66.1%) | 183 (33.9%) |
| Finance & Insurance | 215 (52.3%) | 196 (47.7%) |
| Real Estate, Rental & Leasing | 362 (61.6%) | 226 (38.4%) |
| Professional & Scientific | 832 (50.8%) | 805 (49.2%) |
| Enterprise Management | 0 (0.0%) | 29 (100.0%) |
| Administrative & Support | 912 (62.8%) | 541 (37.2%) |
| Educational Services | 475 (26.4%) | 1,327 (73.6%) |
| Health Care & Social Assistance | 926 (21.1%) | 3,462 (78.9%) |
| Arts, Entertainment & Recreation | 346 (70.9%) | 142 (29.1%) |
| Accommodation & Food Services | 774 (40.4%) | 1,143 (59.6%) |
| Public Administration | 1,013 (77.0%) | 302 (23.0%) |
| Total | 15,070 (54.7%) | 12,471 (45.3%) |
Education in Gilroy
School Enrollment in Gilroy
The most common levels of schooling among the 18,015 students in Gilroy are middle school (4,087 | 22.7%), high school (4,049 | 22.5%), and elementary school (3,911 | 21.7%).
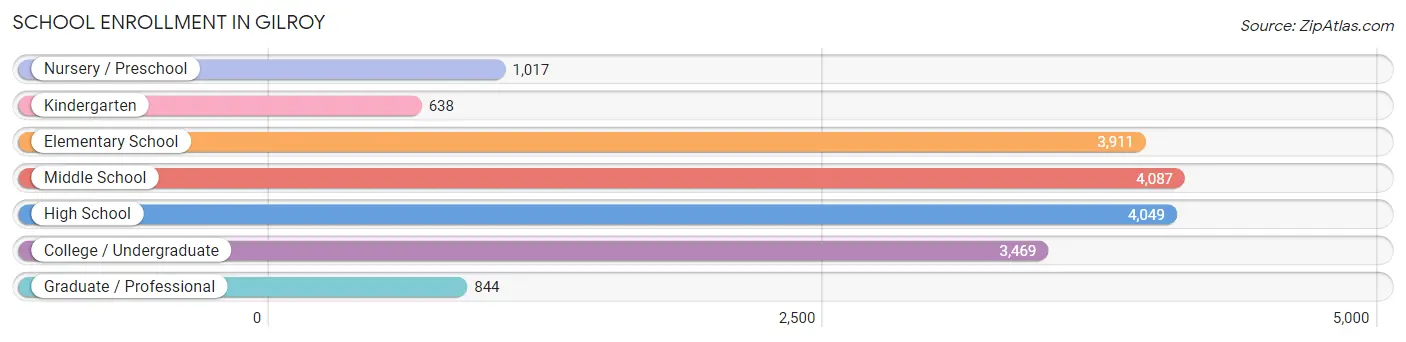
| School Level | # Students | % Students |
| Nursery / Preschool | 1,017 | 5.7% |
| Kindergarten | 638 | 3.5% |
| Elementary School | 3,911 | 21.7% |
| Middle School | 4,087 | 22.7% |
| High School | 4,049 | 22.5% |
| College / Undergraduate | 3,469 | 19.3% |
| Graduate / Professional | 844 | 4.7% |
| Total | 18,015 | 100.0% |
School Enrollment by Age by Funding Source in Gilroy
Out of a total of 18,015 students who are enrolled in schools in Gilroy, 2,396 (13.3%) attend a private institution, while the remaining 15,619 (86.7%) are enrolled in public schools. The age group of 3 to 4 year olds has the highest likelihood of being enrolled in private schools, with 226 (33.6% in the age bracket) enrolled. Conversely, the age group of 15 to 17 year olds has the lowest likelihood of being enrolled in a private school, with 2,462 (92.0% in the age bracket) attending a public institution.
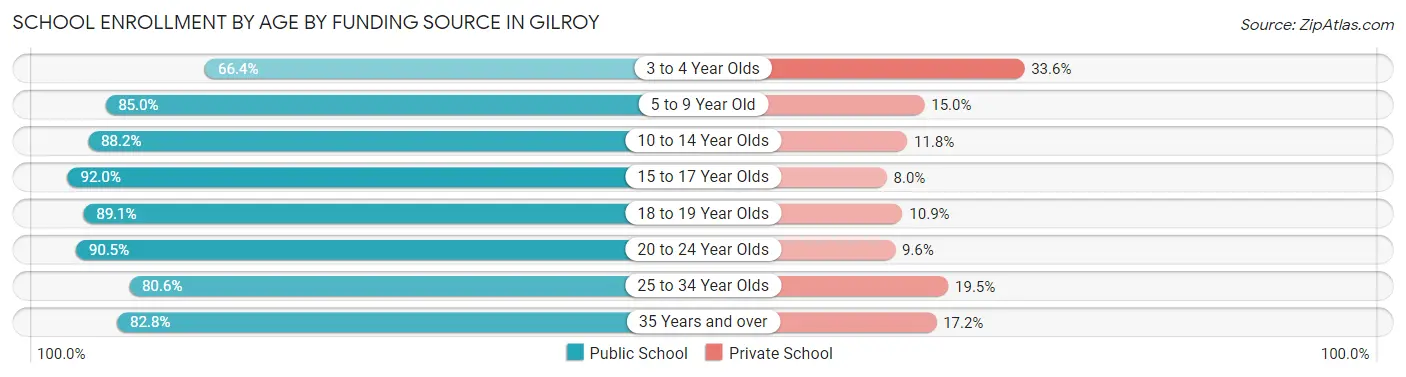
| Age Bracket | Public School | Private School |
| 3 to 4 Year Olds | 446 (66.4%) | 226 (33.6%) |
| 5 to 9 Year Old | 3,796 (85.0%) | 671 (15.0%) |
| 10 to 14 Year Olds | 4,772 (88.2%) | 639 (11.8%) |
| 15 to 17 Year Olds | 2,462 (92.0%) | 214 (8.0%) |
| 18 to 19 Year Olds | 977 (89.1%) | 120 (10.9%) |
| 20 to 24 Year Olds | 1,619 (90.4%) | 171 (9.6%) |
| 25 to 34 Year Olds | 845 (80.5%) | 204 (19.5%) |
| 35 Years and over | 706 (82.8%) | 147 (17.2%) |
| Total | 15,619 (86.7%) | 2,396 (13.3%) |
Educational Attainment by Field of Study in Gilroy
Business (2,244 | 20.0%), engineering (1,376 | 12.2%), science & technology (1,108 | 9.9%), computers & mathematics (807 | 7.2%), and social sciences (772 | 6.9%) are the most common fields of study among 11,234 individuals in Gilroy who have obtained a bachelor's degree or higher.
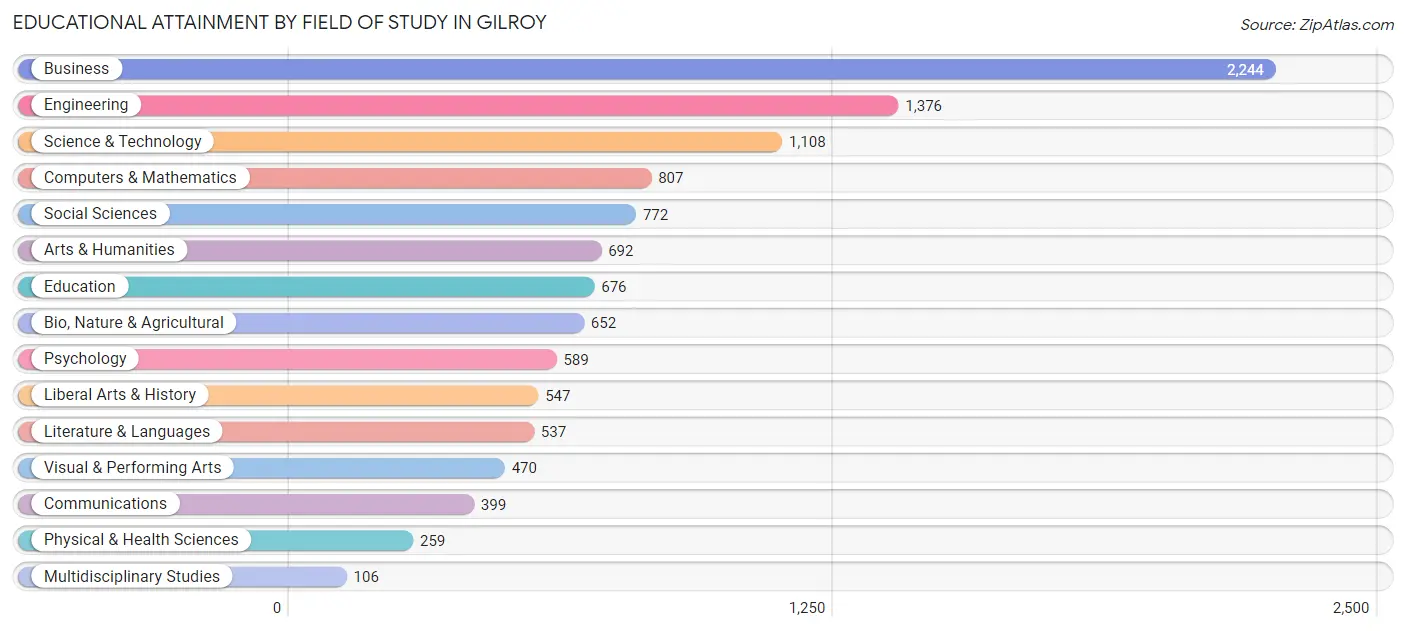
| Field of Study | # Graduates | % Graduates |
| Computers & Mathematics | 807 | 7.2% |
| Bio, Nature & Agricultural | 652 | 5.8% |
| Physical & Health Sciences | 259 | 2.3% |
| Psychology | 589 | 5.2% |
| Social Sciences | 772 | 6.9% |
| Engineering | 1,376 | 12.2% |
| Multidisciplinary Studies | 106 | 0.9% |
| Science & Technology | 1,108 | 9.9% |
| Business | 2,244 | 20.0% |
| Education | 676 | 6.0% |
| Literature & Languages | 537 | 4.8% |
| Liberal Arts & History | 547 | 4.9% |
| Visual & Performing Arts | 470 | 4.2% |
| Communications | 399 | 3.5% |
| Arts & Humanities | 692 | 6.2% |
| Total | 11,234 | 100.0% |
Transportation & Commute in Gilroy
Vehicle Availability by Sex in Gilroy
The most prevalent vehicle ownership categories in Gilroy are males with 2 vehicles (5,021, accounting for 34.4%) and females with 2 vehicles (4,007, making up 43.6%).
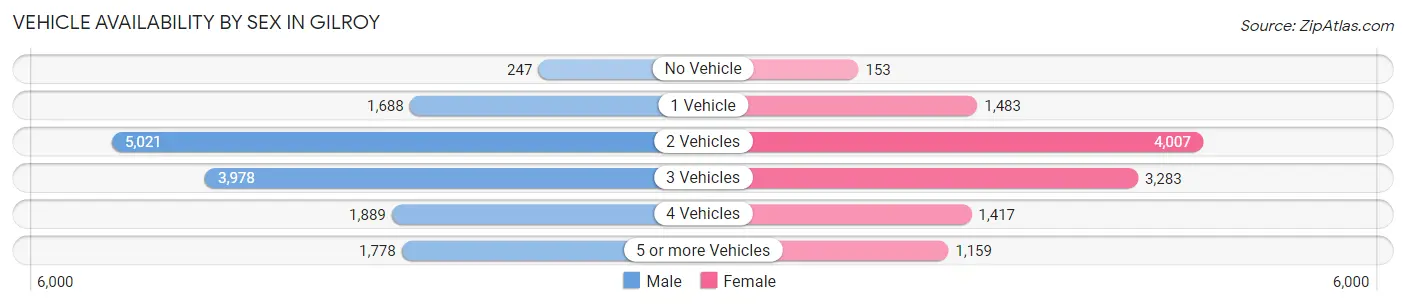
| Vehicles Available | Male | Female |
| No Vehicle | 247 (1.7%) | 153 (1.3%) |
| 1 Vehicle | 1,688 (11.6%) | 1,483 (12.9%) |
| 2 Vehicles | 5,021 (34.4%) | 4,007 (34.8%) |
| 3 Vehicles | 3,978 (27.2%) | 3,283 (28.5%) |
| 4 Vehicles | 1,889 (12.9%) | 1,417 (12.3%) |
| 5 or more Vehicles | 1,778 (12.2%) | 1,159 (10.1%) |
| Total | 14,601 (100.0%) | 11,502 (100.0%) |
Commute Time in Gilroy
The most frequently occuring commute durations in Gilroy are 45 to 59 minutes (3,505 commuters, 15.1%), 10 to 14 minutes (3,455 commuters, 14.8%), and 60 to 89 minutes (3,178 commuters, 13.7%).
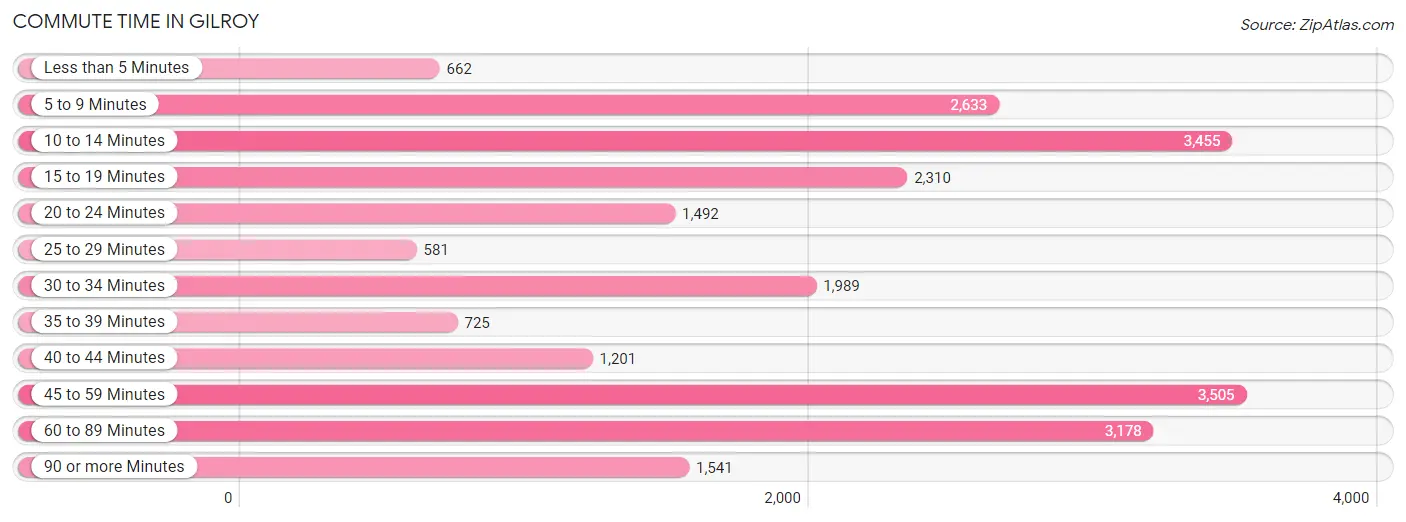
| Commute Time | # Commuters | % Commuters |
| Less than 5 Minutes | 662 | 2.8% |
| 5 to 9 Minutes | 2,633 | 11.3% |
| 10 to 14 Minutes | 3,455 | 14.8% |
| 15 to 19 Minutes | 2,310 | 9.9% |
| 20 to 24 Minutes | 1,492 | 6.4% |
| 25 to 29 Minutes | 581 | 2.5% |
| 30 to 34 Minutes | 1,989 | 8.6% |
| 35 to 39 Minutes | 725 | 3.1% |
| 40 to 44 Minutes | 1,201 | 5.2% |
| 45 to 59 Minutes | 3,505 | 15.1% |
| 60 to 89 Minutes | 3,178 | 13.7% |
| 90 or more Minutes | 1,541 | 6.6% |
Commute Time by Sex in Gilroy
The most common commute times in Gilroy are 60 to 89 minutes (2,048 commuters, 15.7%) for males and 10 to 14 minutes (2,019 commuters, 19.7%) for females.
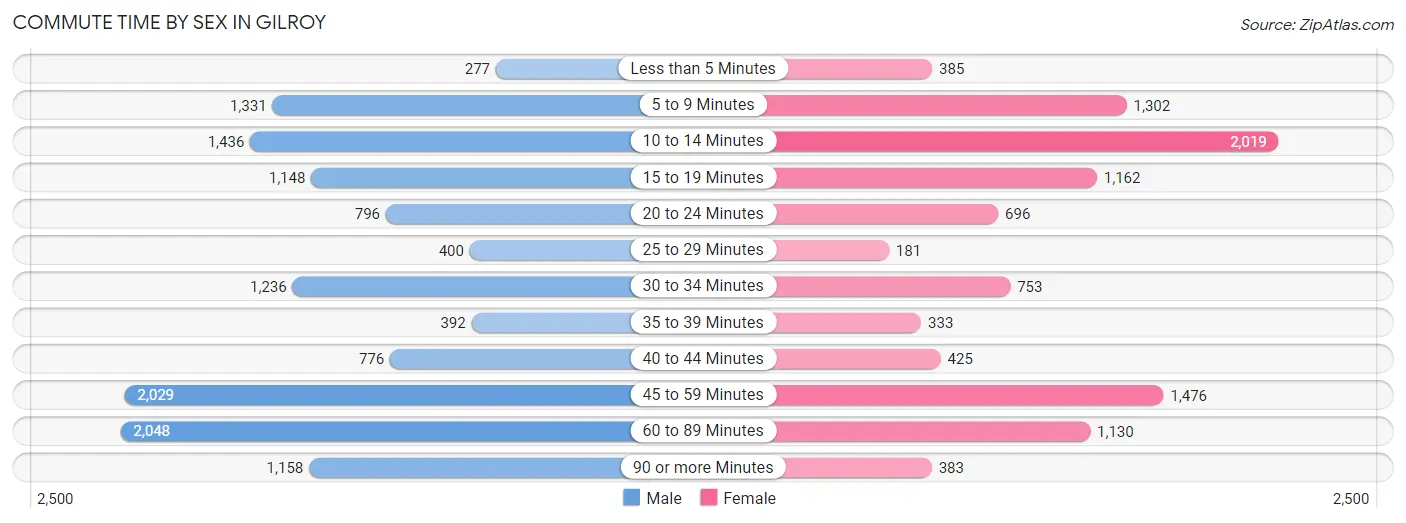
| Commute Time | Male | Female |
| Less than 5 Minutes | 277 (2.1%) | 385 (3.8%) |
| 5 to 9 Minutes | 1,331 (10.2%) | 1,302 (12.7%) |
| 10 to 14 Minutes | 1,436 (11.0%) | 2,019 (19.7%) |
| 15 to 19 Minutes | 1,148 (8.8%) | 1,162 (11.3%) |
| 20 to 24 Minutes | 796 (6.1%) | 696 (6.8%) |
| 25 to 29 Minutes | 400 (3.1%) | 181 (1.8%) |
| 30 to 34 Minutes | 1,236 (9.5%) | 753 (7.3%) |
| 35 to 39 Minutes | 392 (3.0%) | 333 (3.3%) |
| 40 to 44 Minutes | 776 (6.0%) | 425 (4.2%) |
| 45 to 59 Minutes | 2,029 (15.6%) | 1,476 (14.4%) |
| 60 to 89 Minutes | 2,048 (15.7%) | 1,130 (11.0%) |
| 90 or more Minutes | 1,158 (8.9%) | 383 (3.7%) |
Time of Departure to Work by Sex in Gilroy
The most frequent times of departure to work in Gilroy are 12:00 AM to 4:59 AM (1,790, 13.7%) for males and 8:00 AM to 8:29 AM (1,370, 13.4%) for females.
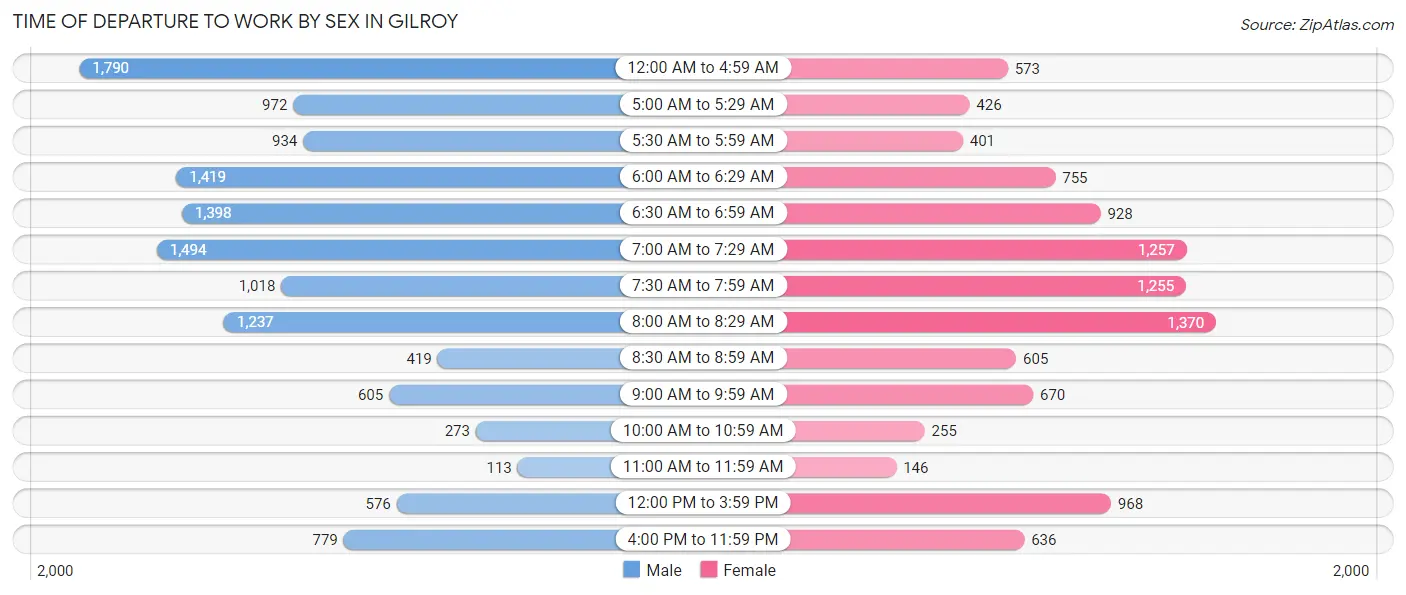
| Time of Departure | Male | Female |
| 12:00 AM to 4:59 AM | 1,790 (13.7%) | 573 (5.6%) |
| 5:00 AM to 5:29 AM | 972 (7.5%) | 426 (4.2%) |
| 5:30 AM to 5:59 AM | 934 (7.2%) | 401 (3.9%) |
| 6:00 AM to 6:29 AM | 1,419 (10.9%) | 755 (7.4%) |
| 6:30 AM to 6:59 AM | 1,398 (10.7%) | 928 (9.1%) |
| 7:00 AM to 7:29 AM | 1,494 (11.5%) | 1,257 (12.3%) |
| 7:30 AM to 7:59 AM | 1,018 (7.8%) | 1,255 (12.2%) |
| 8:00 AM to 8:29 AM | 1,237 (9.5%) | 1,370 (13.4%) |
| 8:30 AM to 8:59 AM | 419 (3.2%) | 605 (5.9%) |
| 9:00 AM to 9:59 AM | 605 (4.6%) | 670 (6.5%) |
| 10:00 AM to 10:59 AM | 273 (2.1%) | 255 (2.5%) |
| 11:00 AM to 11:59 AM | 113 (0.9%) | 146 (1.4%) |
| 12:00 PM to 3:59 PM | 576 (4.4%) | 968 (9.5%) |
| 4:00 PM to 11:59 PM | 779 (6.0%) | 636 (6.2%) |
| Total | 13,027 (100.0%) | 10,245 (100.0%) |
Housing Occupancy in Gilroy
Occupancy by Ownership in Gilroy
Of the total 16,969 dwellings in Gilroy, owner-occupied units account for 10,789 (63.6%), while renter-occupied units make up 6,180 (36.4%).
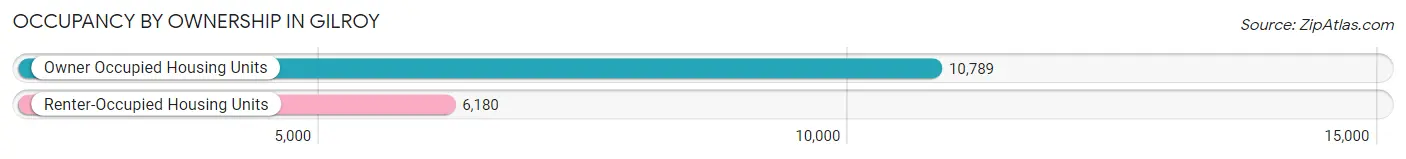
| Occupancy | # Housing Units | % Housing Units |
| Owner Occupied Housing Units | 10,789 | 63.6% |
| Renter-Occupied Housing Units | 6,180 | 36.4% |
| Total Occupied Housing Units | 16,969 | 100.0% |
Occupancy by Household Size in Gilroy
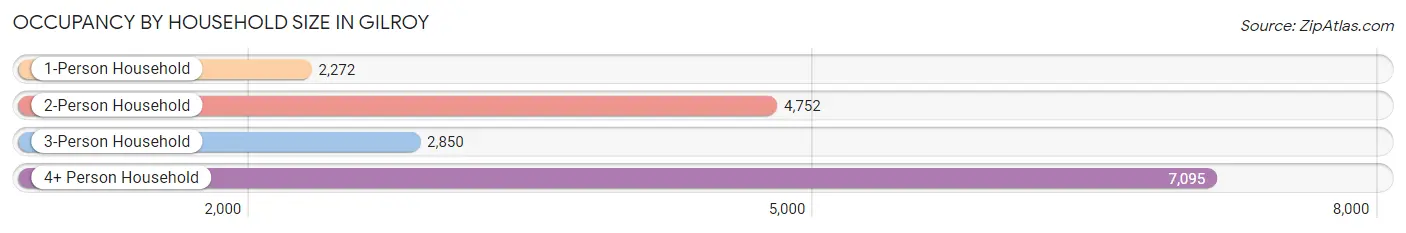
| Household Size | # Housing Units | % Housing Units |
| 1-Person Household | 2,272 | 13.4% |
| 2-Person Household | 4,752 | 28.0% |
| 3-Person Household | 2,850 | 16.8% |
| 4+ Person Household | 7,095 | 41.8% |
| Total Housing Units | 16,969 | 100.0% |
Occupancy by Ownership by Household Size in Gilroy
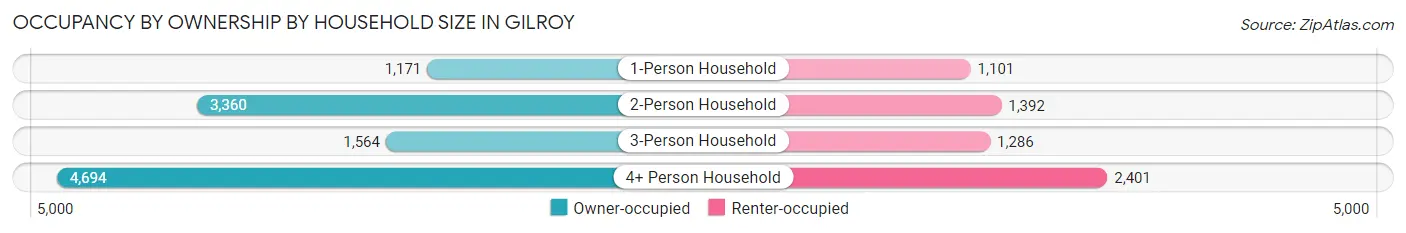
| Household Size | Owner-occupied | Renter-occupied |
| 1-Person Household | 1,171 (51.5%) | 1,101 (48.5%) |
| 2-Person Household | 3,360 (70.7%) | 1,392 (29.3%) |
| 3-Person Household | 1,564 (54.9%) | 1,286 (45.1%) |
| 4+ Person Household | 4,694 (66.2%) | 2,401 (33.8%) |
| Total Housing Units | 10,789 (63.6%) | 6,180 (36.4%) |
Occupancy by Educational Attainment in Gilroy
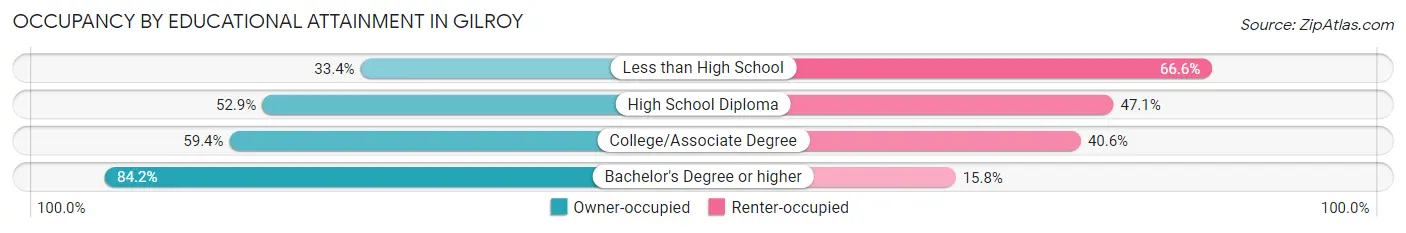
| Household Size | Owner-occupied | Renter-occupied |
| Less than High School | 673 (33.4%) | 1,341 (66.6%) |
| High School Diploma | 1,661 (52.9%) | 1,477 (47.1%) |
| College/Associate Degree | 3,584 (59.4%) | 2,450 (40.6%) |
| Bachelor's Degree or higher | 4,871 (84.2%) | 912 (15.8%) |
Occupancy by Age of Householder in Gilroy
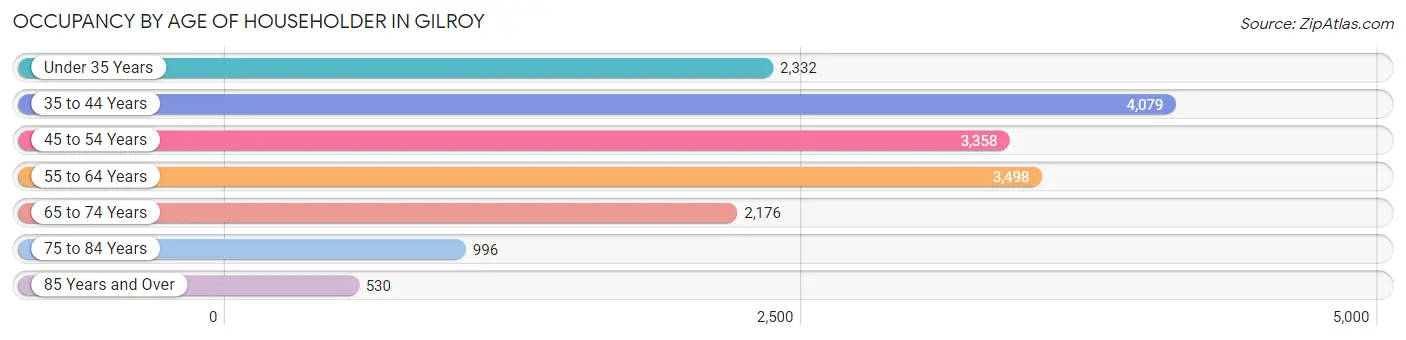
| Age Bracket | # Households | % Households |
| Under 35 Years | 2,332 | 13.7% |
| 35 to 44 Years | 4,079 | 24.0% |
| 45 to 54 Years | 3,358 | 19.8% |
| 55 to 64 Years | 3,498 | 20.6% |
| 65 to 74 Years | 2,176 | 12.8% |
| 75 to 84 Years | 996 | 5.9% |
| 85 Years and Over | 530 | 3.1% |
| Total | 16,969 | 100.0% |
Housing Finances in Gilroy
Median Income by Occupancy in Gilroy
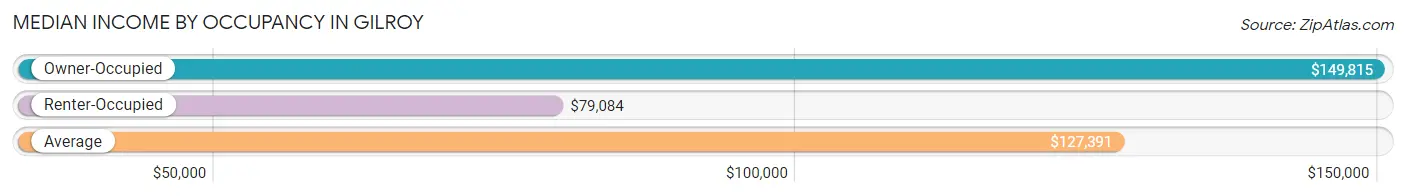
| Occupancy Type | # Households | Median Income |
| Owner-Occupied | 10,789 (63.6%) | $149,815 |
| Renter-Occupied | 6,180 (36.4%) | $79,084 |
| Average | 16,969 (100.0%) | $127,391 |
Occupancy by Householder Income Bracket in Gilroy
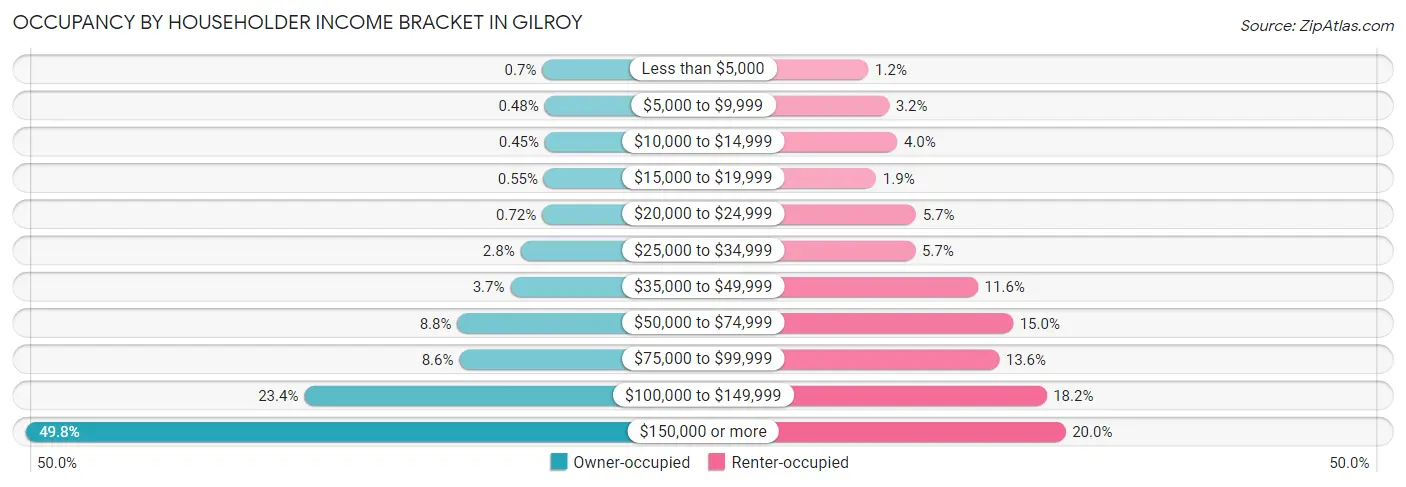
| Income Bracket | Owner-occupied | Renter-occupied |
| Less than $5,000 | 75 (0.7%) | 74 (1.2%) |
| $5,000 to $9,999 | 52 (0.5%) | 195 (3.2%) |
| $10,000 to $14,999 | 49 (0.4%) | 244 (4.0%) |
| $15,000 to $19,999 | 59 (0.5%) | 120 (1.9%) |
| $20,000 to $24,999 | 78 (0.7%) | 354 (5.7%) |
| $25,000 to $34,999 | 299 (2.8%) | 350 (5.7%) |
| $35,000 to $49,999 | 403 (3.7%) | 719 (11.6%) |
| $50,000 to $74,999 | 948 (8.8%) | 925 (15.0%) |
| $75,000 to $99,999 | 928 (8.6%) | 843 (13.6%) |
| $100,000 to $149,999 | 2,521 (23.4%) | 1,122 (18.2%) |
| $150,000 or more | 5,377 (49.8%) | 1,234 (20.0%) |
| Total | 10,789 (100.0%) | 6,180 (100.0%) |
Monthly Housing Cost Tiers in Gilroy
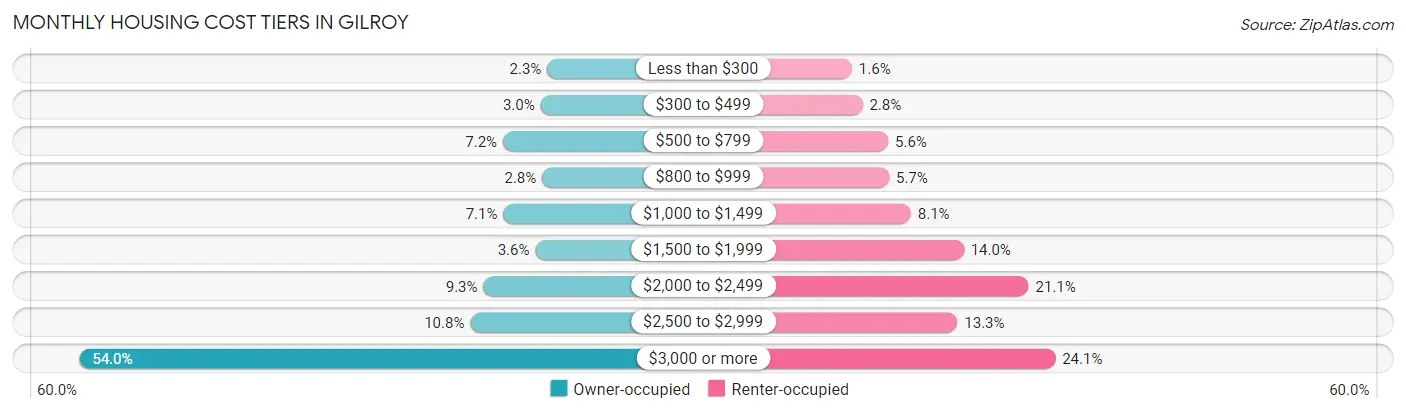
| Monthly Cost | Owner-occupied | Renter-occupied |
| Less than $300 | 245 (2.3%) | 99 (1.6%) |
| $300 to $499 | 324 (3.0%) | 171 (2.8%) |
| $500 to $799 | 772 (7.2%) | 346 (5.6%) |
| $800 to $999 | 305 (2.8%) | 352 (5.7%) |
| $1,000 to $1,499 | 768 (7.1%) | 501 (8.1%) |
| $1,500 to $1,999 | 386 (3.6%) | 862 (14.0%) |
| $2,000 to $2,499 | 1,006 (9.3%) | 1,305 (21.1%) |
| $2,500 to $2,999 | 1,162 (10.8%) | 819 (13.3%) |
| $3,000 or more | 5,821 (53.9%) | 1,487 (24.1%) |
| Total | 10,789 (100.0%) | 6,180 (100.0%) |
Physical Housing Characteristics in Gilroy
Housing Structures in Gilroy
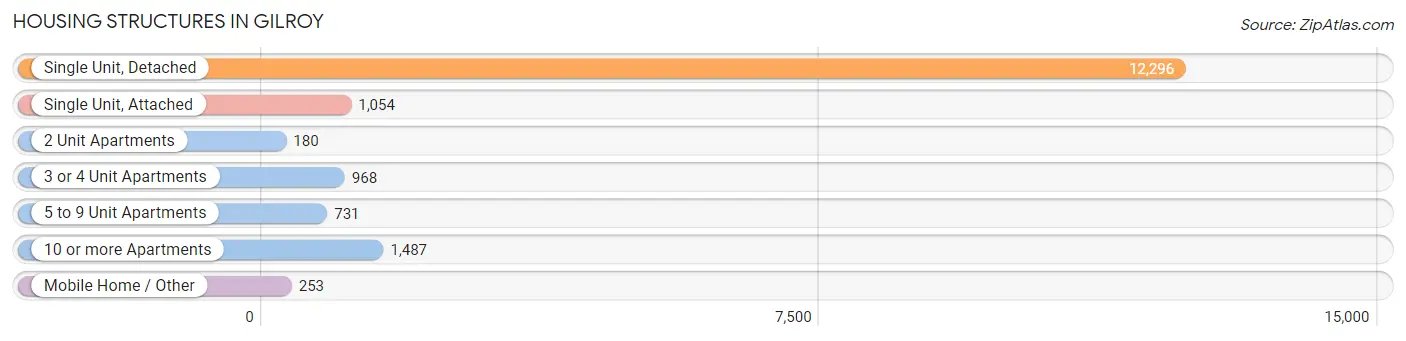
| Structure Type | # Housing Units | % Housing Units |
| Single Unit, Detached | 12,296 | 72.5% |
| Single Unit, Attached | 1,054 | 6.2% |
| 2 Unit Apartments | 180 | 1.1% |
| 3 or 4 Unit Apartments | 968 | 5.7% |
| 5 to 9 Unit Apartments | 731 | 4.3% |
| 10 or more Apartments | 1,487 | 8.8% |
| Mobile Home / Other | 253 | 1.5% |
| Total | 16,969 | 100.0% |
Housing Structures by Occupancy in Gilroy
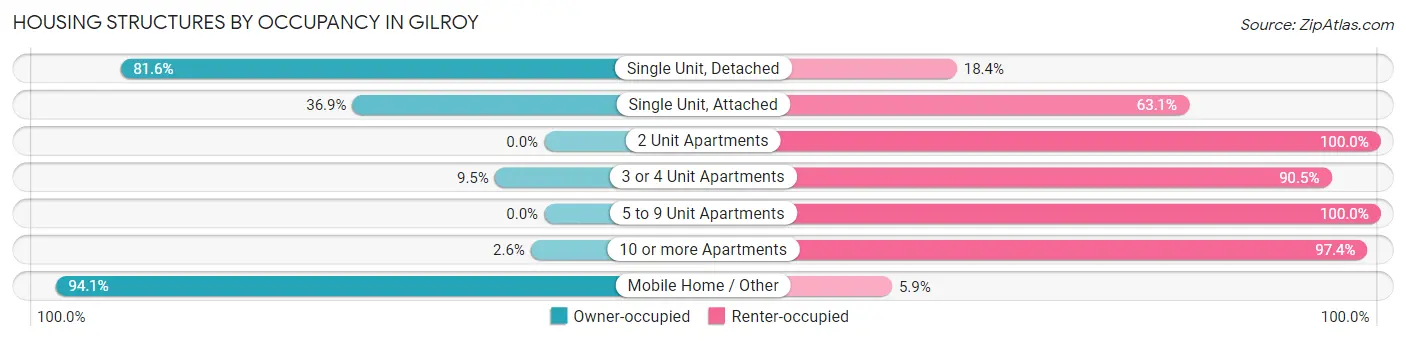
| Structure Type | Owner-occupied | Renter-occupied |
| Single Unit, Detached | 10,032 (81.6%) | 2,264 (18.4%) |
| Single Unit, Attached | 389 (36.9%) | 665 (63.1%) |
| 2 Unit Apartments | 0 (0.0%) | 180 (100.0%) |
| 3 or 4 Unit Apartments | 92 (9.5%) | 876 (90.5%) |
| 5 to 9 Unit Apartments | 0 (0.0%) | 731 (100.0%) |
| 10 or more Apartments | 38 (2.6%) | 1,449 (97.4%) |
| Mobile Home / Other | 238 (94.1%) | 15 (5.9%) |
| Total | 10,789 (63.6%) | 6,180 (36.4%) |
Housing Structures by Number of Rooms in Gilroy
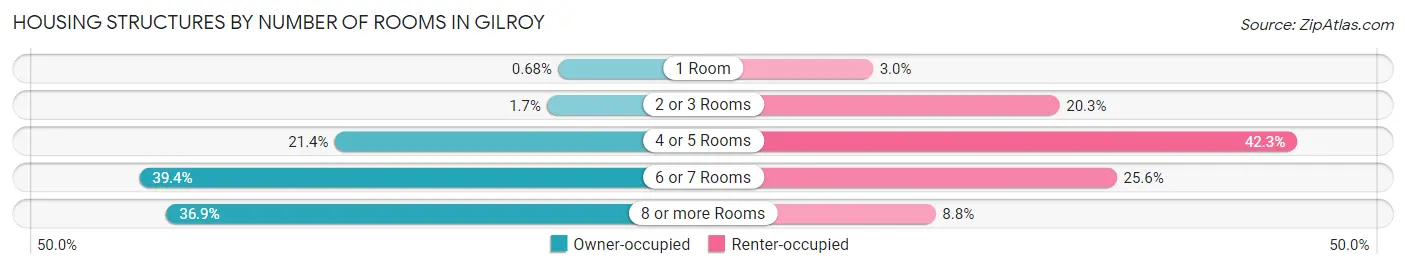
| Number of Rooms | Owner-occupied | Renter-occupied |
| 1 Room | 73 (0.7%) | 187 (3.0%) |
| 2 or 3 Rooms | 183 (1.7%) | 1,254 (20.3%) |
| 4 or 5 Rooms | 2,303 (21.3%) | 2,612 (42.3%) |
| 6 or 7 Rooms | 4,250 (39.4%) | 1,581 (25.6%) |
| 8 or more Rooms | 3,980 (36.9%) | 546 (8.8%) |
| Total | 10,789 (100.0%) | 6,180 (100.0%) |
Housing Structure by Heating Type in Gilroy
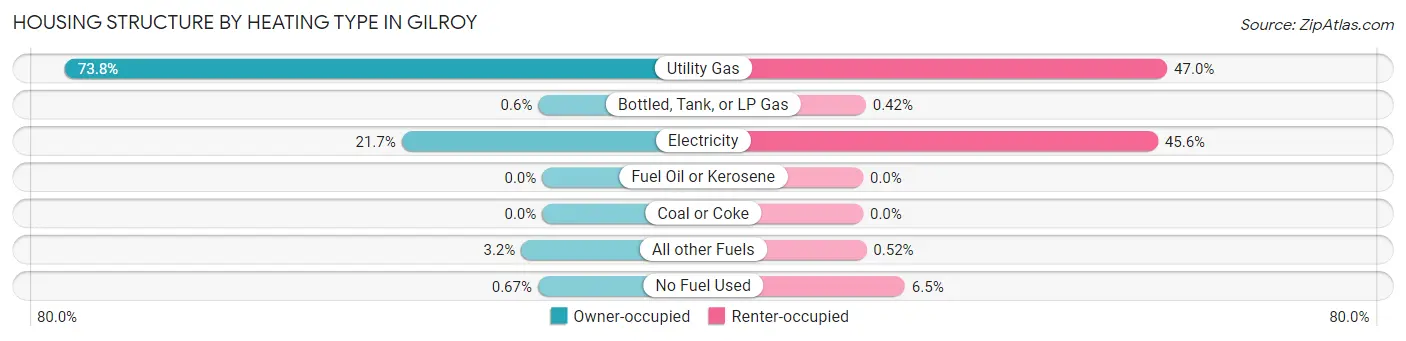
| Heating Type | Owner-occupied | Renter-occupied |
| Utility Gas | 7,958 (73.8%) | 2,905 (47.0%) |
| Bottled, Tank, or LP Gas | 65 (0.6%) | 26 (0.4%) |
| Electricity | 2,344 (21.7%) | 2,817 (45.6%) |
| Fuel Oil or Kerosene | 0 (0.0%) | 0 (0.0%) |
| Coal or Coke | 0 (0.0%) | 0 (0.0%) |
| All other Fuels | 350 (3.2%) | 32 (0.5%) |
| No Fuel Used | 72 (0.7%) | 400 (6.5%) |
| Total | 10,789 (100.0%) | 6,180 (100.0%) |
Household Vehicle Usage in Gilroy
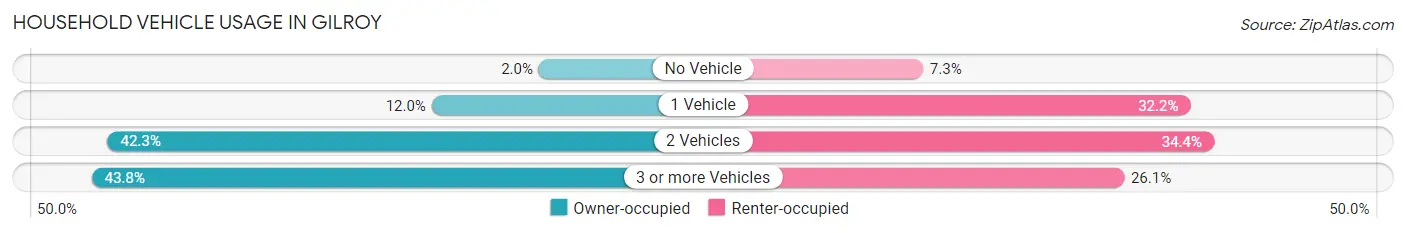
| Vehicles per Household | Owner-occupied | Renter-occupied |
| No Vehicle | 216 (2.0%) | 450 (7.3%) |
| 1 Vehicle | 1,295 (12.0%) | 1,992 (32.2%) |
| 2 Vehicles | 4,558 (42.2%) | 2,128 (34.4%) |
| 3 or more Vehicles | 4,720 (43.8%) | 1,610 (26.1%) |
| Total | 10,789 (100.0%) | 6,180 (100.0%) |
Real Estate & Mortgages in Gilroy
Real Estate and Mortgage Overview in Gilroy
| Characteristic | Without Mortgage | With Mortgage |
| Housing Units | 2,313 | 8,476 |
| Median Property Value | $820,200 | $938,300 |
| Median Household Income | $96,683 | $4,825 |
| Monthly Housing Costs | $760 | $5,804 |
| Real Estate Taxes | $4,568 | $22 |
Property Value by Mortgage Status in Gilroy
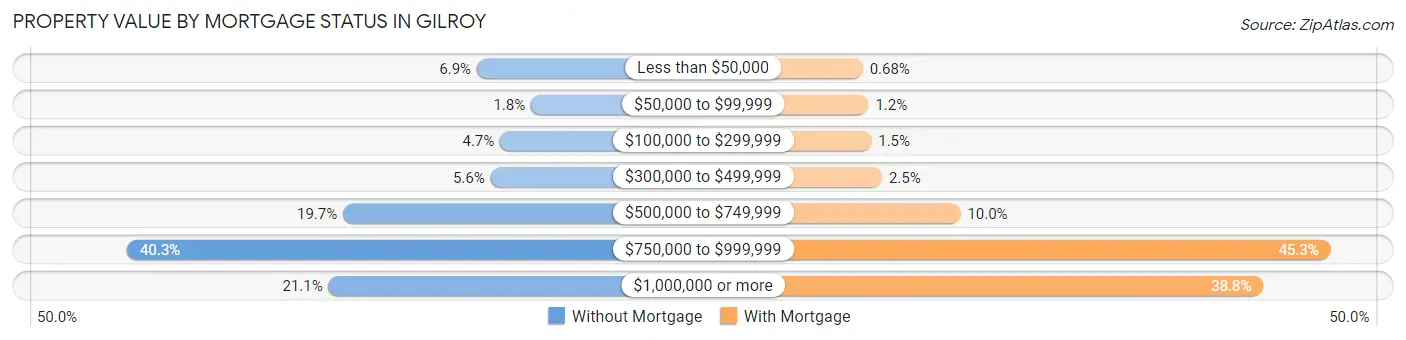
| Property Value | Without Mortgage | With Mortgage |
| Less than $50,000 | 160 (6.9%) | 58 (0.7%) |
| $50,000 to $99,999 | 41 (1.8%) | 104 (1.2%) |
| $100,000 to $299,999 | 109 (4.7%) | 127 (1.5%) |
| $300,000 to $499,999 | 130 (5.6%) | 214 (2.5%) |
| $500,000 to $749,999 | 455 (19.7%) | 847 (10.0%) |
| $750,000 to $999,999 | 931 (40.3%) | 3,835 (45.3%) |
| $1,000,000 or more | 487 (21.0%) | 3,291 (38.8%) |
| Total | 2,313 (100.0%) | 8,476 (100.0%) |
Household Income by Mortgage Status in Gilroy
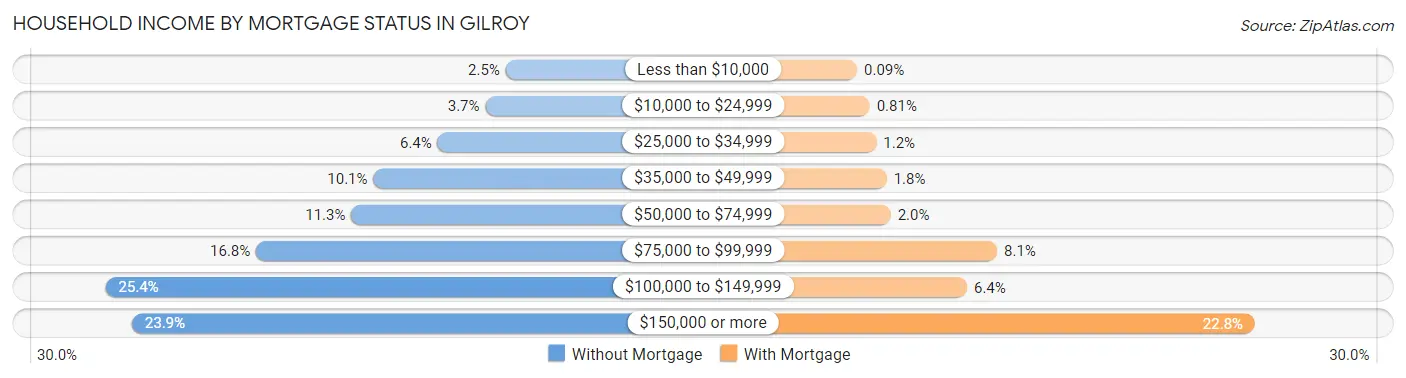
| Household Income | Without Mortgage | With Mortgage |
| Less than $10,000 | 58 (2.5%) | 8 (0.1%) |
| $10,000 to $24,999 | 85 (3.7%) | 69 (0.8%) |
| $25,000 to $34,999 | 148 (6.4%) | 101 (1.2%) |
| $35,000 to $49,999 | 233 (10.1%) | 151 (1.8%) |
| $50,000 to $74,999 | 262 (11.3%) | 170 (2.0%) |
| $75,000 to $99,999 | 388 (16.8%) | 686 (8.1%) |
| $100,000 to $149,999 | 587 (25.4%) | 540 (6.4%) |
| $150,000 or more | 552 (23.9%) | 1,934 (22.8%) |
| Total | 2,313 (100.0%) | 8,476 (100.0%) |
Property Value to Household Income Ratio in Gilroy
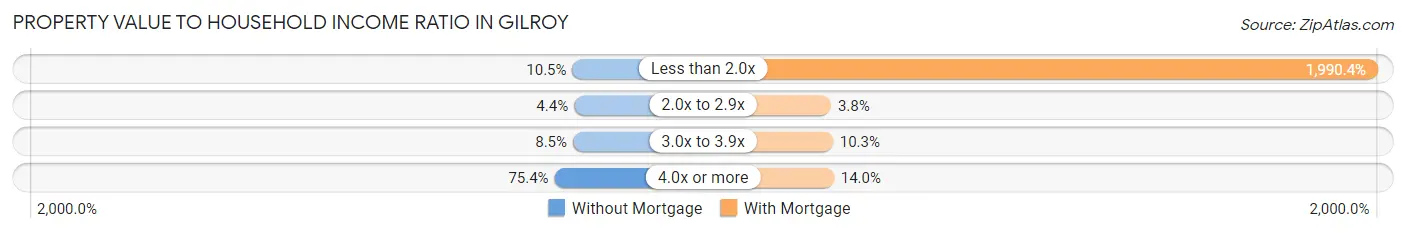
| Value-to-Income Ratio | Without Mortgage | With Mortgage |
| Less than 2.0x | 242 (10.5%) | 168,705 (1,990.4%) |
| 2.0x to 2.9x | 102 (4.4%) | 325 (3.8%) |
| 3.0x to 3.9x | 196 (8.5%) | 873 (10.3%) |
| 4.0x or more | 1,745 (75.4%) | 1,186 (14.0%) |
| Total | 2,313 (100.0%) | 8,476 (100.0%) |
Real Estate Taxes by Mortgage Status in Gilroy
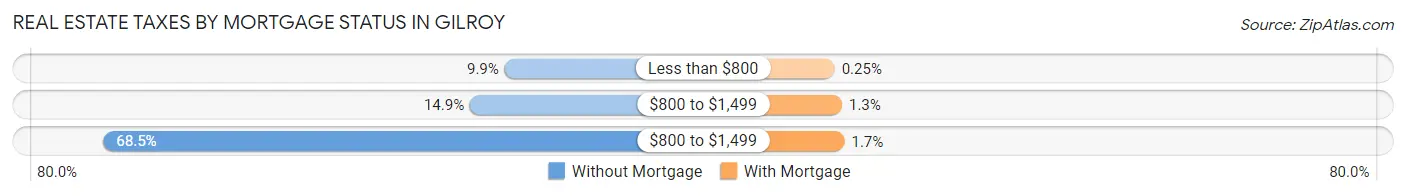
| Property Taxes | Without Mortgage | With Mortgage |
| Less than $800 | 228 (9.9%) | 21 (0.3%) |
| $800 to $1,499 | 345 (14.9%) | 111 (1.3%) |
| $800 to $1,499 | 1,584 (68.5%) | 142 (1.7%) |
| Total | 2,313 (100.0%) | 8,476 (100.0%) |
Health & Disability in Gilroy
Health Insurance Coverage by Age in Gilroy
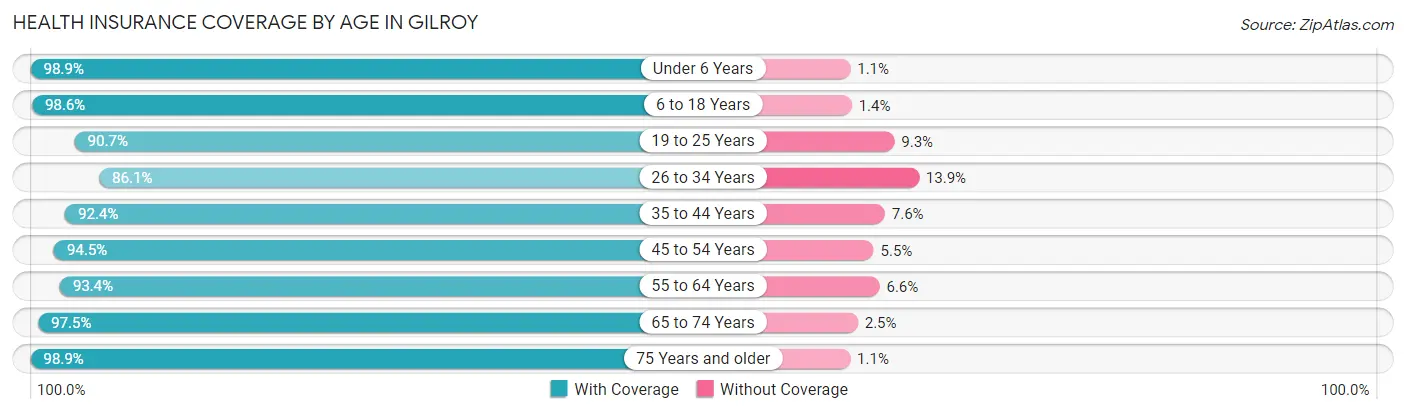
| Age Bracket | With Coverage | Without Coverage |
| Under 6 Years | 4,786 (98.9%) | 54 (1.1%) |
| 6 to 18 Years | 12,549 (98.6%) | 175 (1.4%) |
| 19 to 25 Years | 4,871 (90.7%) | 501 (9.3%) |
| 26 to 34 Years | 5,427 (86.1%) | 877 (13.9%) |
| 35 to 44 Years | 7,663 (92.4%) | 627 (7.6%) |
| 45 to 54 Years | 7,020 (94.5%) | 406 (5.5%) |
| 55 to 64 Years | 5,997 (93.4%) | 422 (6.6%) |
| 65 to 74 Years | 4,193 (97.5%) | 108 (2.5%) |
| 75 Years and older | 2,804 (98.9%) | 31 (1.1%) |
| Total | 55,310 (94.5%) | 3,201 (5.5%) |
Health Insurance Coverage by Citizenship Status in Gilroy
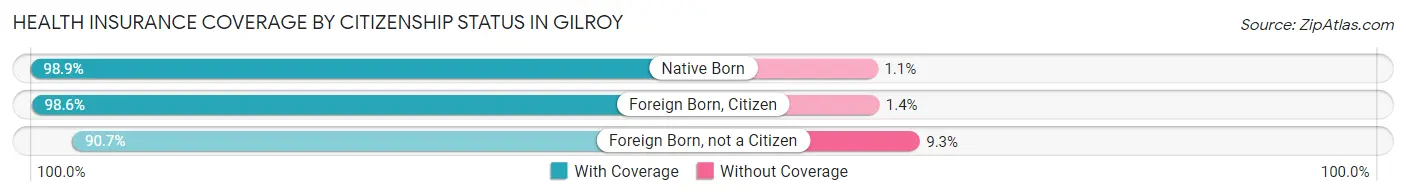
| Citizenship Status | With Coverage | Without Coverage |
| Native Born | 4,786 (98.9%) | 54 (1.1%) |
| Foreign Born, Citizen | 12,549 (98.6%) | 175 (1.4%) |
| Foreign Born, not a Citizen | 4,871 (90.7%) | 501 (9.3%) |
Health Insurance Coverage by Household Income in Gilroy
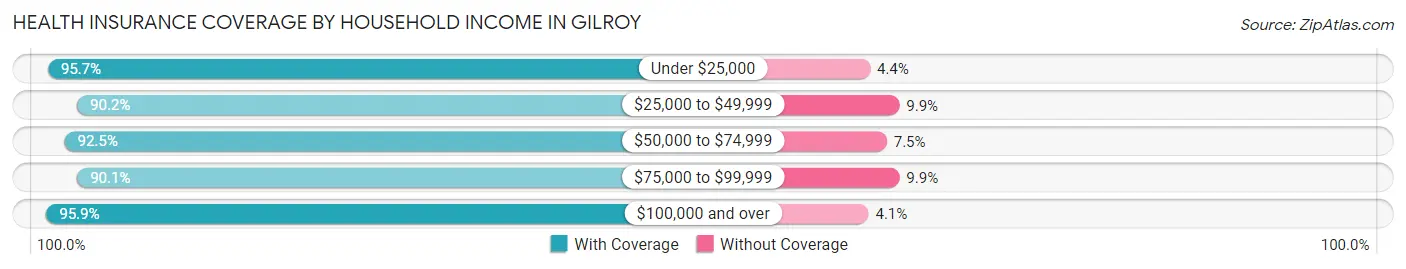
| Household Income | With Coverage | Without Coverage |
| Under $25,000 | 2,354 (95.7%) | 107 (4.3%) |
| $25,000 to $49,999 | 4,386 (90.1%) | 479 (9.9%) |
| $50,000 to $74,999 | 5,617 (92.5%) | 455 (7.5%) |
| $75,000 to $99,999 | 5,138 (90.1%) | 562 (9.9%) |
| $100,000 and over | 37,429 (95.9%) | 1,587 (4.1%) |
Public vs Private Health Insurance Coverage by Age in Gilroy
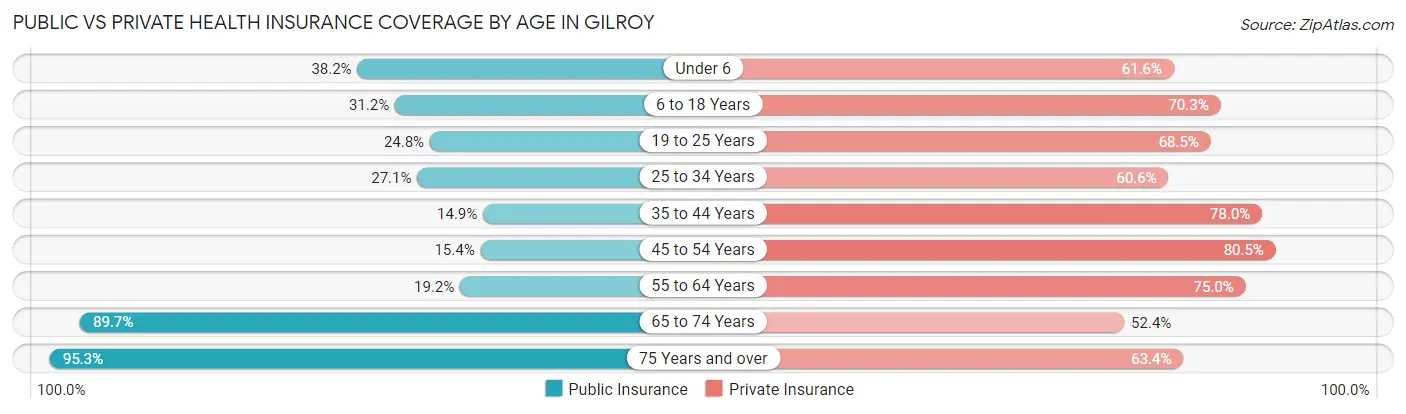
| Age Bracket | Public Insurance | Private Insurance |
| Under 6 | 1,850 (38.2%) | 2,983 (61.6%) |
| 6 to 18 Years | 3,975 (31.2%) | 8,943 (70.3%) |
| 19 to 25 Years | 1,330 (24.8%) | 3,678 (68.5%) |
| 25 to 34 Years | 1,709 (27.1%) | 3,823 (60.6%) |
| 35 to 44 Years | 1,234 (14.9%) | 6,468 (78.0%) |
| 45 to 54 Years | 1,142 (15.4%) | 5,980 (80.5%) |
| 55 to 64 Years | 1,230 (19.2%) | 4,812 (75.0%) |
| 65 to 74 Years | 3,858 (89.7%) | 2,254 (52.4%) |
| 75 Years and over | 2,702 (95.3%) | 1,797 (63.4%) |
| Total | 19,030 (32.5%) | 40,738 (69.6%) |
Disability Status by Sex by Age in Gilroy
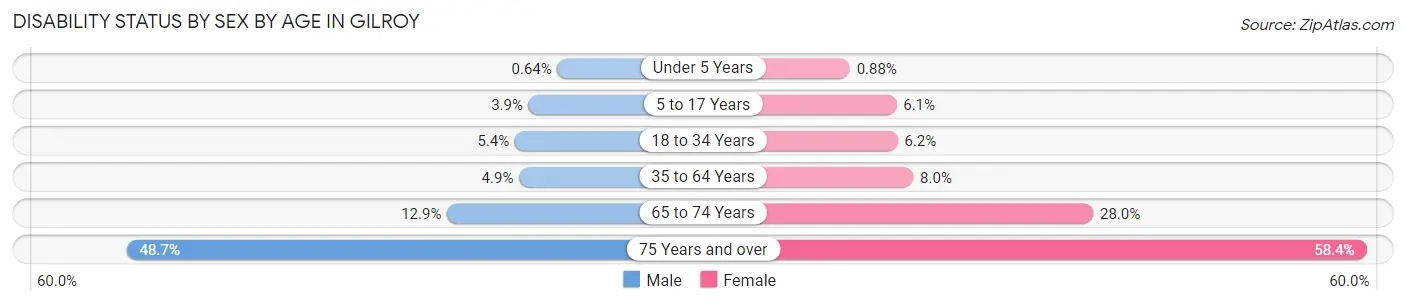
| Age Bracket | Male | Female |
| Under 5 Years | 13 (0.6%) | 16 (0.9%) |
| 5 to 17 Years | 262 (3.8%) | 370 (6.1%) |
| 18 to 34 Years | 337 (5.4%) | 386 (6.2%) |
| 35 to 64 Years | 541 (4.9%) | 884 (8.0%) |
| 65 to 74 Years | 239 (12.9%) | 686 (28.0%) |
| 75 Years and over | 593 (48.6%) | 944 (58.4%) |
Disability Class by Sex by Age in Gilroy
Disability Class: Hearing Difficulty
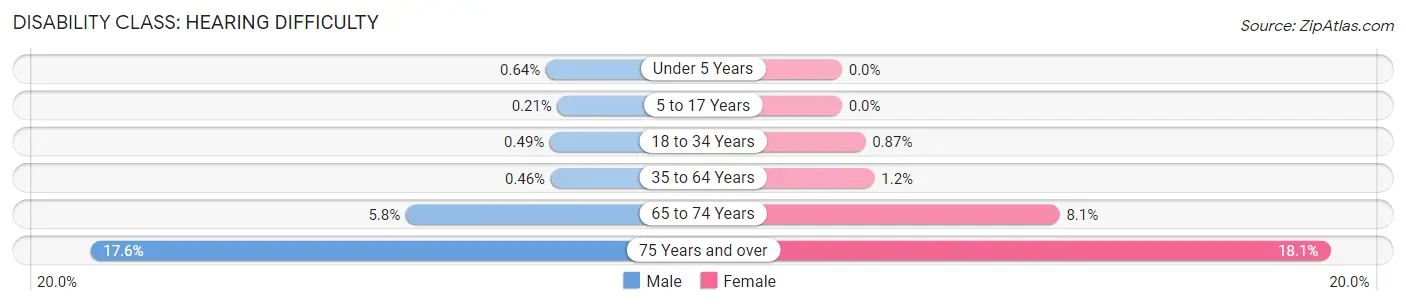
| Age Bracket | Male | Female |
| Under 5 Years | 13 (0.6%) | 0 (0.0%) |
| 5 to 17 Years | 14 (0.2%) | 0 (0.0%) |
| 18 to 34 Years | 31 (0.5%) | 54 (0.9%) |
| 35 to 64 Years | 51 (0.5%) | 135 (1.2%) |
| 65 to 74 Years | 108 (5.8%) | 198 (8.1%) |
| 75 Years and over | 214 (17.6%) | 293 (18.1%) |
Disability Class: Vision Difficulty
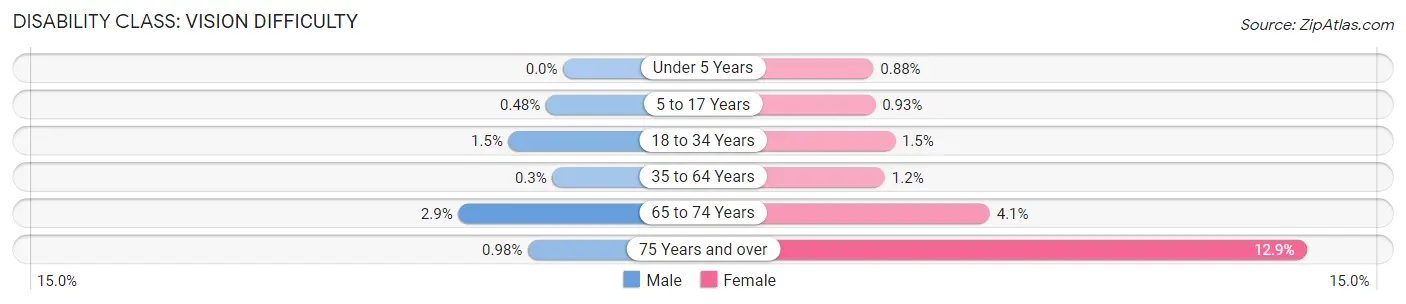
| Age Bracket | Male | Female |
| Under 5 Years | 0 (0.0%) | 16 (0.9%) |
| 5 to 17 Years | 33 (0.5%) | 57 (0.9%) |
| 18 to 34 Years | 95 (1.5%) | 92 (1.5%) |
| 35 to 64 Years | 33 (0.3%) | 133 (1.2%) |
| 65 to 74 Years | 54 (2.9%) | 101 (4.1%) |
| 75 Years and over | 12 (1.0%) | 209 (12.9%) |
Disability Class: Cognitive Difficulty
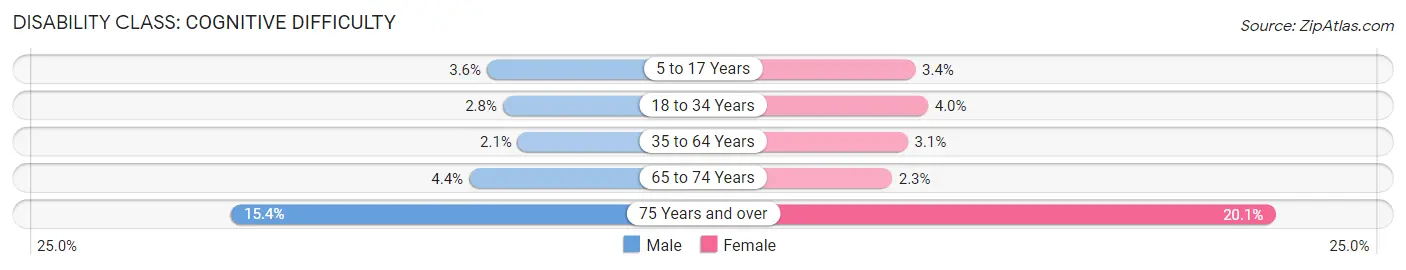
| Age Bracket | Male | Female |
| 5 to 17 Years | 242 (3.5%) | 207 (3.4%) |
| 18 to 34 Years | 176 (2.8%) | 248 (4.0%) |
| 35 to 64 Years | 234 (2.1%) | 339 (3.0%) |
| 65 to 74 Years | 81 (4.4%) | 57 (2.3%) |
| 75 Years and over | 188 (15.4%) | 325 (20.1%) |
Disability Class: Ambulatory Difficulty
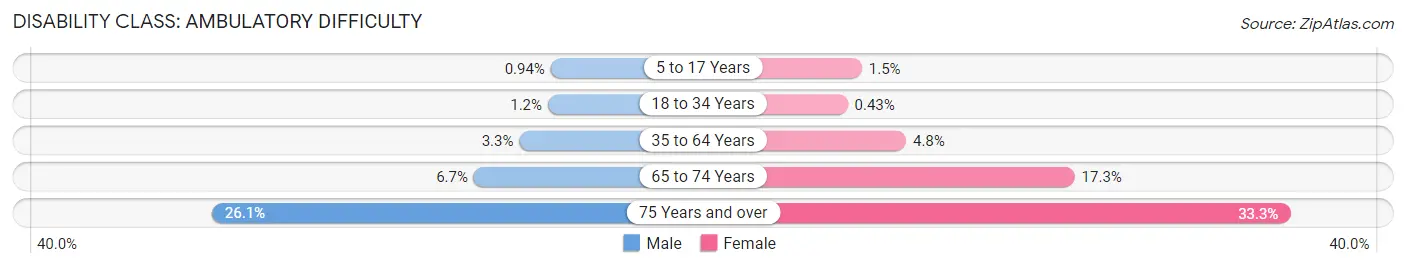
| Age Bracket | Male | Female |
| 5 to 17 Years | 64 (0.9%) | 91 (1.5%) |
| 18 to 34 Years | 72 (1.1%) | 27 (0.4%) |
| 35 to 64 Years | 360 (3.3%) | 530 (4.8%) |
| 65 to 74 Years | 123 (6.7%) | 424 (17.3%) |
| 75 Years and over | 318 (26.1%) | 538 (33.3%) |
Disability Class: Self-Care Difficulty
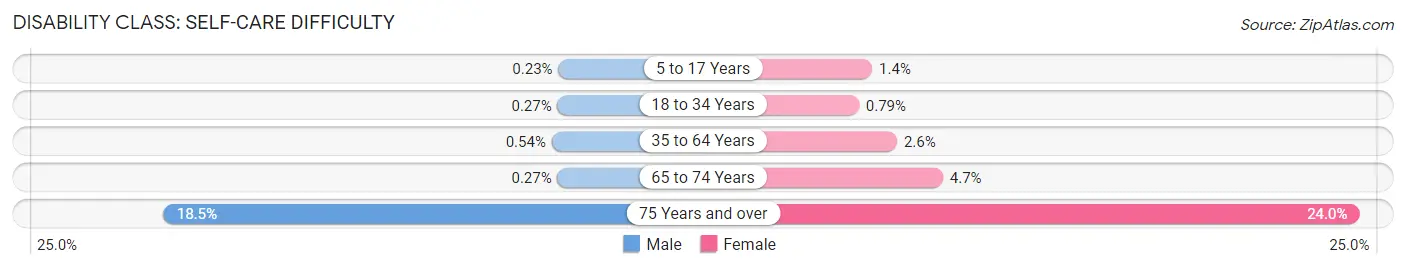
| Age Bracket | Male | Female |
| 5 to 17 Years | 16 (0.2%) | 86 (1.4%) |
| 18 to 34 Years | 17 (0.3%) | 49 (0.8%) |
| 35 to 64 Years | 60 (0.5%) | 285 (2.6%) |
| 65 to 74 Years | 5 (0.3%) | 115 (4.7%) |
| 75 Years and over | 226 (18.5%) | 388 (24.0%) |
Technology Access in Gilroy
Computing Device Access in Gilroy
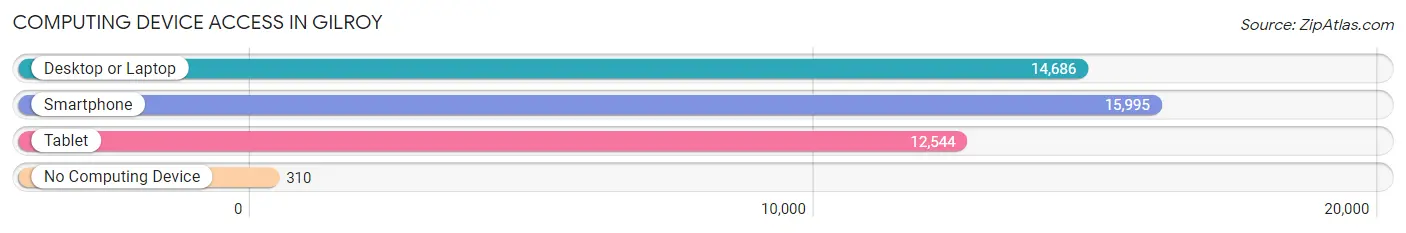
| Device Type | # Households | % Households |
| Desktop or Laptop | 14,686 | 86.6% |
| Smartphone | 15,995 | 94.3% |
| Tablet | 12,544 | 73.9% |
| No Computing Device | 310 | 1.8% |
| Total | 16,969 | 100.0% |
Internet Access in Gilroy
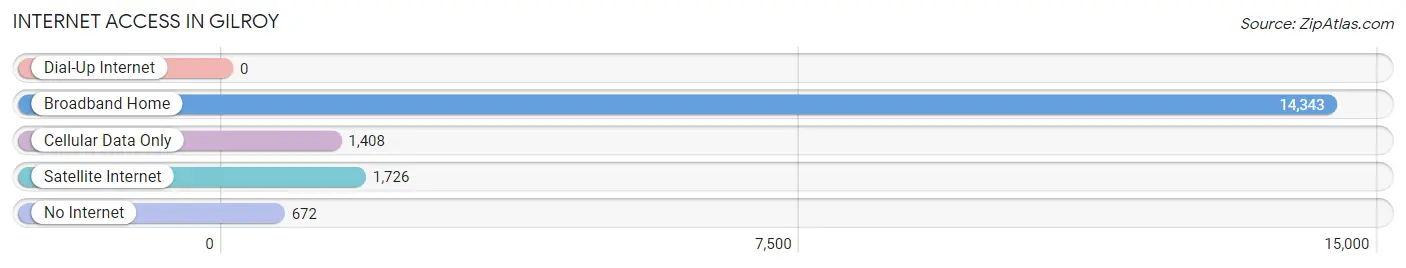
| Internet Type | # Households | % Households |
| Dial-Up Internet | 0 | 0.0% |
| Broadband Home | 14,343 | 84.5% |
| Cellular Data Only | 1,408 | 8.3% |
| Satellite Internet | 1,726 | 10.2% |
| No Internet | 672 | 4.0% |
| Total | 16,969 | 100.0% |
Gilroy Summary
Gilroy, California is a city located in Santa Clara County, in the southern part of the San Francisco Bay Area. It is the southernmost city in the county and is known for its garlic production, which has earned it the nickname “Garlic Capital of the World.” The city has a population of approximately 50,000 people and is located about 30 miles south of San Jose.
History
The area that is now Gilroy was originally inhabited by the Ohlone people, who lived in the area for thousands of years before the arrival of Europeans. The first Europeans to settle in the area were Spanish missionaries, who established the Mission Santa Clara de Asís in 1777. The mission was the first in California and was the site of the first vineyard in the state.
In the mid-1800s, the area was settled by American settlers, who established farms and ranches in the area. The town of Gilroy was founded in 1870 by John Gilroy, a Scottish immigrant who had come to California during the Gold Rush. He purchased land in the area and began to develop it, planting vineyards and orchards and building a hotel. The town was named after him and grew rapidly, becoming a center for agriculture and commerce.
Geography
Gilroy is located in the southern part of Santa Clara County, about 30 miles south of San Jose. It is situated in the Santa Clara Valley, which is surrounded by the Santa Cruz Mountains to the west and the Diablo Range to the east. The city is located at the intersection of U.S. Route 101 and State Route 152.
The city has a total area of 10.3 square miles, of which 10.2 square miles is land and 0.1 square miles is water. The climate in Gilroy is Mediterranean, with mild, wet winters and hot, dry summers.
Economy
Gilroy’s economy is largely based on agriculture and tourism. The city is known for its garlic production, which has earned it the nickname “Garlic Capital of the World.” Other agricultural products grown in the area include strawberries, artichokes, and lettuce.
The city is also home to several large companies, including the Gilroy Foods Corporation, which produces a variety of canned and frozen foods. Other major employers in the city include the Gilroy Unified School District, the Santa Clara County Sheriff’s Office, and the Gilroy Premium Outlets.
Demographics
As of the 2010 census, Gilroy had a population of 48,821 people. The racial makeup of the city was 68.2% White, 1.2% African American, 0.7% Native American, 8.3% Asian, 0.2% Pacific Islander, 16.3% from other races, and 5.3% from two or more races. Hispanic or Latino of any race were 33.2% of the population.
The median household income in Gilroy was $76,837, and the median family income was $86,919. The per capita income for the city was $30,945. About 11.2% of the population was below the poverty line.
Common Questions
What is Per Capita Income in Gilroy?
Per Capita income in Gilroy is $44,660.
What is the Median Family Income in Gilroy?
Median Family Income in Gilroy is $133,555.
What is the Median Household income in Gilroy?
Median Household Income in Gilroy is $127,391.
What is Income or Wage Gap in Gilroy?
Income or Wage Gap in Gilroy is 37.5%.
Women in Gilroy earn 62.5 cents for every dollar earned by a man.
What is Family Income Deficit in Gilroy?
Family Income Deficit in Gilroy is $12,723.
Families that are below poverty line in Gilroy earn $12,723 less on average than the poverty threshold level.
What is Inequality or Gini Index in Gilroy?
Inequality or Gini Index in Gilroy is 0.41.
What is the Total Population of Gilroy?
Total Population of Gilroy is 58,696.
What is the Total Male Population of Gilroy?
Total Male Population of Gilroy is 29,291.
What is the Total Female Population of Gilroy?
Total Female Population of Gilroy is 29,405.
What is the Ratio of Males per 100 Females in Gilroy?
There are 99.61 Males per 100 Females in Gilroy.
What is the Ratio of Females per 100 Males in Gilroy?
There are 100.39 Females per 100 Males in Gilroy.
What is the Median Population Age in Gilroy?
Median Population Age in Gilroy is 35.2 Years.
What is the Average Family Size in Gilroy
Average Family Size in Gilroy is 3.7 People.
What is the Average Household Size in Gilroy
Average Household Size in Gilroy is 3.4 People.
How Large is the Labor Force in Gilroy?
There are 29,295 People in the Labor Forcein in Gilroy.
What is the Percentage of People in the Labor Force in Gilroy?
67.1% of People are in the Labor Force in Gilroy.
What is the Unemployment Rate in Gilroy?
Unemployment Rate in Gilroy is 5.9%.