Dollar Point, CA Map & Demographics
Dollar Point Map
Dollar Point Overview
$57,701
PER CAPITA INCOME
$124,514
AVG FAMILY INCOME
$113,269
AVG HOUSEHOLD INCOME
26.3%
WAGE / INCOME GAP [ % ]
73.7¢/ $1
WAGE / INCOME GAP [ $ ]
0.45
INEQUALITY / GINI INDEX
1,233
TOTAL POPULATION
543
MALE POPULATION
690
FEMALE POPULATION
78.70
MALES / 100 FEMALES
127.07
FEMALES / 100 MALES
50.0
MEDIAN AGE
3.3
AVG FAMILY SIZE
2.4
AVG HOUSEHOLD SIZE
715
LABOR FORCE [ PEOPLE ]
68.4%
PERCENT IN LABOR FORCE
2.5%
UNEMPLOYMENT RATE
Income in Dollar Point
Income Overview in Dollar Point
Per Capita Income in Dollar Point is $57,701, while median incomes of families and households are $124,514 and $113,269 respectively.
| Characteristic | Number | Measure |
| Per Capita Income | 1,233 | $57,701 |
| Median Family Income | 267 | $124,514 |
| Mean Family Income | 267 | $153,508 |
| Median Household Income | 508 | $113,269 |
| Mean Household Income | 508 | $138,301 |
| Income Deficit | 267 | $0 |
| Wage / Income Gap (%) | 1,233 | 26.35% |
| Wage / Income Gap ($) | 1,233 | 73.65¢ per $1 |
| Gini / Inequality Index | 1,233 | 0.45 |
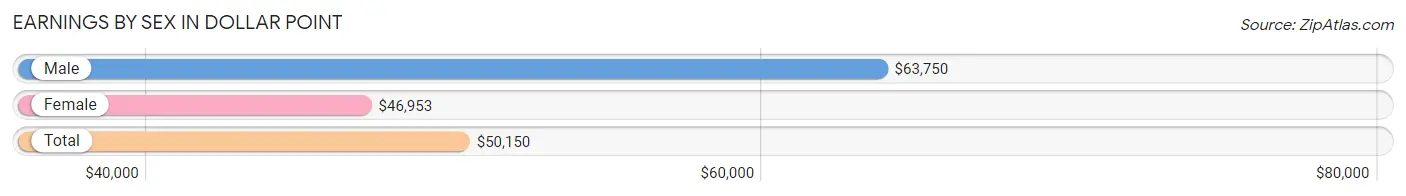
Earnings by Sex in Dollar Point
Average Earnings in Dollar Point are $50,150, $63,750 for men and $46,953 for women, a difference of 26.4%.
| Sex | Number | Average Earnings |
| Male | 324 (46.5%) | $63,750 |
| Female | 373 (53.5%) | $46,953 |
| Total | 697 (100.0%) | $50,150 |
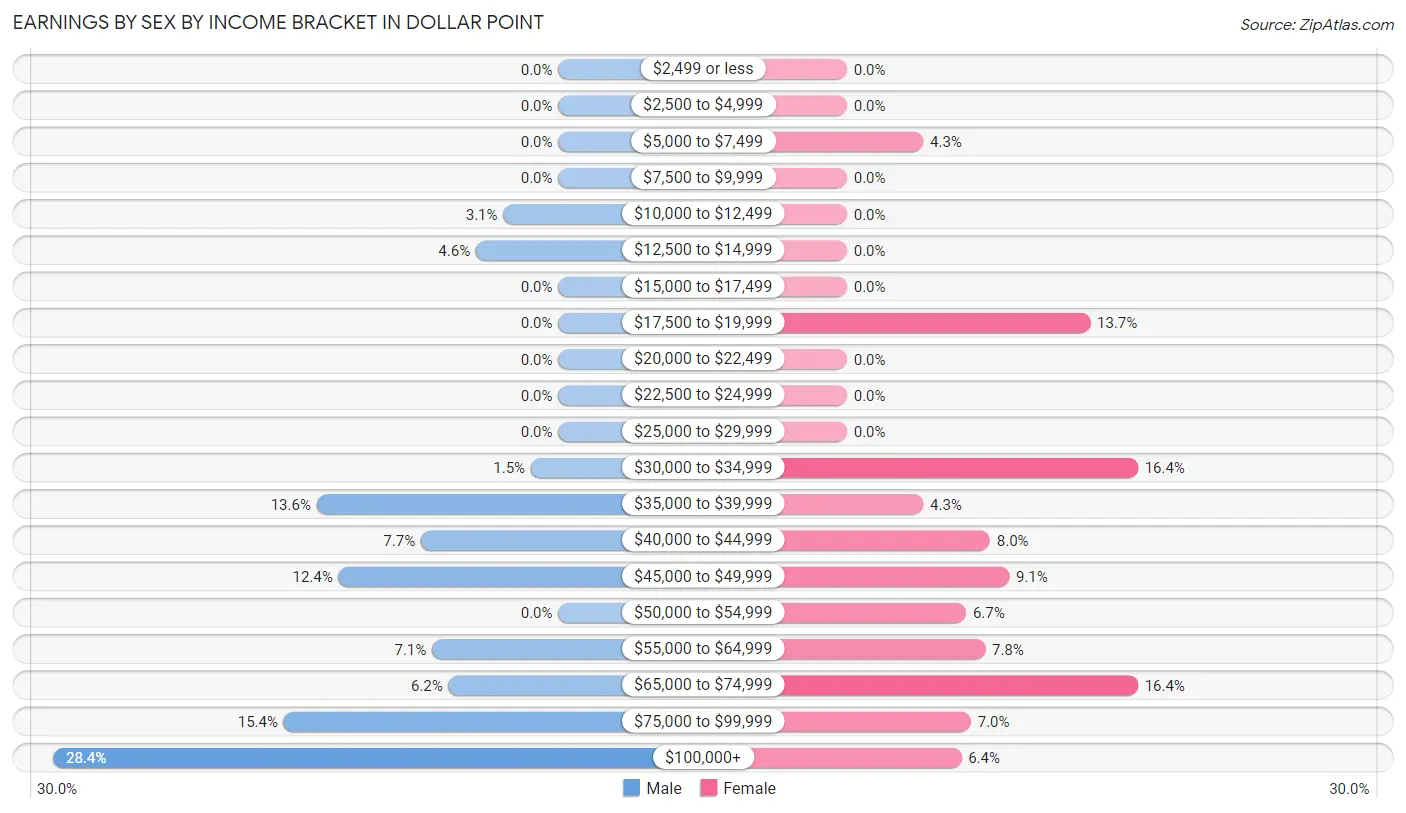
Earnings by Sex by Income Bracket in Dollar Point
The most common earnings brackets in Dollar Point are $100,000+ for men (92 | 28.4%) and $30,000 to $34,999 for women (61 | 16.4%).
| Income | Male | Female |
| $2,499 or less | 0 (0.0%) | 0 (0.0%) |
| $2,500 to $4,999 | 0 (0.0%) | 0 (0.0%) |
| $5,000 to $7,499 | 0 (0.0%) | 16 (4.3%) |
| $7,500 to $9,999 | 0 (0.0%) | 0 (0.0%) |
| $10,000 to $12,499 | 10 (3.1%) | 0 (0.0%) |
| $12,500 to $14,999 | 15 (4.6%) | 0 (0.0%) |
| $15,000 to $17,499 | 0 (0.0%) | 0 (0.0%) |
| $17,500 to $19,999 | 0 (0.0%) | 51 (13.7%) |
| $20,000 to $22,499 | 0 (0.0%) | 0 (0.0%) |
| $22,500 to $24,999 | 0 (0.0%) | 0 (0.0%) |
| $25,000 to $29,999 | 0 (0.0%) | 0 (0.0%) |
| $30,000 to $34,999 | 5 (1.5%) | 61 (16.4%) |
| $35,000 to $39,999 | 44 (13.6%) | 16 (4.3%) |
| $40,000 to $44,999 | 25 (7.7%) | 30 (8.0%) |
| $45,000 to $49,999 | 40 (12.3%) | 34 (9.1%) |
| $50,000 to $54,999 | 0 (0.0%) | 25 (6.7%) |
| $55,000 to $64,999 | 23 (7.1%) | 29 (7.8%) |
| $65,000 to $74,999 | 20 (6.2%) | 61 (16.4%) |
| $75,000 to $99,999 | 50 (15.4%) | 26 (7.0%) |
| $100,000+ | 92 (28.4%) | 24 (6.4%) |
| Total | 324 (100.0%) | 373 (100.0%) |
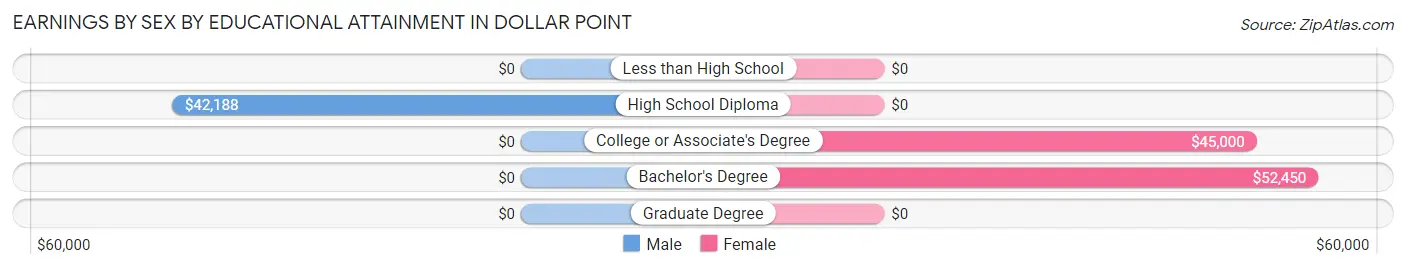
Earnings by Sex by Educational Attainment in Dollar Point
Average earnings in Dollar Point are $68,125 for men and $50,650 for women, a difference of 25.7%. Men with an educational attainment of high school diploma enjoy the highest average annual earnings of $42,188, while those with high school diploma education earn the least with $42,188. Women with an educational attainment of bachelor's degree earn the most with the average annual earnings of $52,450, while those with college or associate's degree education have the smallest earnings of $45,000.
| Educational Attainment | Male Income | Female Income |
| Less than High School | - | - |
| High School Diploma | $42,188 | $0 |
| College or Associate's Degree | - | - |
| Bachelor's Degree | - | - |
| Graduate Degree | - | - |
| Total | $68,125 | $50,650 |
Family Income in Dollar Point
Family Income Brackets in Dollar Point
According to the Dollar Point family income data, there are 75 families falling into the $200,000+ income range, which is the most common income bracket and makes up 28.1% of all families.
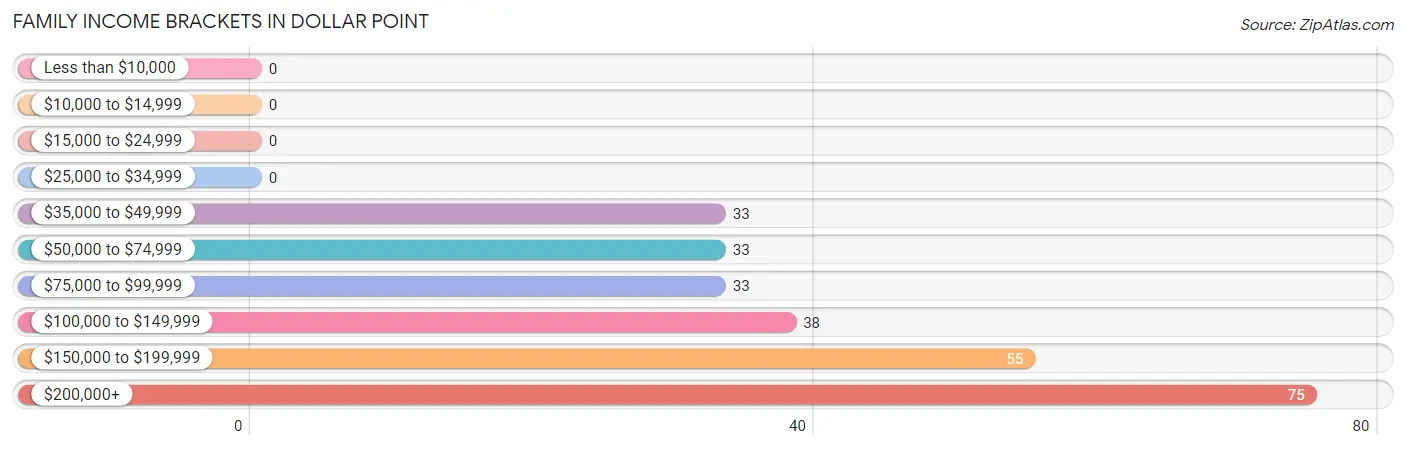
| Income Bracket | # Families | % Families |
| Less than $10,000 | 0 | 0.0% |
| $10,000 to $14,999 | 0 | 0.0% |
| $15,000 to $24,999 | 0 | 0.0% |
| $25,000 to $34,999 | 0 | 0.0% |
| $35,000 to $49,999 | 33 | 12.4% |
| $50,000 to $74,999 | 33 | 12.4% |
| $75,000 to $99,999 | 33 | 12.4% |
| $100,000 to $149,999 | 38 | 14.2% |
| $150,000 to $199,999 | 55 | 20.6% |
| $200,000+ | 75 | 28.1% |
Family Income by Famaliy Size in Dollar Point
5-person families (53 | 19.9%) account for the highest median family income in Dollar Point with $193,563 per family, while 2-person families (118 | 44.2%) have the highest median income of $41,812 per family member.
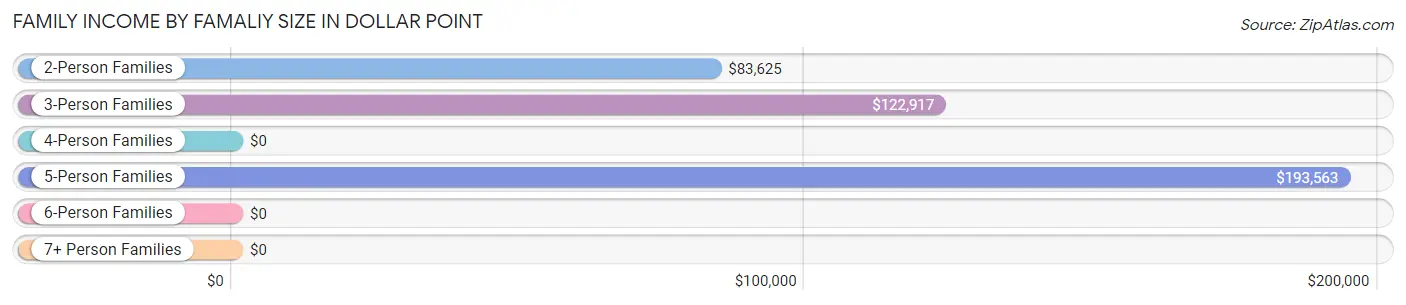
| Income Bracket | # Families | Median Income |
| 2-Person Families | 118 (44.2%) | $83,625 |
| 3-Person Families | 76 (28.5%) | $122,917 |
| 4-Person Families | 20 (7.5%) | $0 |
| 5-Person Families | 53 (19.9%) | $193,563 |
| 6-Person Families | 0 (0.0%) | $0 |
| 7+ Person Families | 0 (0.0%) | $0 |
| Total | 267 (100.0%) | $124,514 |
Family Income by Number of Earners in Dollar Point
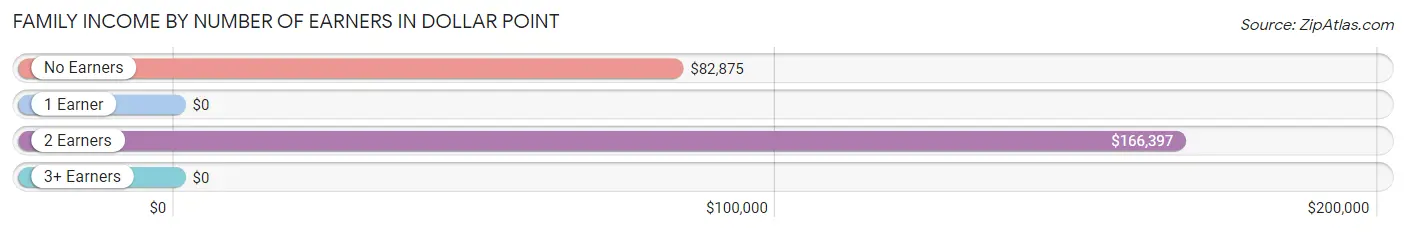
| Number of Earners | # Families | Median Income |
| No Earners | 70 (26.2%) | $82,875 |
| 1 Earner | 22 (8.2%) | $0 |
| 2 Earners | 145 (54.3%) | $166,397 |
| 3+ Earners | 30 (11.2%) | $0 |
| Total | 267 (100.0%) | $124,514 |
Household Income in Dollar Point
Household Income Brackets in Dollar Point
With 115 households falling in the category, the $200,000+ income range is the most frequent in Dollar Point, accounting for 22.6% of all households. In contrast, only 13 households (2.6%) fall into the $15,000 to $24,999 income bracket, making it the least populous group.
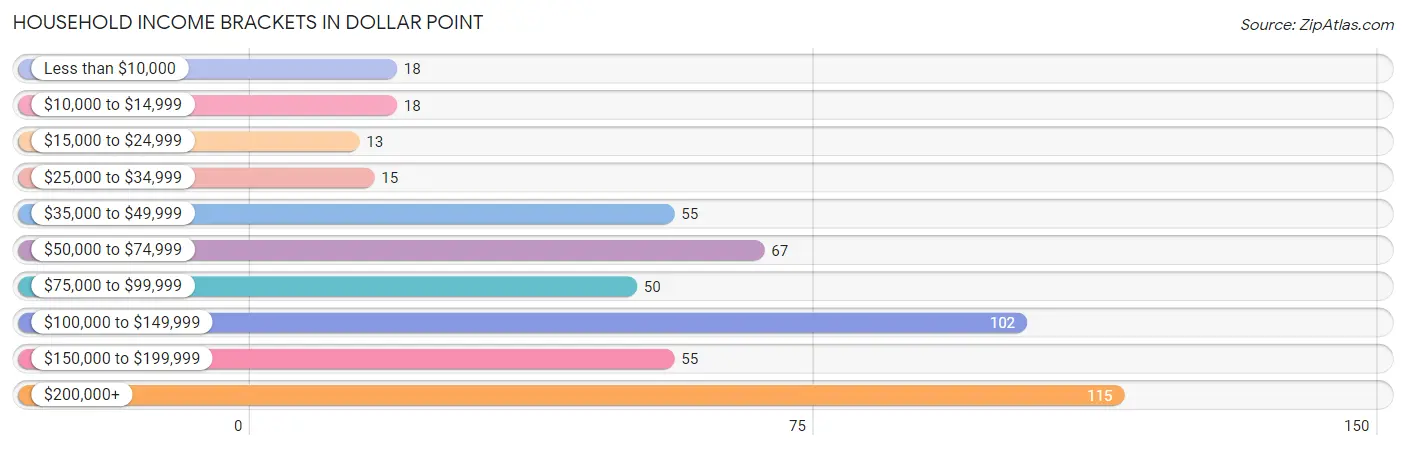
| Income Bracket | # Households | % Households |
| Less than $10,000 | 18 | 3.5% |
| $10,000 to $14,999 | 18 | 3.5% |
| $15,000 to $24,999 | 13 | 2.6% |
| $25,000 to $34,999 | 15 | 3.0% |
| $35,000 to $49,999 | 55 | 10.8% |
| $50,000 to $74,999 | 67 | 13.2% |
| $75,000 to $99,999 | 50 | 9.8% |
| $100,000 to $149,999 | 102 | 20.1% |
| $150,000 to $199,999 | 55 | 10.8% |
| $200,000+ | 115 | 22.6% |
Household Income by Householder Age in Dollar Point
The median household income in Dollar Point is $113,269, with the highest median household income of $165,074 found in the 25 to 44 years age bracket for the primary householder. A total of 101 households (19.9%) fall into this category. Meanwhile, the 15 to 24 years age bracket for the primary householder has the lowest median household income of $0, with 13 households (2.6%) in this group.
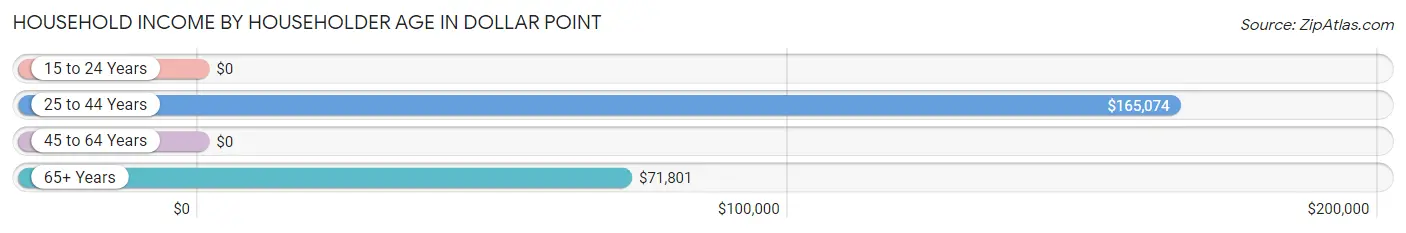
| Income Bracket | # Households | Median Income |
| 15 to 24 Years | 13 (2.6%) | $0 |
| 25 to 44 Years | 101 (19.9%) | $165,074 |
| 45 to 64 Years | 223 (43.9%) | $0 |
| 65+ Years | 171 (33.7%) | $71,801 |
| Total | 508 (100.0%) | $113,269 |
Poverty in Dollar Point
Income Below Poverty by Sex and Age in Dollar Point
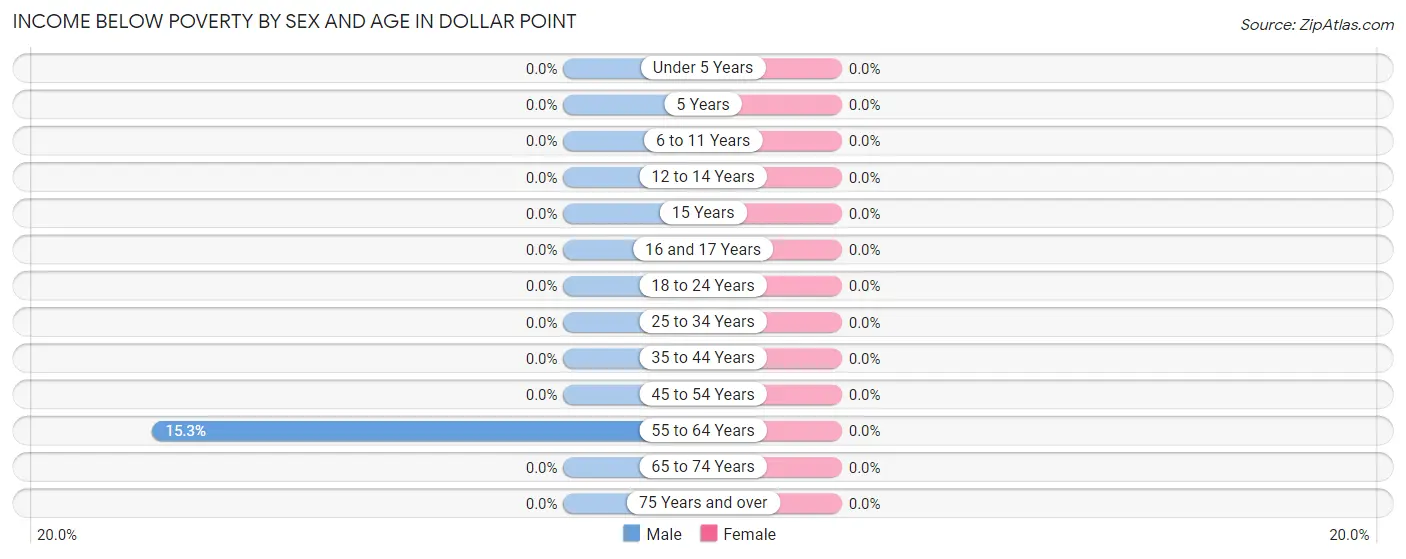
| Age Bracket | Male | Female |
| Under 5 Years | 0 (0.0%) | 0 (0.0%) |
| 5 Years | 0 (0.0%) | 0 (0.0%) |
| 6 to 11 Years | 0 (0.0%) | 0 (0.0%) |
| 12 to 14 Years | 0 (0.0%) | 0 (0.0%) |
| 15 Years | 0 (0.0%) | 0 (0.0%) |
| 16 and 17 Years | 0 (0.0%) | 0 (0.0%) |
| 18 to 24 Years | 0 (0.0%) | 0 (0.0%) |
| 25 to 34 Years | 0 (0.0%) | 0 (0.0%) |
| 35 to 44 Years | 0 (0.0%) | 0 (0.0%) |
| 45 to 54 Years | 0 (0.0%) | 0 (0.0%) |
| 55 to 64 Years | 18 (15.2%) | 0 (0.0%) |
| 65 to 74 Years | 0 (0.0%) | 0 (0.0%) |
| 75 Years and over | 0 (0.0%) | 0 (0.0%) |
| Total | 18 (3.3%) | 0 (0.0%) |
Income Above Poverty by Sex and Age in Dollar Point
According to the poverty statistics in Dollar Point, males aged under 5 years and females aged under 5 years are the age groups that are most secure financially, with 100.0% of males and 100.0% of females in these age groups living above the poverty line.
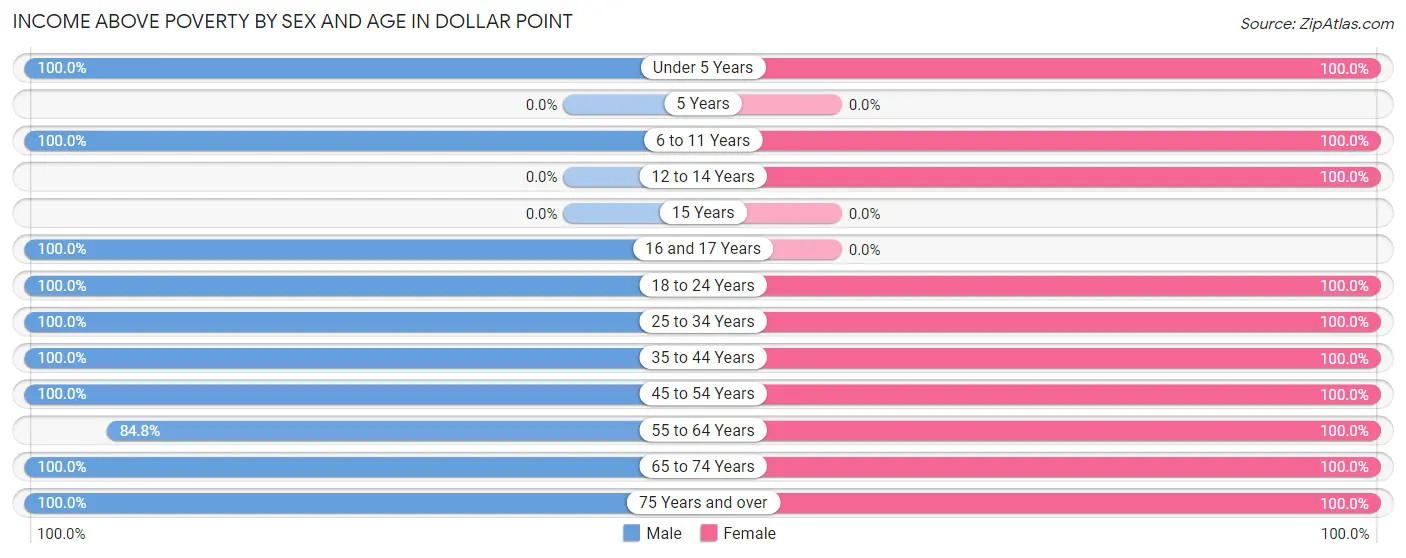
| Age Bracket | Male | Female |
| Under 5 Years | 40 (100.0%) | 37 (100.0%) |
| 5 Years | 0 (0.0%) | 0 (0.0%) |
| 6 to 11 Years | 9 (100.0%) | 31 (100.0%) |
| 12 to 14 Years | 0 (0.0%) | 71 (100.0%) |
| 15 Years | 0 (0.0%) | 0 (0.0%) |
| 16 and 17 Years | 10 (100.0%) | 0 (0.0%) |
| 18 to 24 Years | 23 (100.0%) | 84 (100.0%) |
| 25 to 34 Years | 91 (100.0%) | 117 (100.0%) |
| 35 to 44 Years | 39 (100.0%) | 41 (100.0%) |
| 45 to 54 Years | 67 (100.0%) | 102 (100.0%) |
| 55 to 64 Years | 100 (84.8%) | 122 (100.0%) |
| 65 to 74 Years | 97 (100.0%) | 34 (100.0%) |
| 75 Years and over | 47 (100.0%) | 51 (100.0%) |
| Total | 523 (96.7%) | 690 (100.0%) |
Income Below Poverty Among Married-Couple Families in Dollar Point
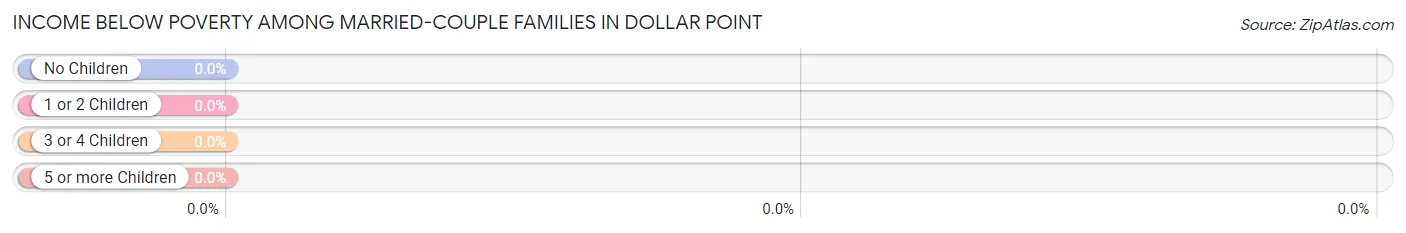
| Children | Above Poverty | Below Poverty |
| No Children | 138 (100.0%) | 0 (0.0%) |
| 1 or 2 Children | 80 (100.0%) | 0 (0.0%) |
| 3 or 4 Children | 15 (100.0%) | 0 (0.0%) |
| 5 or more Children | 0 (0.0%) | 0 (0.0%) |
| Total | 233 (100.0%) | 0 (0.0%) |
Income Below Poverty Among Single-Parent Households in Dollar Point
| Children | Single Father | Single Mother |
| No Children | 0 (0.0%) | 0 (0.0%) |
| 1 or 2 Children | 0 (0.0%) | 0 (0.0%) |
| 3 or 4 Children | 0 (0.0%) | 0 (0.0%) |
| 5 or more Children | 0 (0.0%) | 0 (0.0%) |
| Total | 0 (0.0%) | 0 (0.0%) |
Income Below Poverty Among Married-Couple vs Single-Parent Households in Dollar Point
| Children | Married-Couple Families | Single-Parent Households |
| No Children | 0 (0.0%) | 0 (0.0%) |
| 1 or 2 Children | 0 (0.0%) | 0 (0.0%) |
| 3 or 4 Children | 0 (0.0%) | 0 (0.0%) |
| 5 or more Children | 0 (0.0%) | 0 (0.0%) |
| Total | 0 (0.0%) | 0 (0.0%) |
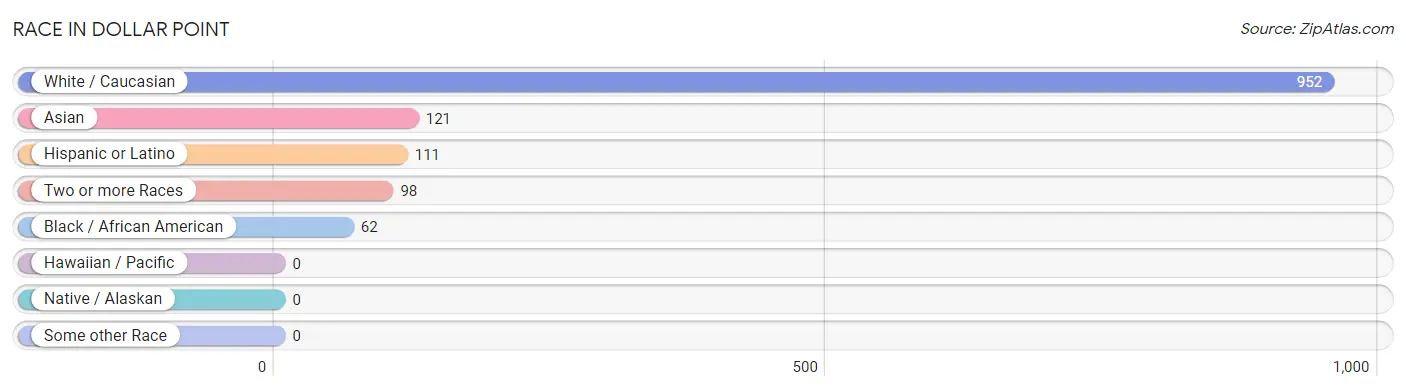
Race in Dollar Point
The most populous races in Dollar Point are White / Caucasian (952 | 77.2%), Asian (121 | 9.8%), and Hispanic or Latino (111 | 9.0%).
| Race | # Population | % Population |
| Asian | 121 | 9.8% |
| Black / African American | 62 | 5.0% |
| Hawaiian / Pacific | 0 | 0.0% |
| Hispanic or Latino | 111 | 9.0% |
| Native / Alaskan | 0 | 0.0% |
| White / Caucasian | 952 | 77.2% |
| Two or more Races | 98 | 8.0% |
| Some other Race | 0 | 0.0% |
| Total | 1,233 | 100.0% |
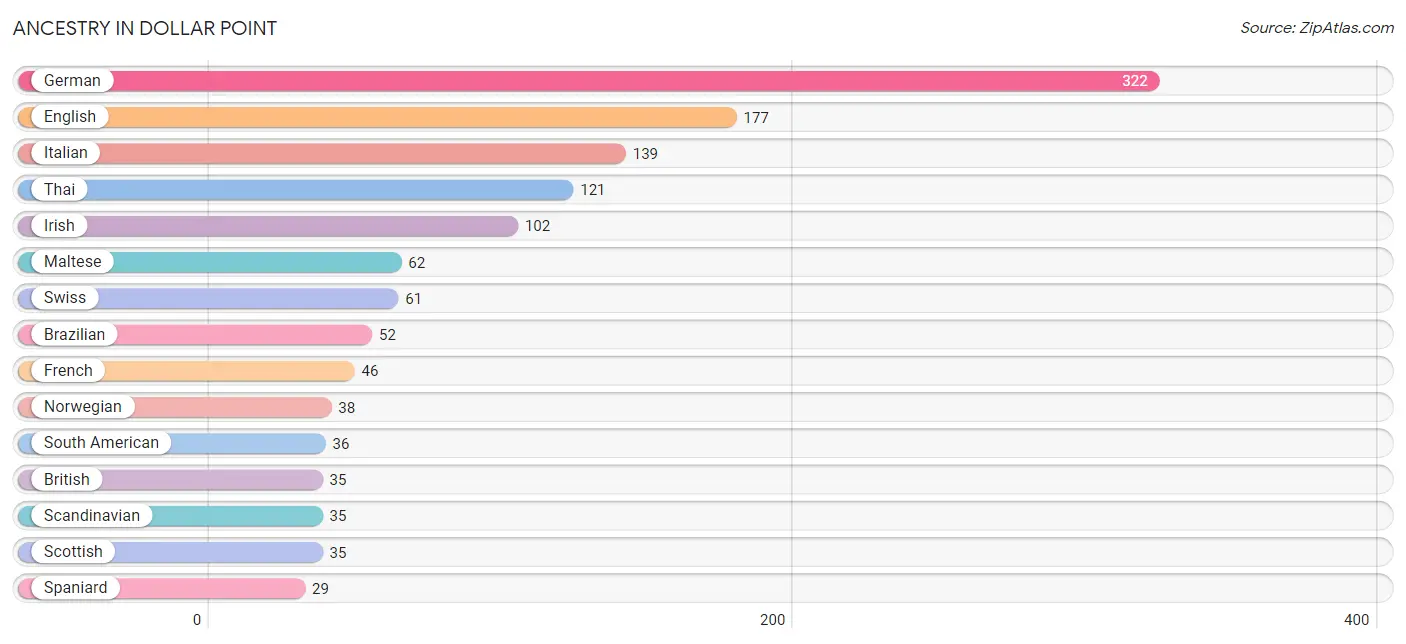
Ancestry in Dollar Point
The most populous ancestries reported in Dollar Point are German (322 | 26.1%), English (177 | 14.4%), Italian (139 | 11.3%), Thai (121 | 9.8%), and Irish (102 | 8.3%), together accounting for 69.8% of all Dollar Point residents.
| Ancestry | # Population | % Population |
| Austrian | 15 | 1.2% |
| Brazilian | 52 | 4.2% |
| British | 35 | 2.8% |
| Central American | 16 | 1.3% |
| Dominican | 13 | 1.1% |
| Dutch | 17 | 1.4% |
| English | 177 | 14.4% |
| European | 18 | 1.5% |
| French | 46 | 3.7% |
| German | 322 | 26.1% |
| Guatemalan | 16 | 1.3% |
| Irish | 102 | 8.3% |
| Italian | 139 | 11.3% |
| Maltese | 62 | 5.0% |
| Mexican | 17 | 1.4% |
| Norwegian | 38 | 3.1% |
| Polish | 18 | 1.5% |
| Russian | 18 | 1.5% |
| Scandinavian | 35 | 2.8% |
| Scottish | 35 | 2.8% |
| South American | 36 | 2.9% |
| Spaniard | 29 | 2.4% |
| Swedish | 6 | 0.5% |
| Swiss | 61 | 5.0% |
| Thai | 121 | 9.8% |
| Welsh | 4 | 0.3% | View All 26 Rows |
Immigrants in Dollar Point
The most numerous immigrant groups reported in Dollar Point came from Asia (98 | 8.0%), India (98 | 8.0%), South Central Asia (98 | 8.0%), Europe (17 | 1.4%), and Germany (17 | 1.4%), together accounting for 26.6% of all Dollar Point residents.
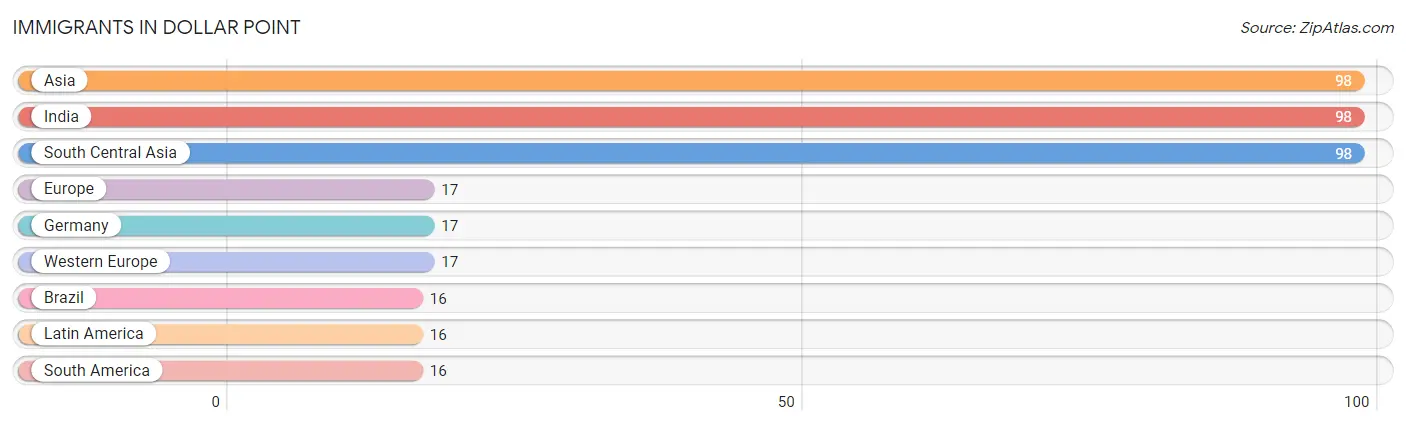
| Immigration Origin | # Population | % Population |
| Asia | 98 | 8.0% |
| Brazil | 16 | 1.3% |
| Europe | 17 | 1.4% |
| Germany | 17 | 1.4% |
| India | 98 | 8.0% |
| Latin America | 16 | 1.3% |
| South America | 16 | 1.3% |
| South Central Asia | 98 | 8.0% |
| Western Europe | 17 | 1.4% | View All 9 Rows |
Sex and Age in Dollar Point
Sex and Age in Dollar Point
The most populous age groups in Dollar Point are 60 to 64 Years (91 | 16.8%) for men and 60 to 64 Years (104 | 15.1%) for women.
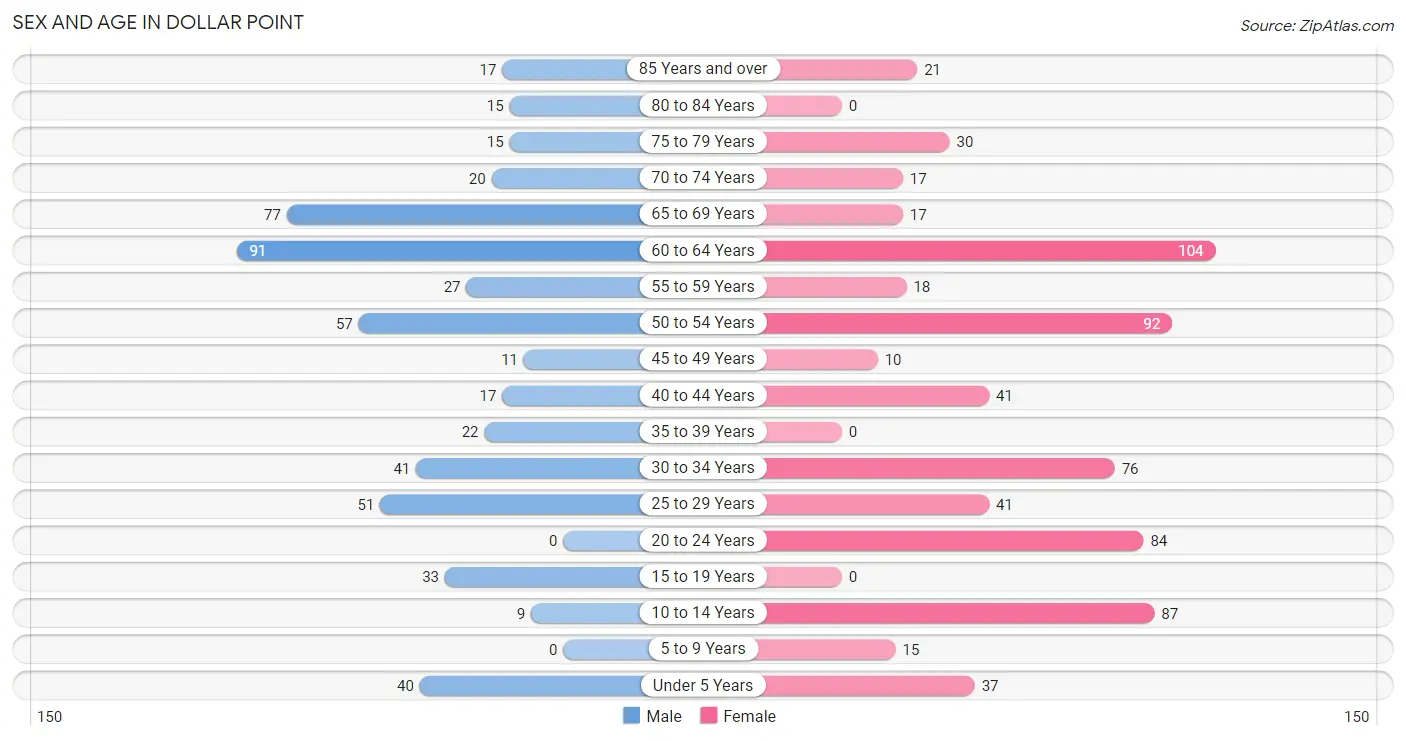
| Age Bracket | Male | Female |
| Under 5 Years | 40 (7.4%) | 37 (5.4%) |
| 5 to 9 Years | 0 (0.0%) | 15 (2.2%) |
| 10 to 14 Years | 9 (1.7%) | 87 (12.6%) |
| 15 to 19 Years | 33 (6.1%) | 0 (0.0%) |
| 20 to 24 Years | 0 (0.0%) | 84 (12.2%) |
| 25 to 29 Years | 51 (9.4%) | 41 (5.9%) |
| 30 to 34 Years | 41 (7.5%) | 76 (11.0%) |
| 35 to 39 Years | 22 (4.1%) | 0 (0.0%) |
| 40 to 44 Years | 17 (3.1%) | 41 (5.9%) |
| 45 to 49 Years | 11 (2.0%) | 10 (1.5%) |
| 50 to 54 Years | 57 (10.5%) | 92 (13.3%) |
| 55 to 59 Years | 27 (5.0%) | 18 (2.6%) |
| 60 to 64 Years | 91 (16.8%) | 104 (15.1%) |
| 65 to 69 Years | 77 (14.2%) | 17 (2.5%) |
| 70 to 74 Years | 20 (3.7%) | 17 (2.5%) |
| 75 to 79 Years | 15 (2.8%) | 30 (4.3%) |
| 80 to 84 Years | 15 (2.8%) | 0 (0.0%) |
| 85 Years and over | 17 (3.1%) | 21 (3.0%) |
| Total | 543 (100.0%) | 690 (100.0%) |
Families and Households in Dollar Point
Median Family Size in Dollar Point
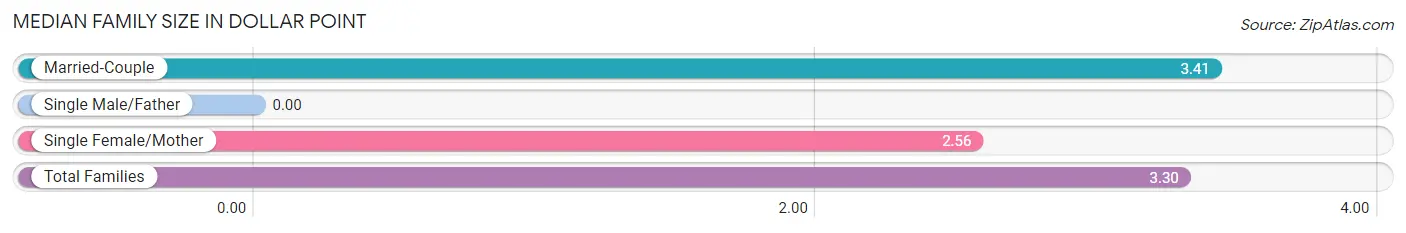
| Family Type | # Families | Family Size |
| Married-Couple | 233 (87.3%) | 3.41 |
| Single Male/Father | 0 (0.0%) | - |
| Single Female/Mother | 34 (12.7%) | 2.56 |
| Total Families | 267 (100.0%) | 3.30 |
Median Household Size in Dollar Point
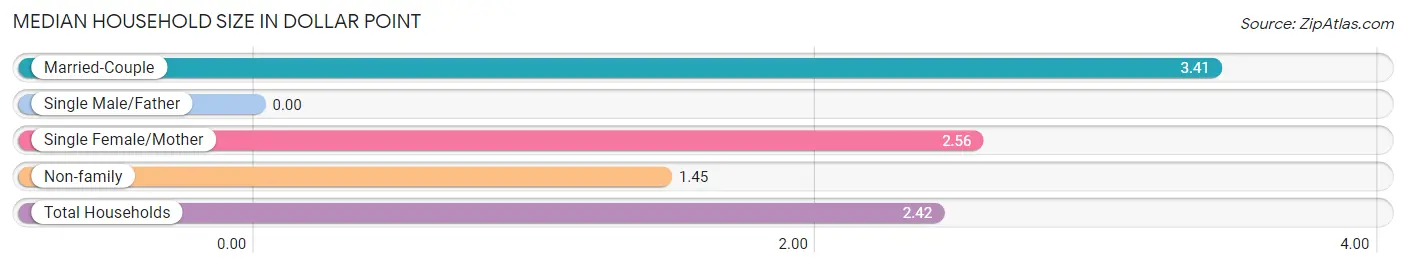
| Household Type | # Households | Household Size |
| Married-Couple | 233 (45.9%) | 3.41 |
| Single Male/Father | 0 (0.0%) | - |
| Single Female/Mother | 34 (6.7%) | 2.56 |
| Non-family | 241 (47.4%) | 1.45 |
| Total Households | 508 (100.0%) | 2.42 |
Household Size by Marriage Status in Dollar Point
Out of a total of 508 households in Dollar Point, 267 (52.6%) are family households, while 241 (47.4%) are nonfamily households. The most numerous type of family households are 2-person households, comprising 118, and the most common type of nonfamily households are 1-person households, comprising 205.
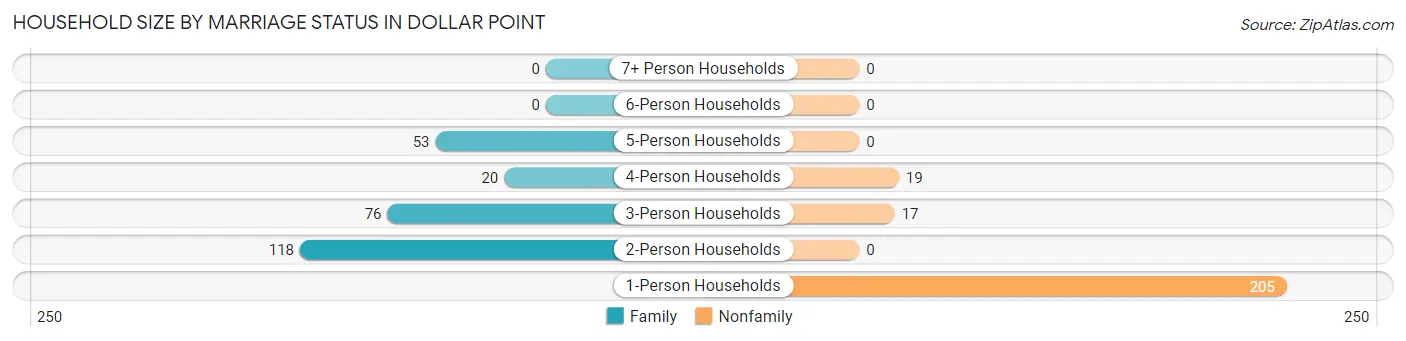
| Household Size | Family Households | Nonfamily Households |
| 1-Person Households | - | 205 (40.4%) |
| 2-Person Households | 118 (23.2%) | 0 (0.0%) |
| 3-Person Households | 76 (15.0%) | 17 (3.4%) |
| 4-Person Households | 20 (3.9%) | 19 (3.7%) |
| 5-Person Households | 53 (10.4%) | 0 (0.0%) |
| 6-Person Households | 0 (0.0%) | 0 (0.0%) |
| 7+ Person Households | 0 (0.0%) | 0 (0.0%) |
| Total | 267 (52.6%) | 241 (47.4%) |
Female Fertility in Dollar Point
Fertility by Age in Dollar Point
Average fertility rate in Dollar Point is 22.0 births per 1,000 women. Women in the age bracket of 20 to 34 years have the highest fertility rate with 30.0 births per 1,000 women. Women in the age bracket of 20 to 34 years acount for 100.0% of all women with births.
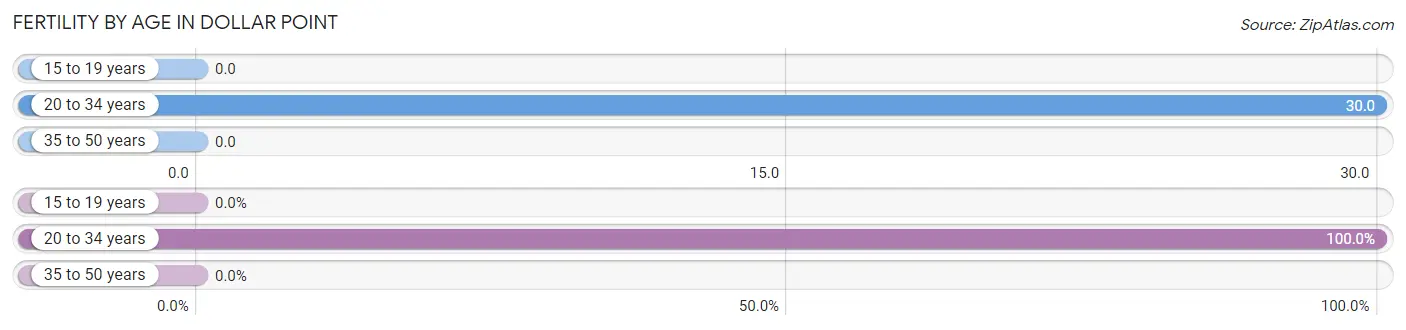
| Age Bracket | Women with Births | Births / 1,000 Women |
| 15 to 19 years | 0 (0.0%) | 0.0 |
| 20 to 34 years | 6 (100.0%) | 30.0 |
| 35 to 50 years | 0 (0.0%) | 0.0 |
| Total | 6 (100.0%) | 22.0 |
Fertility by Age by Marriage Status in Dollar Point
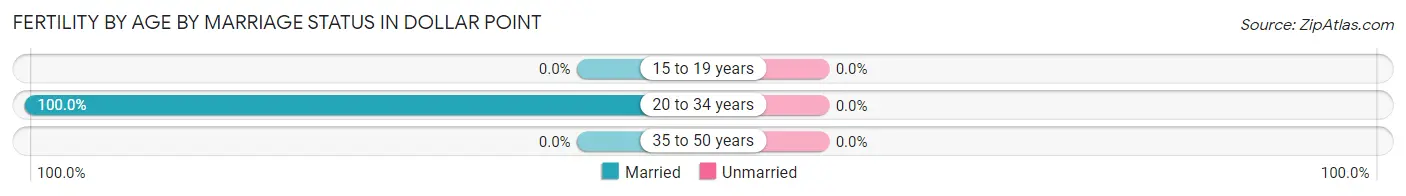
| Age Bracket | Married | Unmarried |
| 15 to 19 years | 0 (0.0%) | 0 (0.0%) |
| 20 to 34 years | 6 (100.0%) | 0 (0.0%) |
| 35 to 50 years | 0 (0.0%) | 0 (0.0%) |
| Total | 6 (100.0%) | 0 (0.0%) |
Fertility by Education in Dollar Point
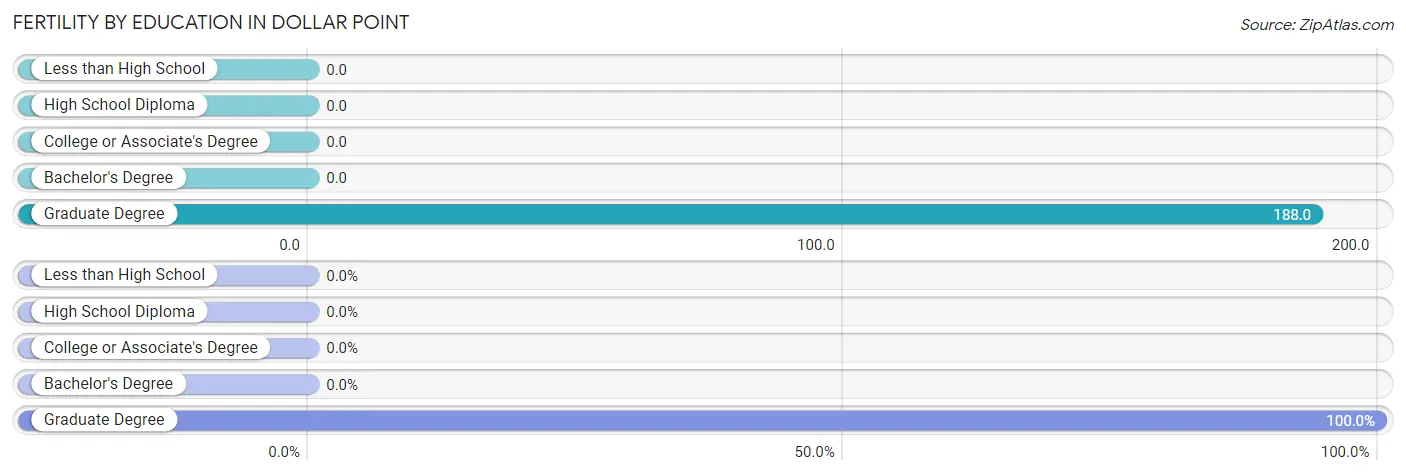
| Educational Attainment | Women with Births | Births / 1,000 Women |
| Less than High School | 0 (0.0%) | 0.0 |
| High School Diploma | 0 (0.0%) | 0.0 |
| College or Associate's Degree | 0 (0.0%) | 0.0 |
| Bachelor's Degree | 0 (0.0%) | 0.0 |
| Graduate Degree | 6 (100.0%) | 188.0 |
| Total | 6 (100.0%) | 22.0 |
Fertility by Education by Marriage Status in Dollar Point
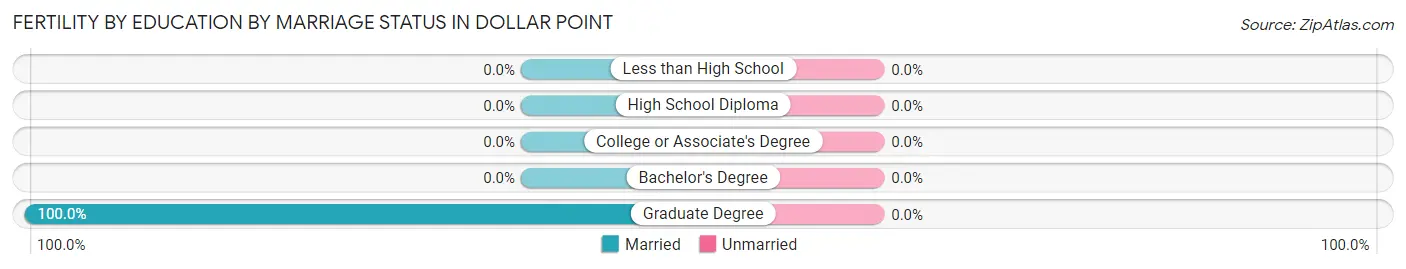
| Educational Attainment | Married | Unmarried |
| Less than High School | 0 (0.0%) | 0 (0.0%) |
| High School Diploma | 0 (0.0%) | 0 (0.0%) |
| College or Associate's Degree | 0 (0.0%) | 0 (0.0%) |
| Bachelor's Degree | 0 (0.0%) | 0 (0.0%) |
| Graduate Degree | 6 (100.0%) | 0 (0.0%) |
| Total | 6 (100.0%) | 0 (0.0%) |
Employment Characteristics in Dollar Point
Employment by Class of Employer in Dollar Point
Among the 697 employed individuals in Dollar Point, private company employees (358 | 51.4%), self-employed (incorporated) (108 | 15.5%), and self-employed (not incorporated) (92 | 13.2%) make up the most common classes of employment.
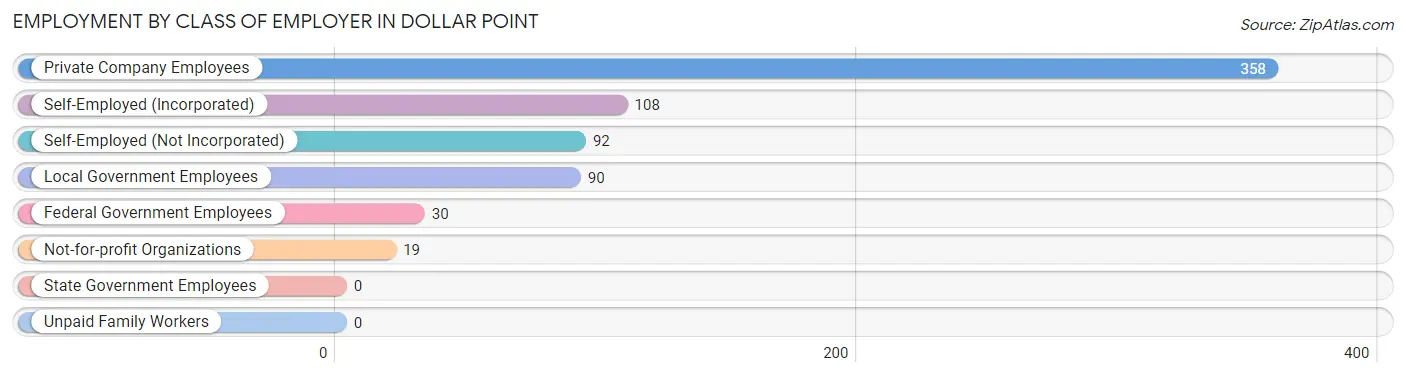
| Employer Class | # Employees | % Employees |
| Private Company Employees | 358 | 51.4% |
| Self-Employed (Incorporated) | 108 | 15.5% |
| Self-Employed (Not Incorporated) | 92 | 13.2% |
| Not-for-profit Organizations | 19 | 2.7% |
| Local Government Employees | 90 | 12.9% |
| State Government Employees | 0 | 0.0% |
| Federal Government Employees | 30 | 4.3% |
| Unpaid Family Workers | 0 | 0.0% |
| Total | 697 | 100.0% |
Employment Status by Age in Dollar Point
According to the labor force statistics for Dollar Point, out of the total population over 16 years of age (1,045), 68.4% or 715 individuals are in the labor force, with 2.5% or 18 of them unemployed. The age group with the highest labor force participation rate is 30 to 34 years, with 100.0% or 117 individuals in the labor force. Within the labor force, the 65 to 74 years age range has the highest percentage of unemployed individuals, with 23.7% or 18 of them being unemployed.
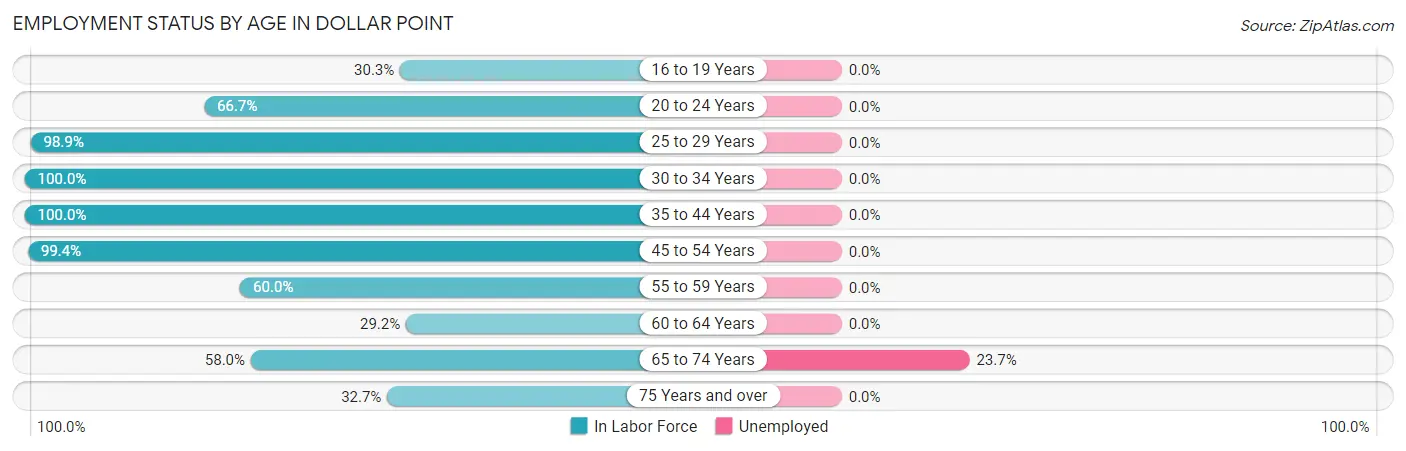
| Age Bracket | In Labor Force | Unemployed |
| 16 to 19 Years | 10 (30.3%) | 0 (0.0%) |
| 20 to 24 Years | 56 (66.7%) | 0 (0.0%) |
| 25 to 29 Years | 91 (98.9%) | 0 (0.0%) |
| 30 to 34 Years | 117 (100.0%) | 0 (0.0%) |
| 35 to 44 Years | 80 (100.0%) | 0 (0.0%) |
| 45 to 54 Years | 169 (99.4%) | 0 (0.0%) |
| 55 to 59 Years | 27 (60.0%) | 0 (0.0%) |
| 60 to 64 Years | 57 (29.2%) | 0 (0.0%) |
| 65 to 74 Years | 76 (58.0%) | 18 (23.7%) |
| 75 Years and over | 32 (32.7%) | 0 (0.0%) |
| Total | 715 (68.4%) | 18 (2.5%) |
Employment Status by Educational Attainment in Dollar Point
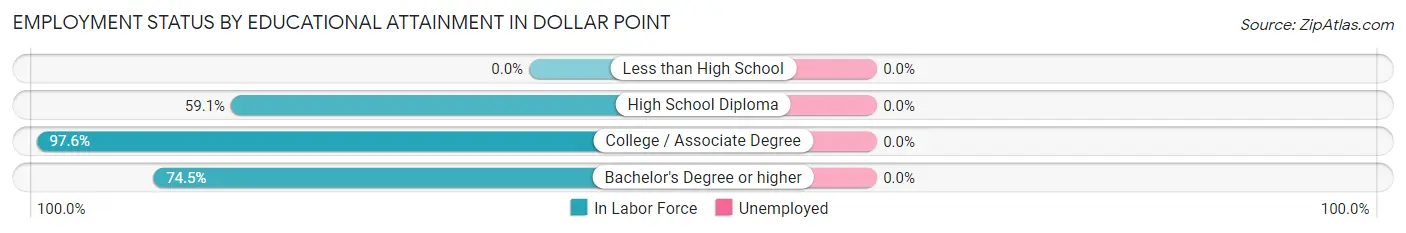
| Educational Attainment | In Labor Force | Unemployed |
| Less than High School | 0 (0.0%) | 0 (0.0%) |
| High School Diploma | 52 (59.1%) | 0 (0.0%) |
| College / Associate Degree | 200 (97.6%) | 0 (0.0%) |
| Bachelor's Degree or higher | 289 (74.5%) | 0 (0.0%) |
| Total | 541 (77.4%) | 0 (0.0%) |
Employment Occupations by Sex in Dollar Point
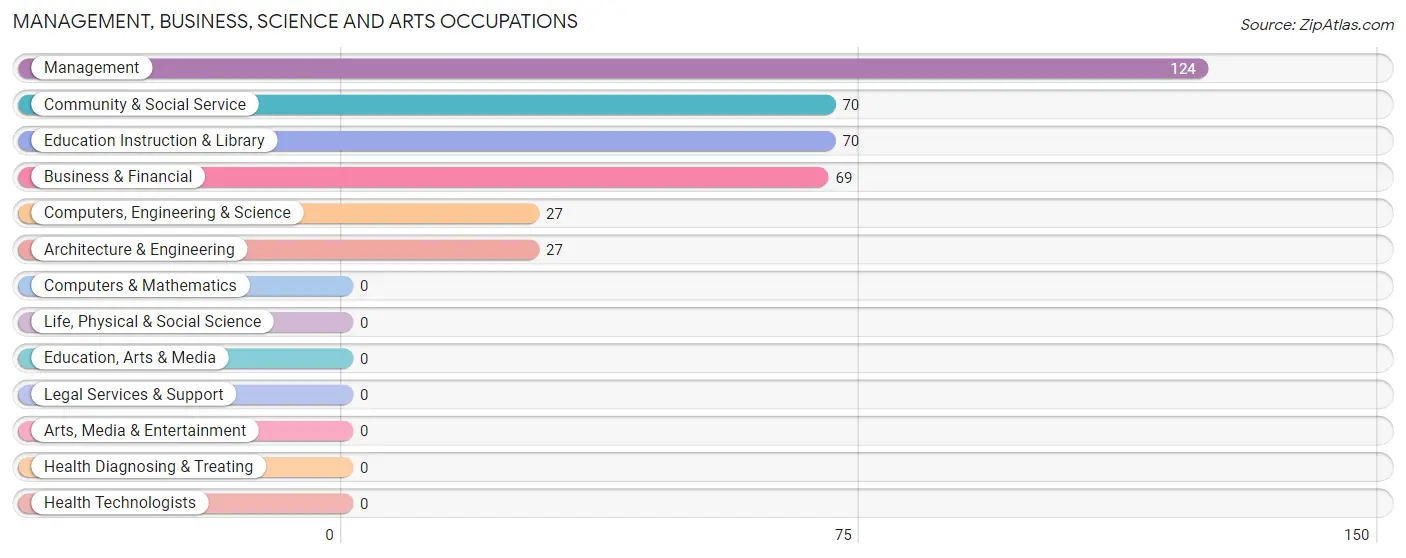
Management, Business, Science and Arts Occupations
The most common Management, Business, Science and Arts occupations in Dollar Point are Management (124 | 17.8%), Community & Social Service (70 | 10.0%), Education Instruction & Library (70 | 10.0%), Business & Financial (69 | 9.9%), and Computers, Engineering & Science (27 | 3.9%).
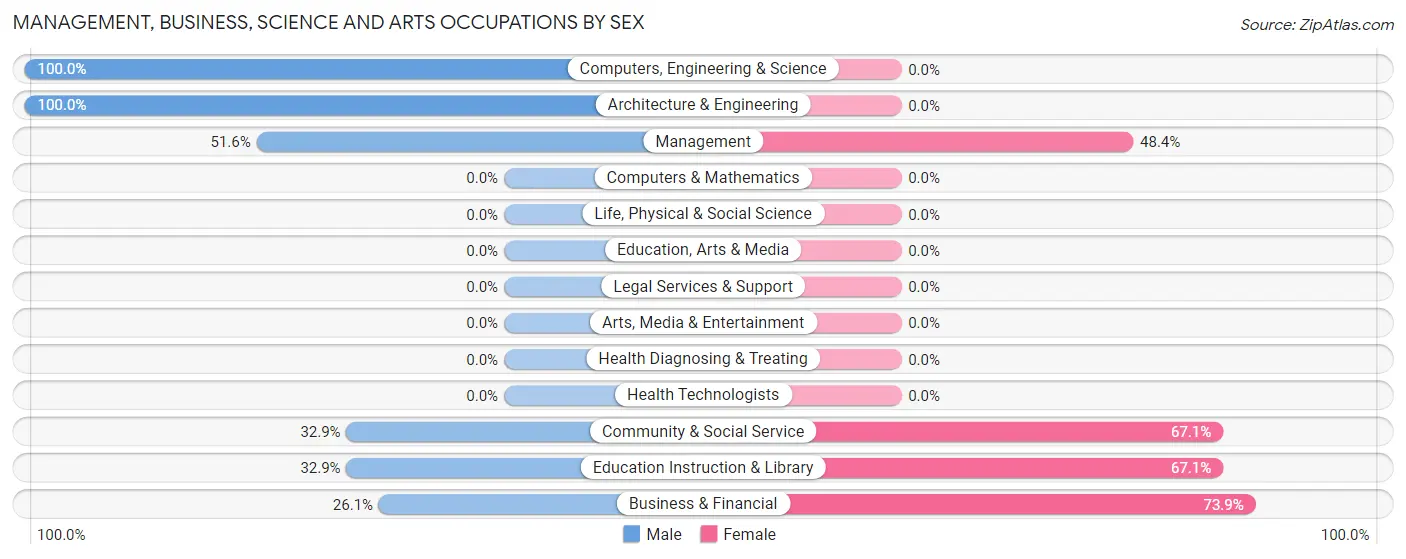
Management, Business, Science and Arts Occupations by Sex
Within the Management, Business, Science and Arts occupations in Dollar Point, the most male-oriented occupations are Computers, Engineering & Science (100.0%), Architecture & Engineering (100.0%), and Management (51.6%), while the most female-oriented occupations are Business & Financial (73.9%), Community & Social Service (67.1%), and Education Instruction & Library (67.1%).
| Occupation | Male | Female |
| Management | 64 (51.6%) | 60 (48.4%) |
| Business & Financial | 18 (26.1%) | 51 (73.9%) |
| Computers, Engineering & Science | 27 (100.0%) | 0 (0.0%) |
| Computers & Mathematics | 0 (0.0%) | 0 (0.0%) |
| Architecture & Engineering | 27 (100.0%) | 0 (0.0%) |
| Life, Physical & Social Science | 0 (0.0%) | 0 (0.0%) |
| Community & Social Service | 23 (32.9%) | 47 (67.1%) |
| Education, Arts & Media | 0 (0.0%) | 0 (0.0%) |
| Legal Services & Support | 0 (0.0%) | 0 (0.0%) |
| Education Instruction & Library | 23 (32.9%) | 47 (67.1%) |
| Arts, Media & Entertainment | 0 (0.0%) | 0 (0.0%) |
| Health Diagnosing & Treating | 0 (0.0%) | 0 (0.0%) |
| Health Technologists | 0 (0.0%) | 0 (0.0%) |
| Total (Category) | 132 (45.5%) | 158 (54.5%) |
| Total (Overall) | 324 (46.5%) | 373 (53.5%) |
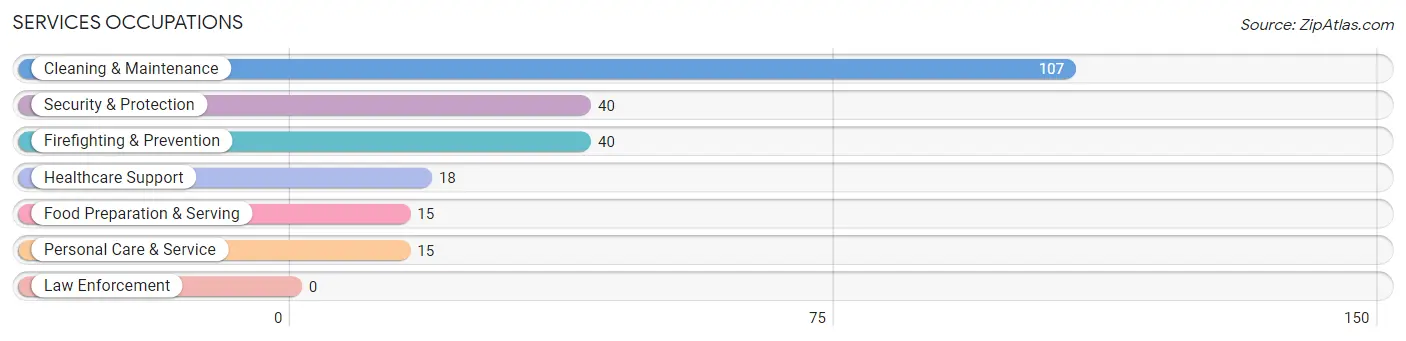
Services Occupations
The most common Services occupations in Dollar Point are Cleaning & Maintenance (107 | 15.3%), Security & Protection (40 | 5.7%), Firefighting & Prevention (40 | 5.7%), Healthcare Support (18 | 2.6%), and Food Preparation & Serving (15 | 2.1%).
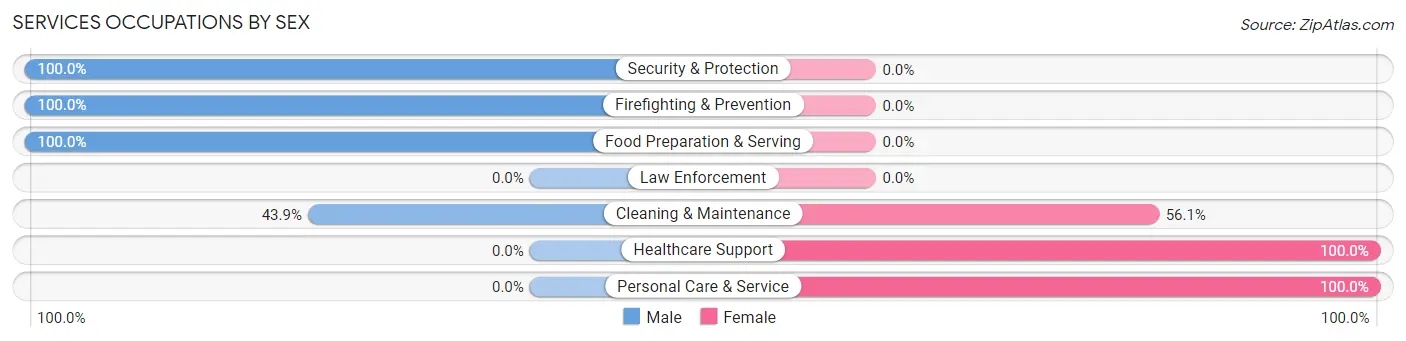
Services Occupations by Sex
Within the Services occupations in Dollar Point, the most male-oriented occupations are Security & Protection (100.0%), Firefighting & Prevention (100.0%), and Food Preparation & Serving (100.0%), while the most female-oriented occupations are Healthcare Support (100.0%), Personal Care & Service (100.0%), and Cleaning & Maintenance (56.1%).
| Occupation | Male | Female |
| Healthcare Support | 0 (0.0%) | 18 (100.0%) |
| Security & Protection | 40 (100.0%) | 0 (0.0%) |
| Firefighting & Prevention | 40 (100.0%) | 0 (0.0%) |
| Law Enforcement | 0 (0.0%) | 0 (0.0%) |
| Food Preparation & Serving | 15 (100.0%) | 0 (0.0%) |
| Cleaning & Maintenance | 47 (43.9%) | 60 (56.1%) |
| Personal Care & Service | 0 (0.0%) | 15 (100.0%) |
| Total (Category) | 102 (52.3%) | 93 (47.7%) |
| Total (Overall) | 324 (46.5%) | 373 (53.5%) |
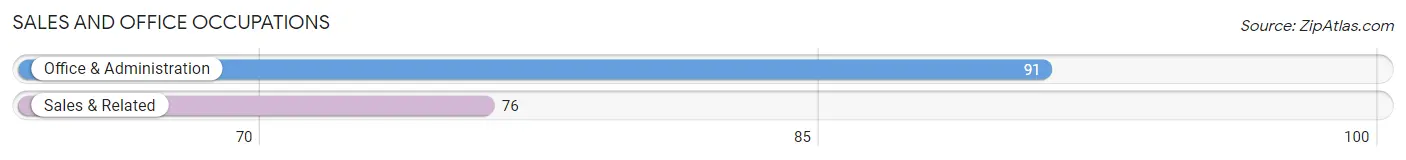
Sales and Office Occupations
The most common Sales and Office occupations in Dollar Point are Office & Administration (91 | 13.1%), and Sales & Related (76 | 10.9%).
Sales and Office Occupations by Sex
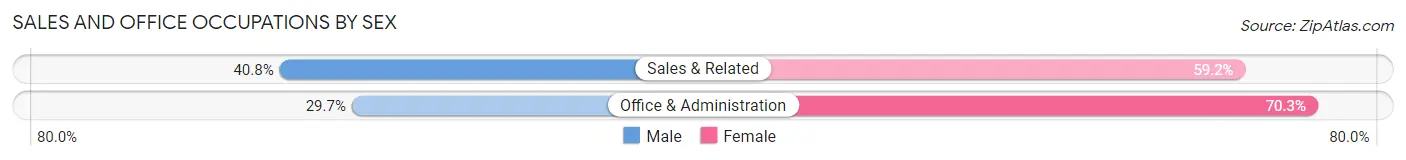
| Occupation | Male | Female |
| Sales & Related | 31 (40.8%) | 45 (59.2%) |
| Office & Administration | 27 (29.7%) | 64 (70.3%) |
| Total (Category) | 58 (34.7%) | 109 (65.3%) |
| Total (Overall) | 324 (46.5%) | 373 (53.5%) |
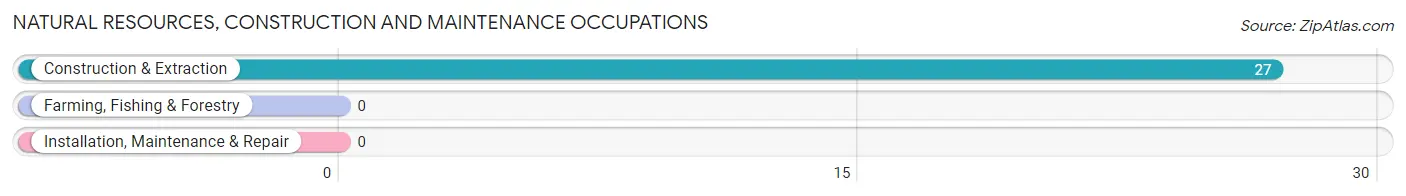
Natural Resources, Construction and Maintenance Occupations
The most common Natural Resources, Construction and Maintenance occupations in Dollar Point are , and Construction & Extraction (27 | 3.9%).
Natural Resources, Construction and Maintenance Occupations by Sex
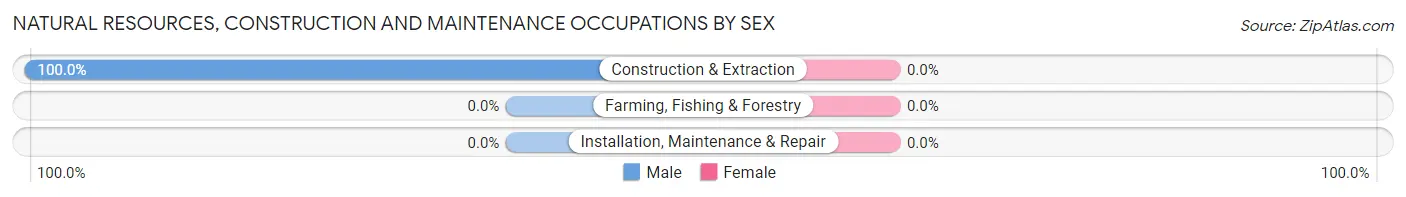
| Occupation | Male | Female |
| Farming, Fishing & Forestry | 0 (0.0%) | 0 (0.0%) |
| Construction & Extraction | 27 (100.0%) | 0 (0.0%) |
| Installation, Maintenance & Repair | 0 (0.0%) | 0 (0.0%) |
| Total (Category) | 27 (100.0%) | 0 (0.0%) |
| Total (Overall) | 324 (46.5%) | 373 (53.5%) |
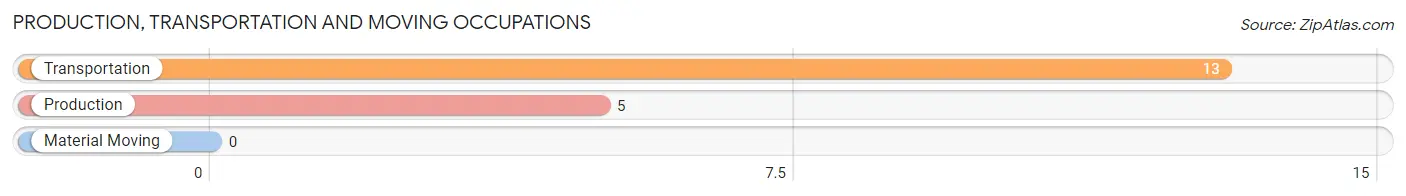
Production, Transportation and Moving Occupations
The most common Production, Transportation and Moving occupations in Dollar Point are Transportation (13 | 1.9%), and Production (5 | 0.7%).
Production, Transportation and Moving Occupations by Sex
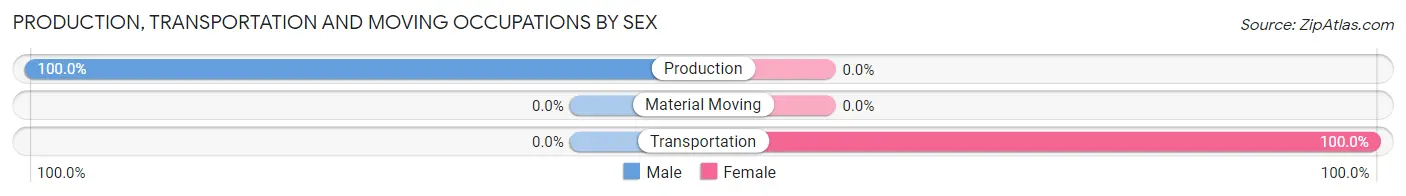
| Occupation | Male | Female |
| Production | 5 (100.0%) | 0 (0.0%) |
| Transportation | 0 (0.0%) | 13 (100.0%) |
| Material Moving | 0 (0.0%) | 0 (0.0%) |
| Total (Category) | 5 (27.8%) | 13 (72.2%) |
| Total (Overall) | 324 (46.5%) | 373 (53.5%) |
Employment Industries by Sex in Dollar Point
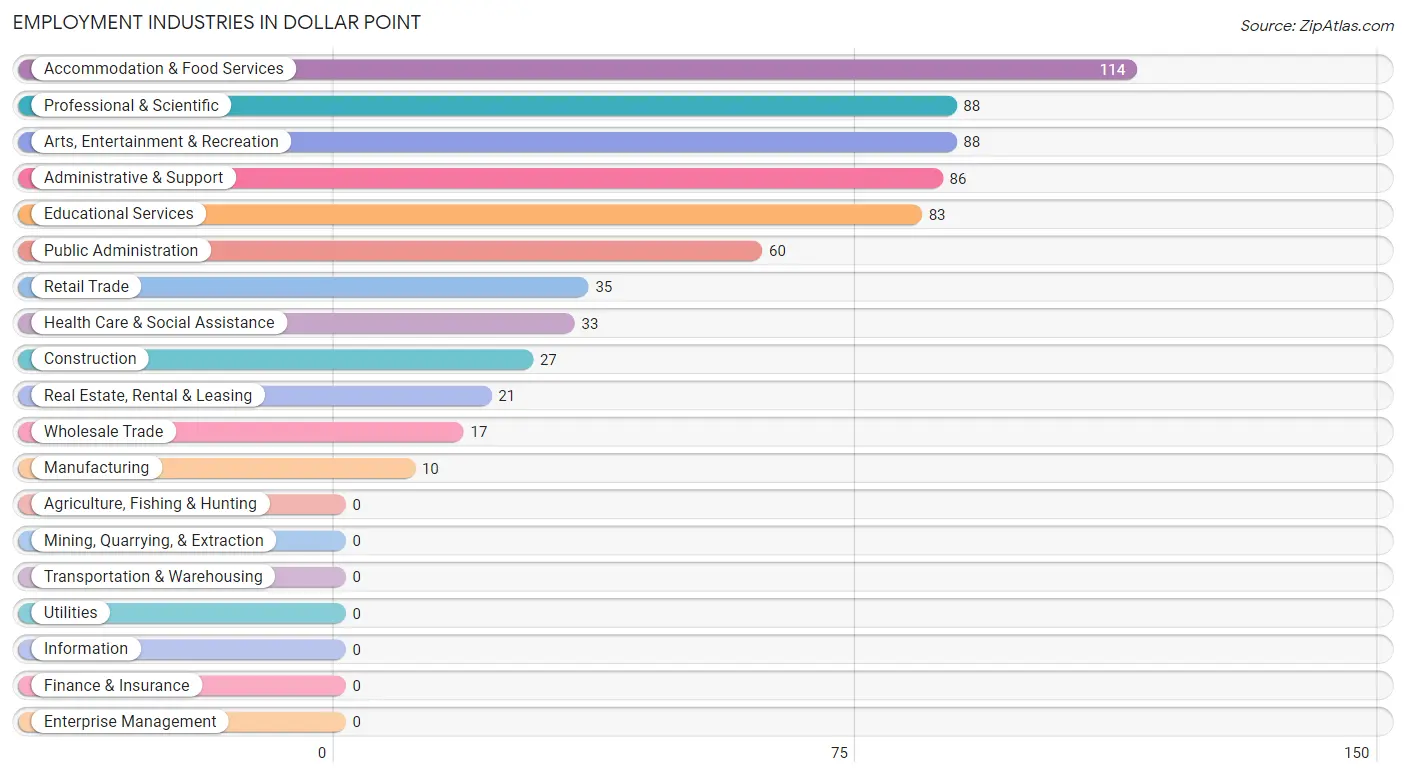
Employment Industries in Dollar Point
The major employment industries in Dollar Point include Accommodation & Food Services (114 | 16.4%), Professional & Scientific (88 | 12.6%), Arts, Entertainment & Recreation (88 | 12.6%), Administrative & Support (86 | 12.3%), and Educational Services (83 | 11.9%).
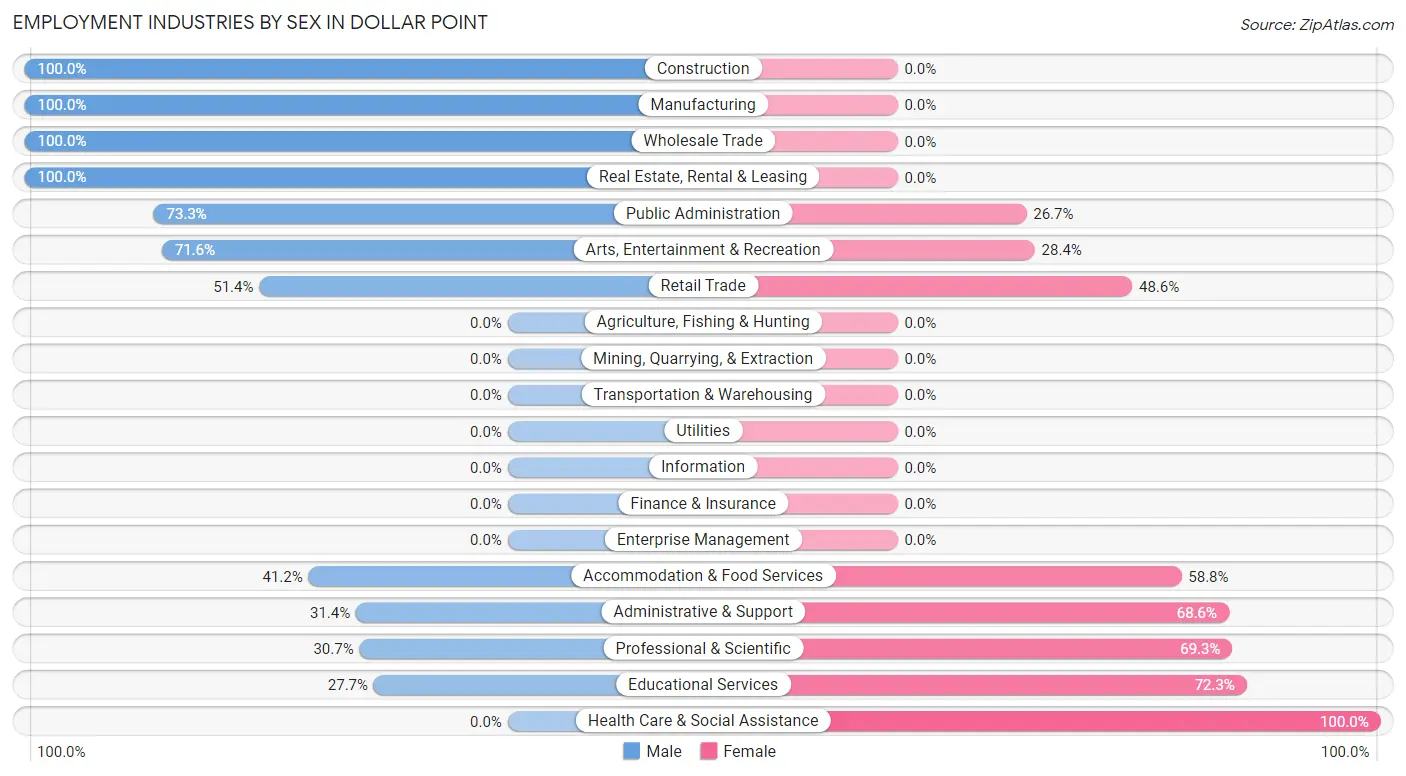
Employment Industries by Sex in Dollar Point
The Dollar Point industries that see more men than women are Construction (100.0%), Manufacturing (100.0%), and Wholesale Trade (100.0%), whereas the industries that tend to have a higher number of women are Health Care & Social Assistance (100.0%), Educational Services (72.3%), and Professional & Scientific (69.3%).
| Industry | Male | Female |
| Agriculture, Fishing & Hunting | 0 (0.0%) | 0 (0.0%) |
| Mining, Quarrying, & Extraction | 0 (0.0%) | 0 (0.0%) |
| Construction | 27 (100.0%) | 0 (0.0%) |
| Manufacturing | 10 (100.0%) | 0 (0.0%) |
| Wholesale Trade | 17 (100.0%) | 0 (0.0%) |
| Retail Trade | 18 (51.4%) | 17 (48.6%) |
| Transportation & Warehousing | 0 (0.0%) | 0 (0.0%) |
| Utilities | 0 (0.0%) | 0 (0.0%) |
| Information | 0 (0.0%) | 0 (0.0%) |
| Finance & Insurance | 0 (0.0%) | 0 (0.0%) |
| Real Estate, Rental & Leasing | 21 (100.0%) | 0 (0.0%) |
| Professional & Scientific | 27 (30.7%) | 61 (69.3%) |
| Enterprise Management | 0 (0.0%) | 0 (0.0%) |
| Administrative & Support | 27 (31.4%) | 59 (68.6%) |
| Educational Services | 23 (27.7%) | 60 (72.3%) |
| Health Care & Social Assistance | 0 (0.0%) | 33 (100.0%) |
| Arts, Entertainment & Recreation | 63 (71.6%) | 25 (28.4%) |
| Accommodation & Food Services | 47 (41.2%) | 67 (58.8%) |
| Public Administration | 44 (73.3%) | 16 (26.7%) |
| Total | 324 (46.5%) | 373 (53.5%) |
Education in Dollar Point
School Enrollment in Dollar Point
The most common levels of schooling among the 172 students in Dollar Point are high school (79 | 45.9%), middle school (34 | 19.8%), and college / undergraduate (28 | 16.3%).
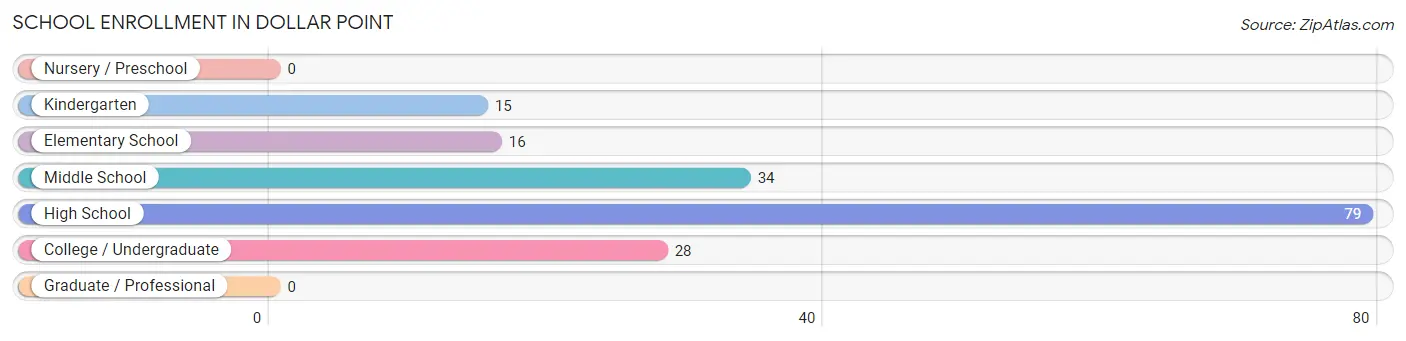
| School Level | # Students | % Students |
| Nursery / Preschool | 0 | 0.0% |
| Kindergarten | 15 | 8.7% |
| Elementary School | 16 | 9.3% |
| Middle School | 34 | 19.8% |
| High School | 79 | 45.9% |
| College / Undergraduate | 28 | 16.3% |
| Graduate / Professional | 0 | 0.0% |
| Total | 172 | 100.0% |
School Enrollment by Age by Funding Source in Dollar Point
Out of a total of 172 students who are enrolled in schools in Dollar Point, 47 (27.3%) attend a private institution, while the remaining 125 (72.7%) are enrolled in public schools. The age group of 5 to 9 year old has the highest likelihood of being enrolled in private schools, with 15 (100.0% in the age bracket) enrolled. Conversely, the age group of 15 to 17 year olds has the lowest likelihood of being enrolled in a private school, with 10 (100.0% in the age bracket) attending a public institution.
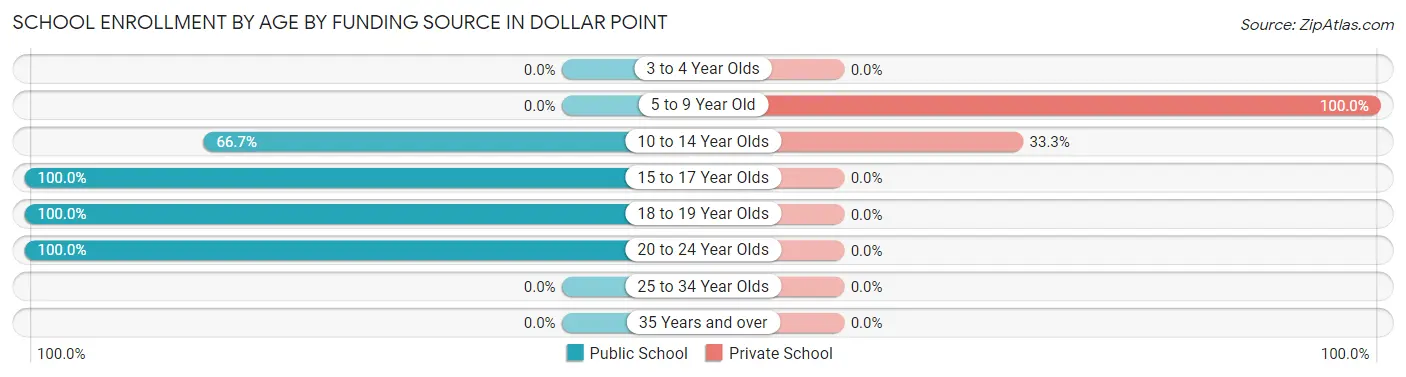
| Age Bracket | Public School | Private School |
| 3 to 4 Year Olds | 0 (0.0%) | 0 (0.0%) |
| 5 to 9 Year Old | 0 (0.0%) | 15 (100.0%) |
| 10 to 14 Year Olds | 64 (66.7%) | 32 (33.3%) |
| 15 to 17 Year Olds | 10 (100.0%) | 0 (0.0%) |
| 18 to 19 Year Olds | 23 (100.0%) | 0 (0.0%) |
| 20 to 24 Year Olds | 28 (100.0%) | 0 (0.0%) |
| 25 to 34 Year Olds | 0 (0.0%) | 0 (0.0%) |
| 35 Years and over | 0 (0.0%) | 0 (0.0%) |
| Total | 125 (72.7%) | 47 (27.3%) |
Educational Attainment by Field of Study in Dollar Point
Business (87 | 16.0%), education (83 | 15.3%), bio, nature & agricultural (77 | 14.1%), psychology (54 | 9.9%), and engineering (49 | 9.0%) are the most common fields of study among 544 individuals in Dollar Point who have obtained a bachelor's degree or higher.
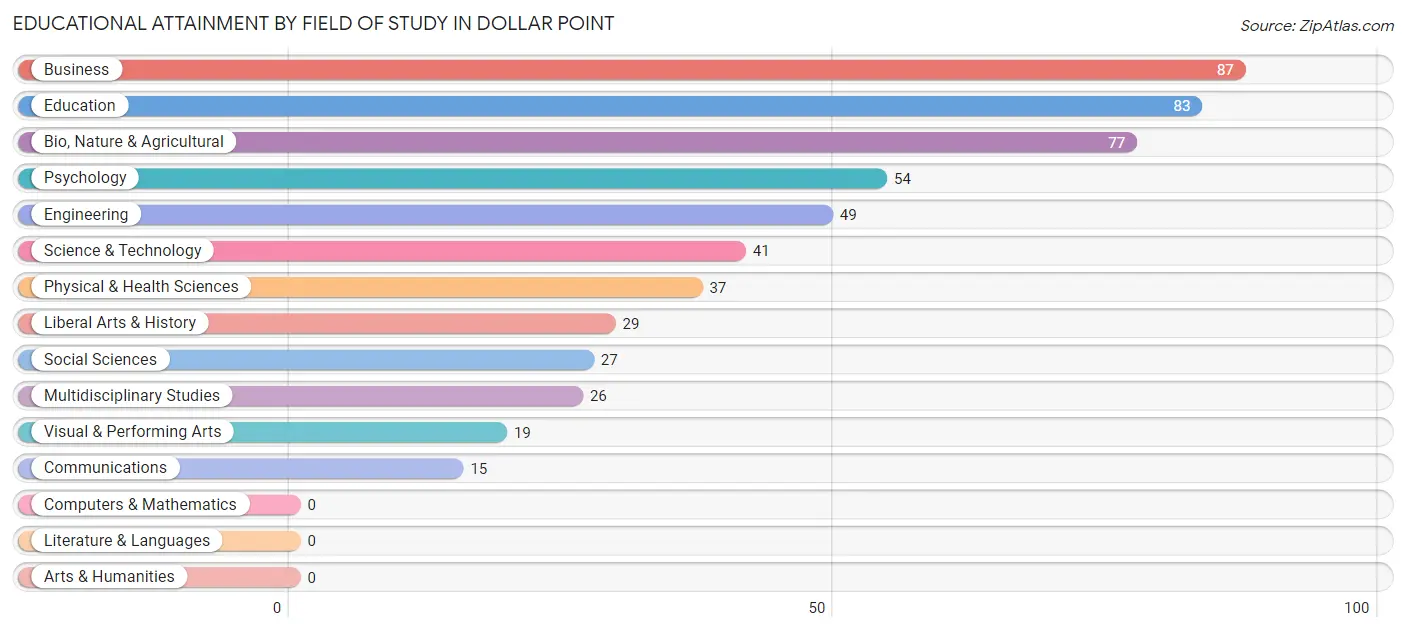
| Field of Study | # Graduates | % Graduates |
| Computers & Mathematics | 0 | 0.0% |
| Bio, Nature & Agricultural | 77 | 14.1% |
| Physical & Health Sciences | 37 | 6.8% |
| Psychology | 54 | 9.9% |
| Social Sciences | 27 | 5.0% |
| Engineering | 49 | 9.0% |
| Multidisciplinary Studies | 26 | 4.8% |
| Science & Technology | 41 | 7.5% |
| Business | 87 | 16.0% |
| Education | 83 | 15.3% |
| Literature & Languages | 0 | 0.0% |
| Liberal Arts & History | 29 | 5.3% |
| Visual & Performing Arts | 19 | 3.5% |
| Communications | 15 | 2.8% |
| Arts & Humanities | 0 | 0.0% |
| Total | 544 | 100.0% |
Transportation & Commute in Dollar Point
Vehicle Availability by Sex in Dollar Point
The most prevalent vehicle ownership categories in Dollar Point are males with 2 vehicles (147, accounting for 45.4%) and females with 2 vehicles (139, making up 39.4%).
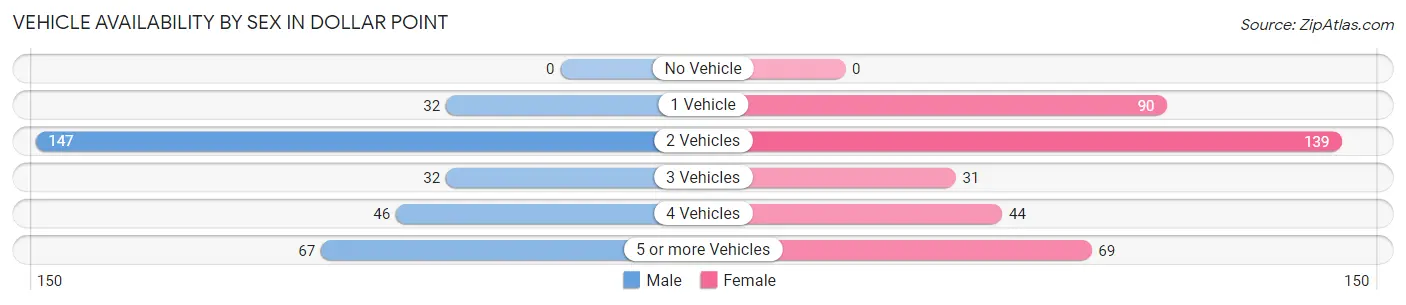
| Vehicles Available | Male | Female |
| No Vehicle | 0 (0.0%) | 0 (0.0%) |
| 1 Vehicle | 32 (9.9%) | 90 (24.1%) |
| 2 Vehicles | 147 (45.4%) | 139 (37.3%) |
| 3 Vehicles | 32 (9.9%) | 31 (8.3%) |
| 4 Vehicles | 46 (14.2%) | 44 (11.8%) |
| 5 or more Vehicles | 67 (20.7%) | 69 (18.5%) |
| Total | 324 (100.0%) | 373 (100.0%) |
Commute Time in Dollar Point
The most frequently occuring commute durations in Dollar Point are 5 to 9 minutes (197 commuters, 33.2%), 15 to 19 minutes (133 commuters, 22.4%), and 10 to 14 minutes (112 commuters, 18.9%).
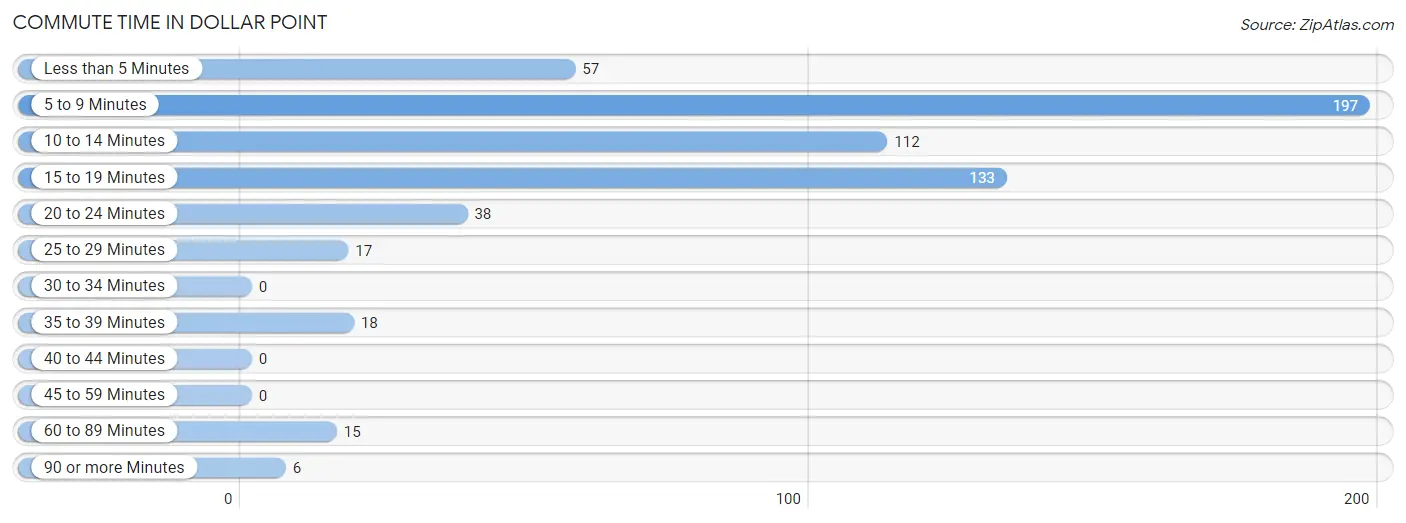
| Commute Time | # Commuters | % Commuters |
| Less than 5 Minutes | 57 | 9.6% |
| 5 to 9 Minutes | 197 | 33.2% |
| 10 to 14 Minutes | 112 | 18.9% |
| 15 to 19 Minutes | 133 | 22.4% |
| 20 to 24 Minutes | 38 | 6.4% |
| 25 to 29 Minutes | 17 | 2.9% |
| 30 to 34 Minutes | 0 | 0.0% |
| 35 to 39 Minutes | 18 | 3.0% |
| 40 to 44 Minutes | 0 | 0.0% |
| 45 to 59 Minutes | 0 | 0.0% |
| 60 to 89 Minutes | 15 | 2.5% |
| 90 or more Minutes | 6 | 1.0% |
Commute Time by Sex in Dollar Point
The most common commute times in Dollar Point are 15 to 19 minutes (105 commuters, 36.3%) for males and 5 to 9 minutes (108 commuters, 35.5%) for females.
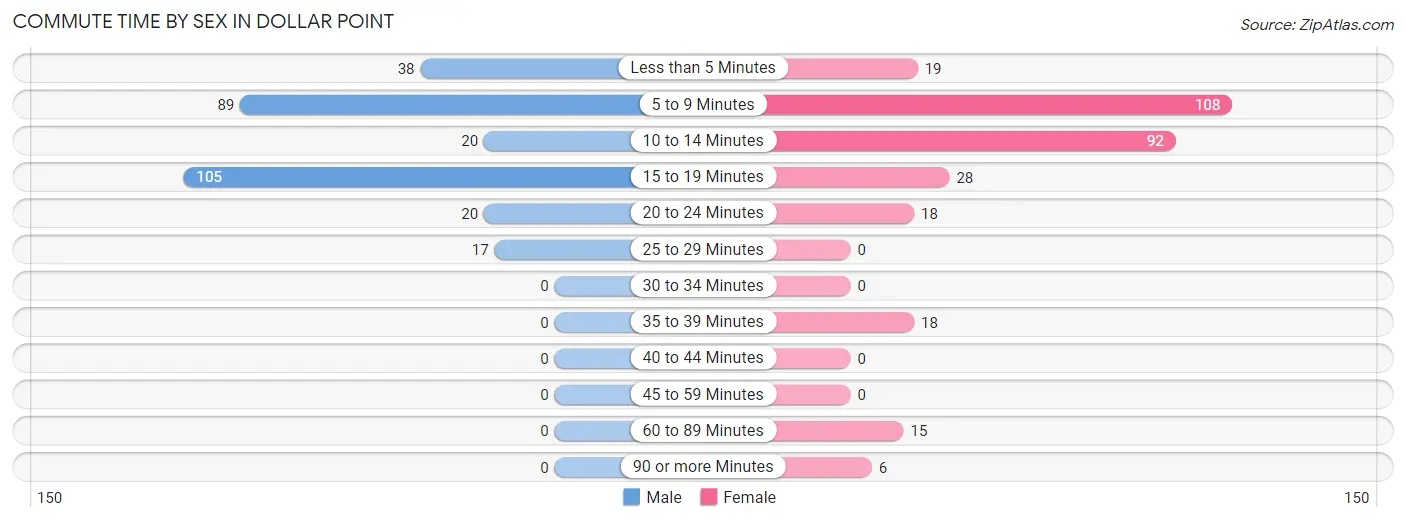
| Commute Time | Male | Female |
| Less than 5 Minutes | 38 (13.2%) | 19 (6.2%) |
| 5 to 9 Minutes | 89 (30.8%) | 108 (35.5%) |
| 10 to 14 Minutes | 20 (6.9%) | 92 (30.3%) |
| 15 to 19 Minutes | 105 (36.3%) | 28 (9.2%) |
| 20 to 24 Minutes | 20 (6.9%) | 18 (5.9%) |
| 25 to 29 Minutes | 17 (5.9%) | 0 (0.0%) |
| 30 to 34 Minutes | 0 (0.0%) | 0 (0.0%) |
| 35 to 39 Minutes | 0 (0.0%) | 18 (5.9%) |
| 40 to 44 Minutes | 0 (0.0%) | 0 (0.0%) |
| 45 to 59 Minutes | 0 (0.0%) | 0 (0.0%) |
| 60 to 89 Minutes | 0 (0.0%) | 15 (4.9%) |
| 90 or more Minutes | 0 (0.0%) | 6 (2.0%) |
Time of Departure to Work by Sex in Dollar Point
The most frequent times of departure to work in Dollar Point are 9:00 AM to 9:59 AM (103, 35.6%) for males and 7:30 AM to 7:59 AM (93, 30.6%) for females.
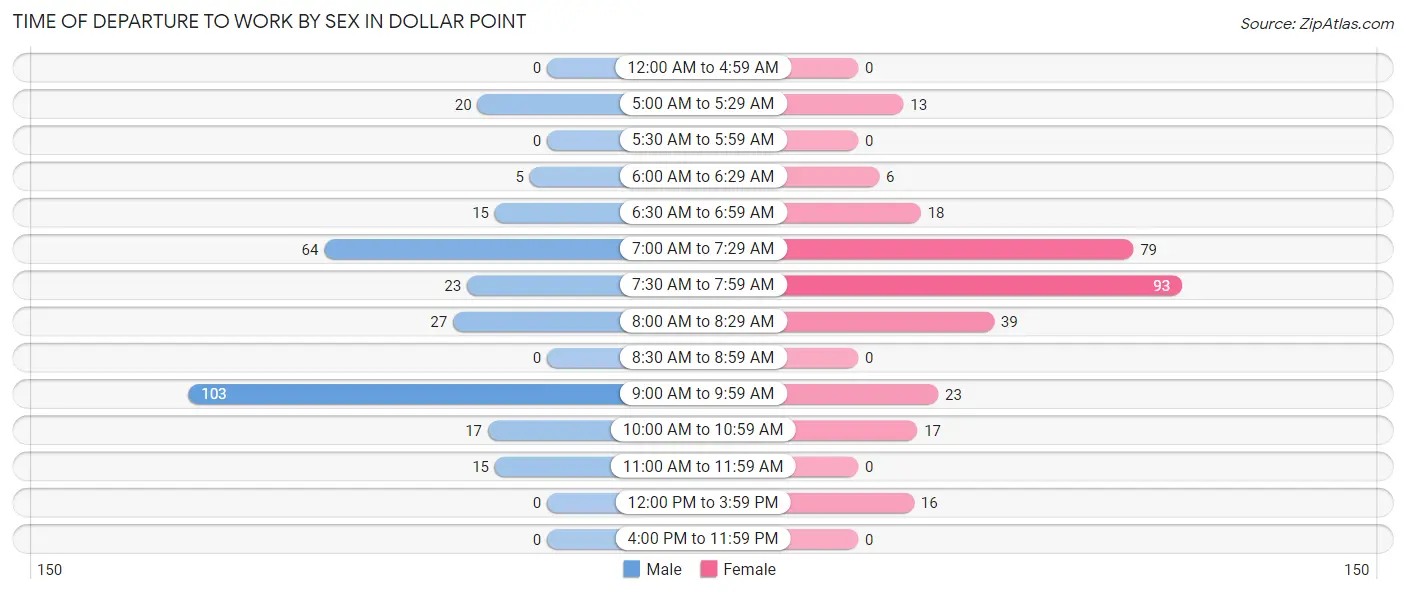
| Time of Departure | Male | Female |
| 12:00 AM to 4:59 AM | 0 (0.0%) | 0 (0.0%) |
| 5:00 AM to 5:29 AM | 20 (6.9%) | 13 (4.3%) |
| 5:30 AM to 5:59 AM | 0 (0.0%) | 0 (0.0%) |
| 6:00 AM to 6:29 AM | 5 (1.7%) | 6 (2.0%) |
| 6:30 AM to 6:59 AM | 15 (5.2%) | 18 (5.9%) |
| 7:00 AM to 7:29 AM | 64 (22.2%) | 79 (26.0%) |
| 7:30 AM to 7:59 AM | 23 (8.0%) | 93 (30.6%) |
| 8:00 AM to 8:29 AM | 27 (9.3%) | 39 (12.8%) |
| 8:30 AM to 8:59 AM | 0 (0.0%) | 0 (0.0%) |
| 9:00 AM to 9:59 AM | 103 (35.6%) | 23 (7.6%) |
| 10:00 AM to 10:59 AM | 17 (5.9%) | 17 (5.6%) |
| 11:00 AM to 11:59 AM | 15 (5.2%) | 0 (0.0%) |
| 12:00 PM to 3:59 PM | 0 (0.0%) | 16 (5.3%) |
| 4:00 PM to 11:59 PM | 0 (0.0%) | 0 (0.0%) |
| Total | 289 (100.0%) | 304 (100.0%) |
Housing Occupancy in Dollar Point
Occupancy by Ownership in Dollar Point
Of the total 508 dwellings in Dollar Point, owner-occupied units account for 366 (72.1%), while renter-occupied units make up 142 (28.0%).
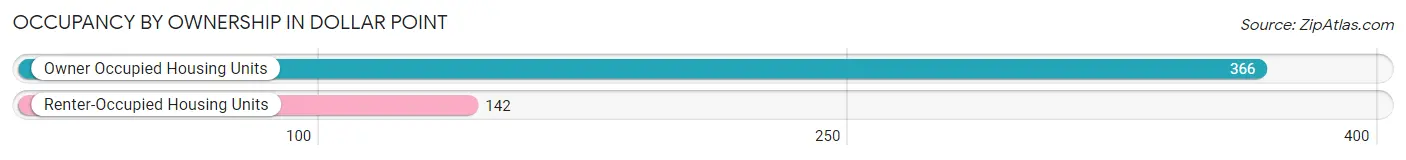
| Occupancy | # Housing Units | % Housing Units |
| Owner Occupied Housing Units | 366 | 72.1% |
| Renter-Occupied Housing Units | 142 | 28.0% |
| Total Occupied Housing Units | 508 | 100.0% |
Occupancy by Household Size in Dollar Point
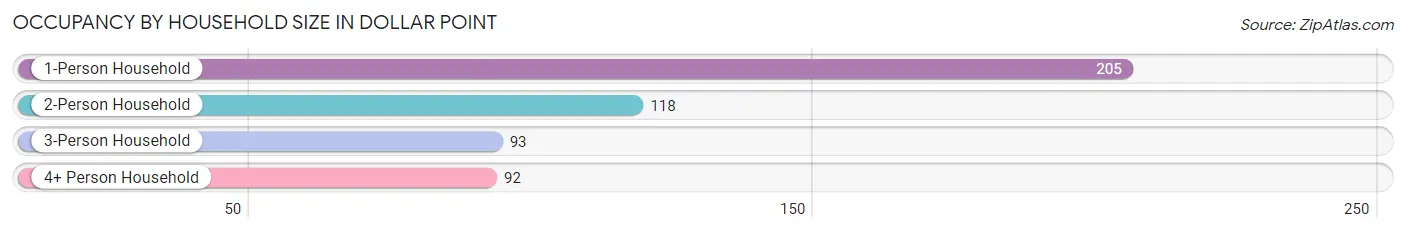
| Household Size | # Housing Units | % Housing Units |
| 1-Person Household | 205 | 40.4% |
| 2-Person Household | 118 | 23.2% |
| 3-Person Household | 93 | 18.3% |
| 4+ Person Household | 92 | 18.1% |
| Total Housing Units | 508 | 100.0% |
Occupancy by Ownership by Household Size in Dollar Point
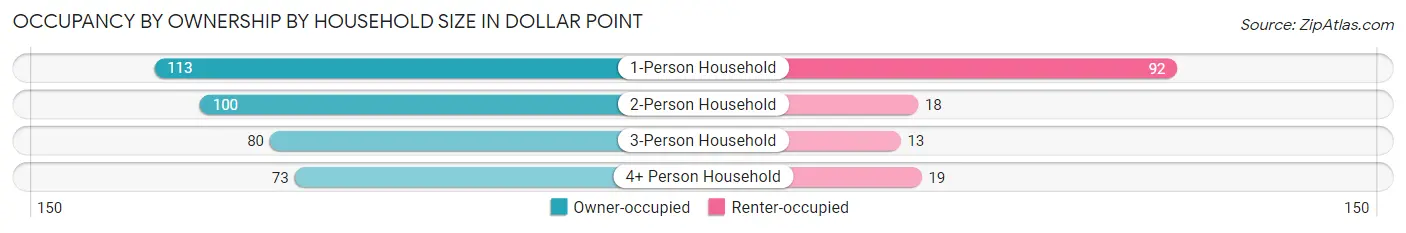
| Household Size | Owner-occupied | Renter-occupied |
| 1-Person Household | 113 (55.1%) | 92 (44.9%) |
| 2-Person Household | 100 (84.8%) | 18 (15.2%) |
| 3-Person Household | 80 (86.0%) | 13 (14.0%) |
| 4+ Person Household | 73 (79.3%) | 19 (20.6%) |
| Total Housing Units | 366 (72.1%) | 142 (28.0%) |
Occupancy by Educational Attainment in Dollar Point
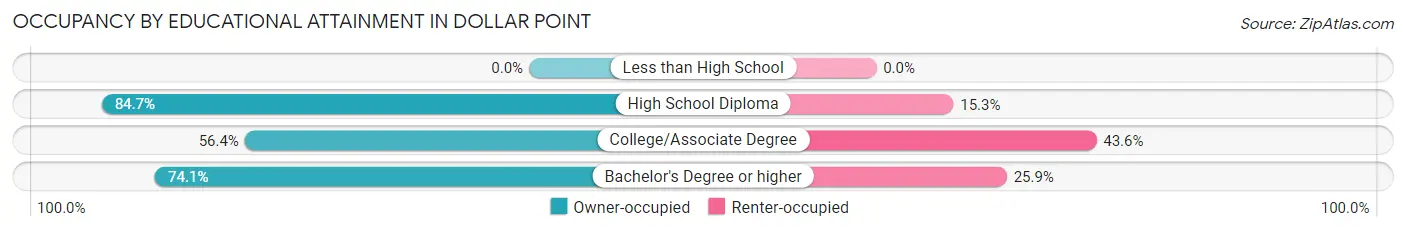
| Household Size | Owner-occupied | Renter-occupied |
| Less than High School | 0 (0.0%) | 0 (0.0%) |
| High School Diploma | 72 (84.7%) | 13 (15.3%) |
| College/Associate Degree | 62 (56.4%) | 48 (43.6%) |
| Bachelor's Degree or higher | 232 (74.1%) | 81 (25.9%) |
Occupancy by Age of Householder in Dollar Point
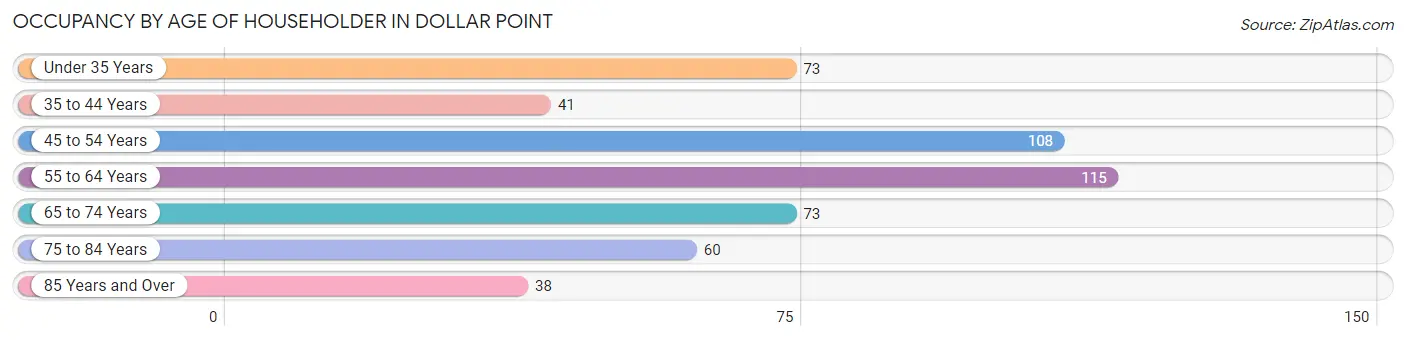
| Age Bracket | # Households | % Households |
| Under 35 Years | 73 | 14.4% |
| 35 to 44 Years | 41 | 8.1% |
| 45 to 54 Years | 108 | 21.3% |
| 55 to 64 Years | 115 | 22.6% |
| 65 to 74 Years | 73 | 14.4% |
| 75 to 84 Years | 60 | 11.8% |
| 85 Years and Over | 38 | 7.5% |
| Total | 508 | 100.0% |
Housing Finances in Dollar Point
Median Income by Occupancy in Dollar Point
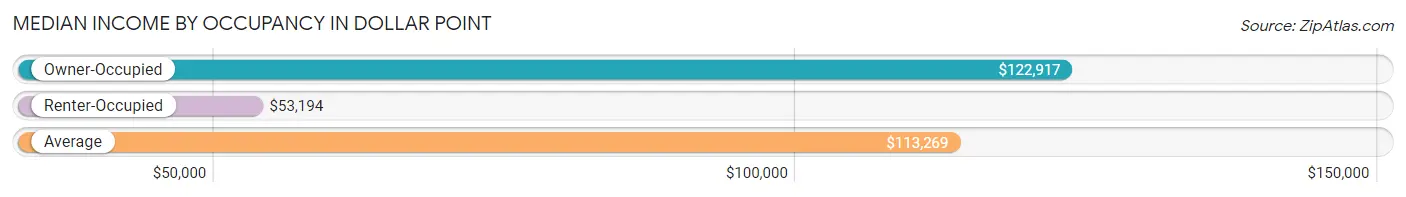
| Occupancy Type | # Households | Median Income |
| Owner-Occupied | 366 (72.1%) | $122,917 |
| Renter-Occupied | 142 (28.0%) | $53,194 |
| Average | 508 (100.0%) | $113,269 |
Occupancy by Householder Income Bracket in Dollar Point
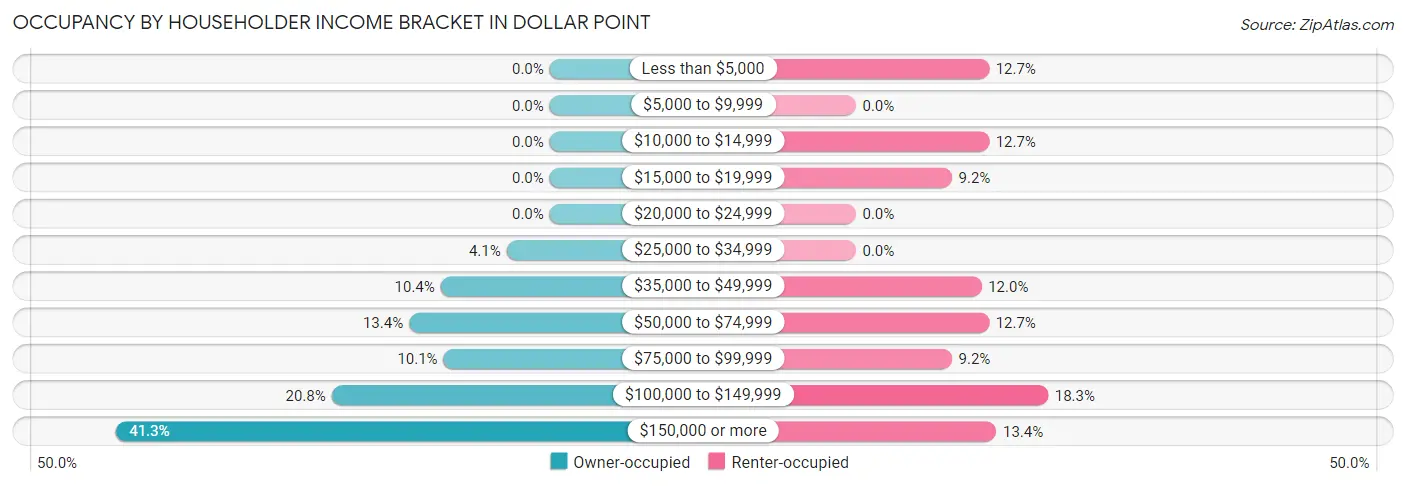
| Income Bracket | Owner-occupied | Renter-occupied |
| Less than $5,000 | 0 (0.0%) | 18 (12.7%) |
| $5,000 to $9,999 | 0 (0.0%) | 0 (0.0%) |
| $10,000 to $14,999 | 0 (0.0%) | 18 (12.7%) |
| $15,000 to $19,999 | 0 (0.0%) | 13 (9.1%) |
| $20,000 to $24,999 | 0 (0.0%) | 0 (0.0%) |
| $25,000 to $34,999 | 15 (4.1%) | 0 (0.0%) |
| $35,000 to $49,999 | 38 (10.4%) | 17 (12.0%) |
| $50,000 to $74,999 | 49 (13.4%) | 18 (12.7%) |
| $75,000 to $99,999 | 37 (10.1%) | 13 (9.1%) |
| $100,000 to $149,999 | 76 (20.8%) | 26 (18.3%) |
| $150,000 or more | 151 (41.3%) | 19 (13.4%) |
| Total | 366 (100.0%) | 142 (100.0%) |
Monthly Housing Cost Tiers in Dollar Point
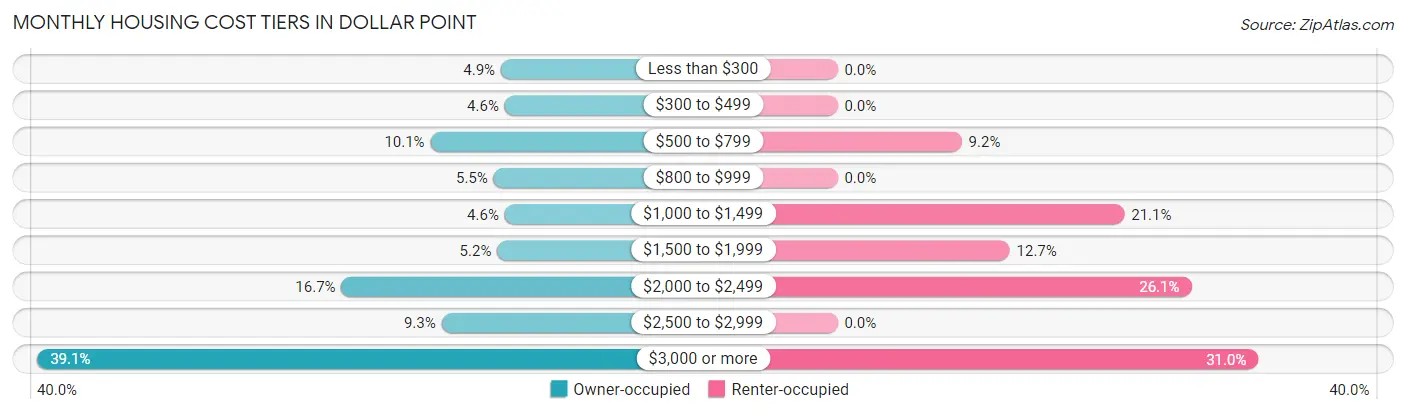
| Monthly Cost | Owner-occupied | Renter-occupied |
| Less than $300 | 18 (4.9%) | 0 (0.0%) |
| $300 to $499 | 17 (4.6%) | 0 (0.0%) |
| $500 to $799 | 37 (10.1%) | 13 (9.1%) |
| $800 to $999 | 20 (5.5%) | 0 (0.0%) |
| $1,000 to $1,499 | 17 (4.6%) | 30 (21.1%) |
| $1,500 to $1,999 | 19 (5.2%) | 18 (12.7%) |
| $2,000 to $2,499 | 61 (16.7%) | 37 (26.1%) |
| $2,500 to $2,999 | 34 (9.3%) | 0 (0.0%) |
| $3,000 or more | 143 (39.1%) | 44 (31.0%) |
| Total | 366 (100.0%) | 142 (100.0%) |
Physical Housing Characteristics in Dollar Point
Housing Structures in Dollar Point
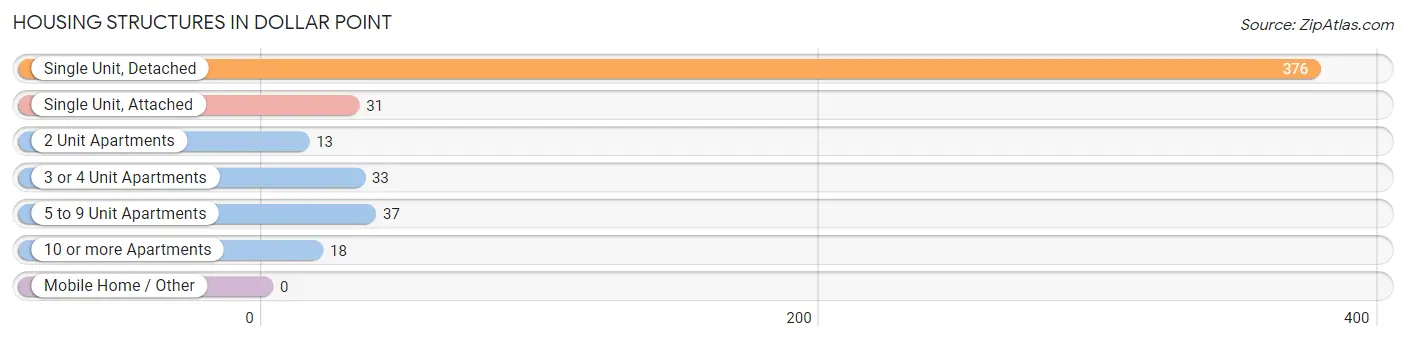
| Structure Type | # Housing Units | % Housing Units |
| Single Unit, Detached | 376 | 74.0% |
| Single Unit, Attached | 31 | 6.1% |
| 2 Unit Apartments | 13 | 2.6% |
| 3 or 4 Unit Apartments | 33 | 6.5% |
| 5 to 9 Unit Apartments | 37 | 7.3% |
| 10 or more Apartments | 18 | 3.5% |
| Mobile Home / Other | 0 | 0.0% |
| Total | 508 | 100.0% |
Housing Structures by Occupancy in Dollar Point
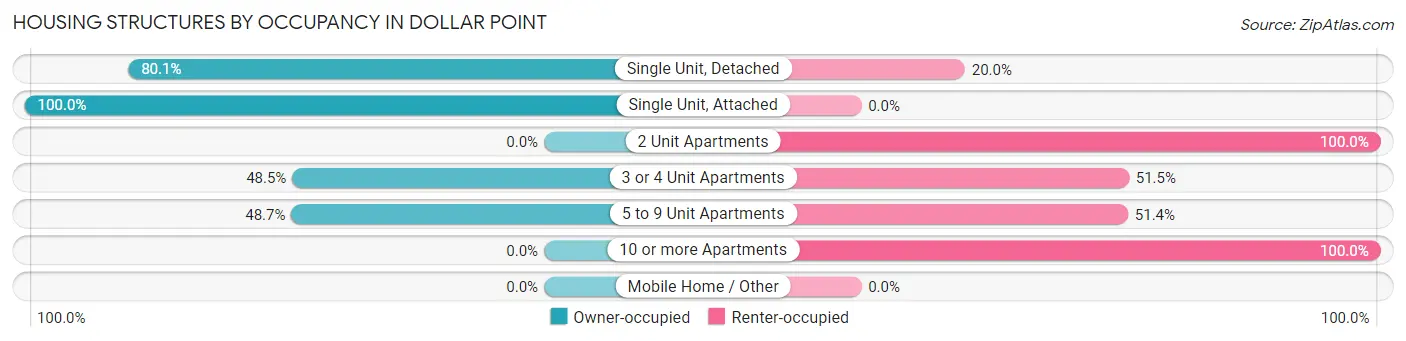
| Structure Type | Owner-occupied | Renter-occupied |
| Single Unit, Detached | 301 (80.0%) | 75 (20.0%) |
| Single Unit, Attached | 31 (100.0%) | 0 (0.0%) |
| 2 Unit Apartments | 0 (0.0%) | 13 (100.0%) |
| 3 or 4 Unit Apartments | 16 (48.5%) | 17 (51.5%) |
| 5 to 9 Unit Apartments | 18 (48.6%) | 19 (51.3%) |
| 10 or more Apartments | 0 (0.0%) | 18 (100.0%) |
| Mobile Home / Other | 0 (0.0%) | 0 (0.0%) |
| Total | 366 (72.1%) | 142 (28.0%) |
Housing Structures by Number of Rooms in Dollar Point
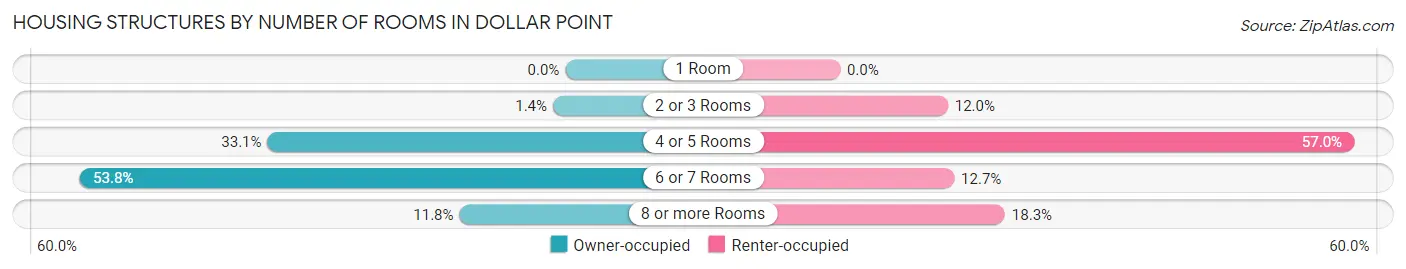
| Number of Rooms | Owner-occupied | Renter-occupied |
| 1 Room | 0 (0.0%) | 0 (0.0%) |
| 2 or 3 Rooms | 5 (1.4%) | 17 (12.0%) |
| 4 or 5 Rooms | 121 (33.1%) | 81 (57.0%) |
| 6 or 7 Rooms | 197 (53.8%) | 18 (12.7%) |
| 8 or more Rooms | 43 (11.7%) | 26 (18.3%) |
| Total | 366 (100.0%) | 142 (100.0%) |
Housing Structure by Heating Type in Dollar Point
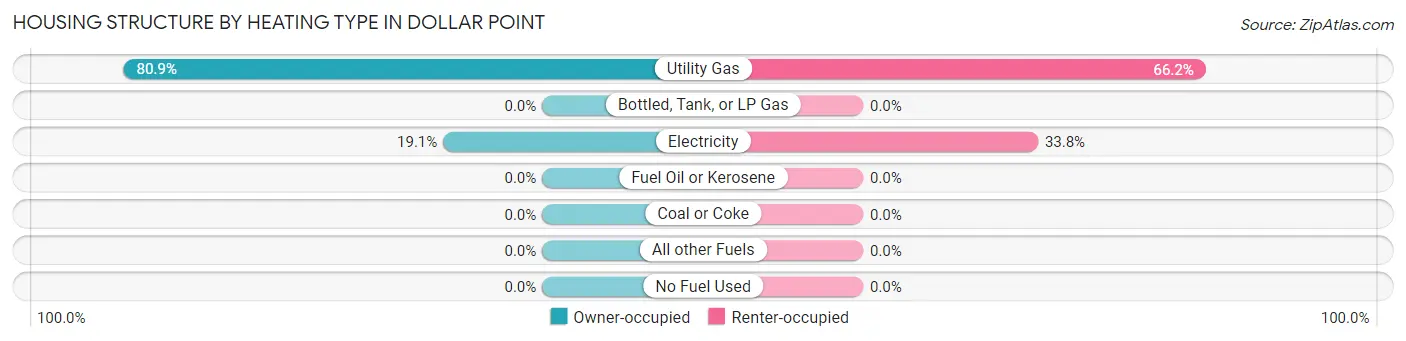
| Heating Type | Owner-occupied | Renter-occupied |
| Utility Gas | 296 (80.9%) | 94 (66.2%) |
| Bottled, Tank, or LP Gas | 0 (0.0%) | 0 (0.0%) |
| Electricity | 70 (19.1%) | 48 (33.8%) |
| Fuel Oil or Kerosene | 0 (0.0%) | 0 (0.0%) |
| Coal or Coke | 0 (0.0%) | 0 (0.0%) |
| All other Fuels | 0 (0.0%) | 0 (0.0%) |
| No Fuel Used | 0 (0.0%) | 0 (0.0%) |
| Total | 366 (100.0%) | 142 (100.0%) |
Household Vehicle Usage in Dollar Point
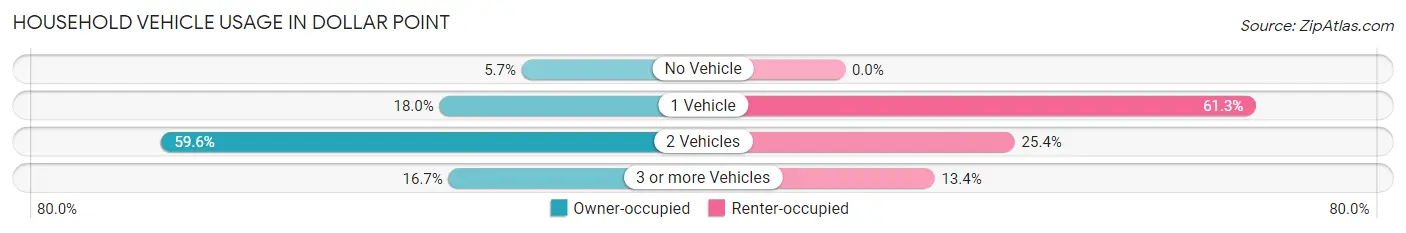
| Vehicles per Household | Owner-occupied | Renter-occupied |
| No Vehicle | 21 (5.7%) | 0 (0.0%) |
| 1 Vehicle | 66 (18.0%) | 87 (61.3%) |
| 2 Vehicles | 218 (59.6%) | 36 (25.4%) |
| 3 or more Vehicles | 61 (16.7%) | 19 (13.4%) |
| Total | 366 (100.0%) | 142 (100.0%) |
Real Estate & Mortgages in Dollar Point
Real Estate and Mortgage Overview in Dollar Point
| Characteristic | Without Mortgage | With Mortgage |
| Housing Units | 109 | 257 |
| Median Property Value | $939,200 | $890,200 |
| Median Household Income | $82,563 | $133 |
| Monthly Housing Costs | $653 | $143 |
| Real Estate Taxes | $2,265 | $20 |
Property Value by Mortgage Status in Dollar Point
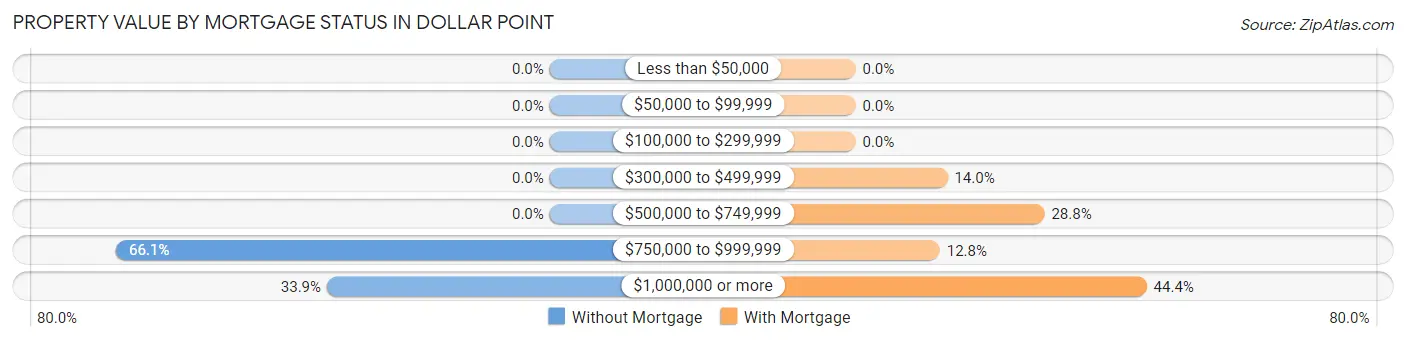
| Property Value | Without Mortgage | With Mortgage |
| Less than $50,000 | 0 (0.0%) | 0 (0.0%) |
| $50,000 to $99,999 | 0 (0.0%) | 0 (0.0%) |
| $100,000 to $299,999 | 0 (0.0%) | 0 (0.0%) |
| $300,000 to $499,999 | 0 (0.0%) | 36 (14.0%) |
| $500,000 to $749,999 | 0 (0.0%) | 74 (28.8%) |
| $750,000 to $999,999 | 72 (66.1%) | 33 (12.8%) |
| $1,000,000 or more | 37 (33.9%) | 114 (44.4%) |
| Total | 109 (100.0%) | 257 (100.0%) |
Household Income by Mortgage Status in Dollar Point
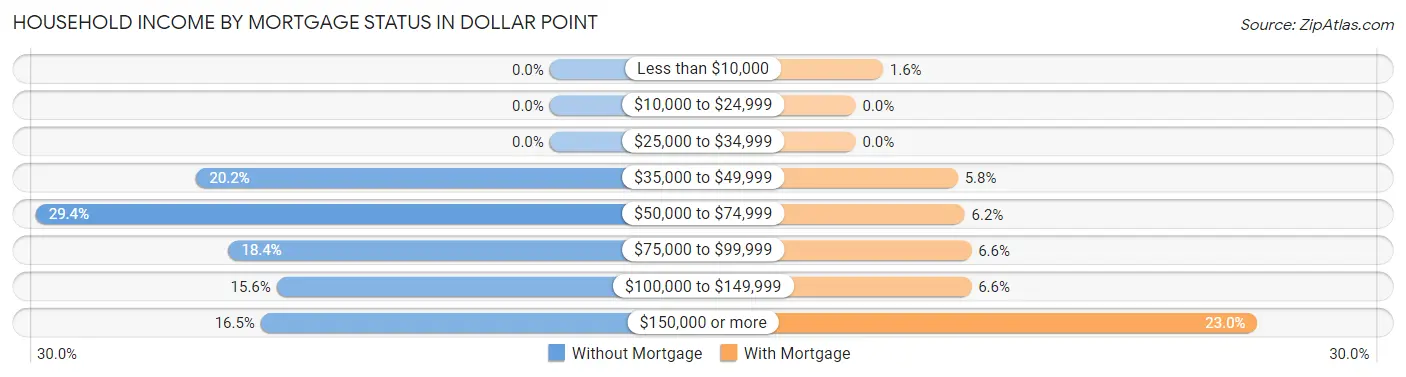
| Household Income | Without Mortgage | With Mortgage |
| Less than $10,000 | 0 (0.0%) | 4 (1.6%) |
| $10,000 to $24,999 | 0 (0.0%) | 0 (0.0%) |
| $25,000 to $34,999 | 0 (0.0%) | 0 (0.0%) |
| $35,000 to $49,999 | 22 (20.2%) | 15 (5.8%) |
| $50,000 to $74,999 | 32 (29.4%) | 16 (6.2%) |
| $75,000 to $99,999 | 20 (18.3%) | 17 (6.6%) |
| $100,000 to $149,999 | 17 (15.6%) | 17 (6.6%) |
| $150,000 or more | 18 (16.5%) | 59 (23.0%) |
| Total | 109 (100.0%) | 257 (100.0%) |
Property Value to Household Income Ratio in Dollar Point
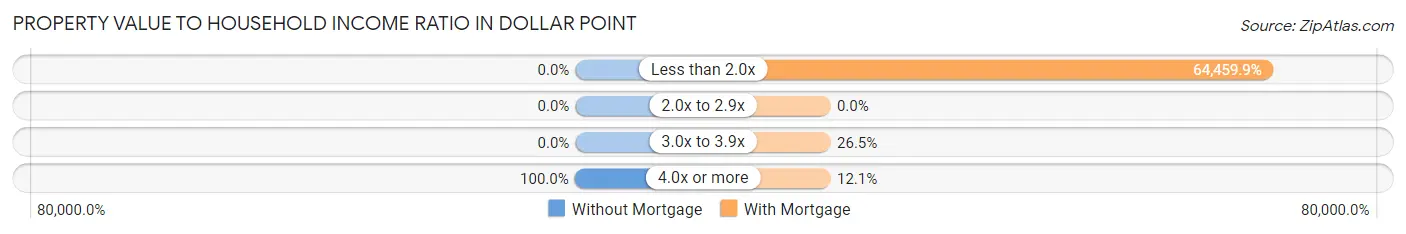
| Value-to-Income Ratio | Without Mortgage | With Mortgage |
| Less than 2.0x | 0 (0.0%) | 165,662 (64,459.9%) |
| 2.0x to 2.9x | 0 (0.0%) | 0 (0.0%) |
| 3.0x to 3.9x | 0 (0.0%) | 68 (26.5%) |
| 4.0x or more | 109 (100.0%) | 31 (12.1%) |
| Total | 109 (100.0%) | 257 (100.0%) |
Real Estate Taxes by Mortgage Status in Dollar Point
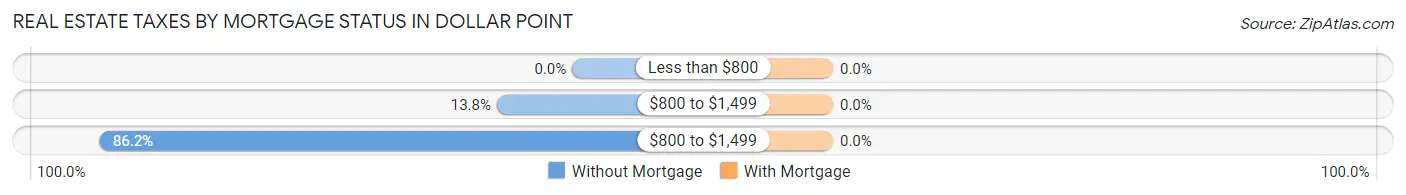
| Property Taxes | Without Mortgage | With Mortgage |
| Less than $800 | 0 (0.0%) | 0 (0.0%) |
| $800 to $1,499 | 15 (13.8%) | 0 (0.0%) |
| $800 to $1,499 | 94 (86.2%) | 0 (0.0%) |
| Total | 109 (100.0%) | 257 (100.0%) |
Health & Disability in Dollar Point
Health Insurance Coverage by Age in Dollar Point
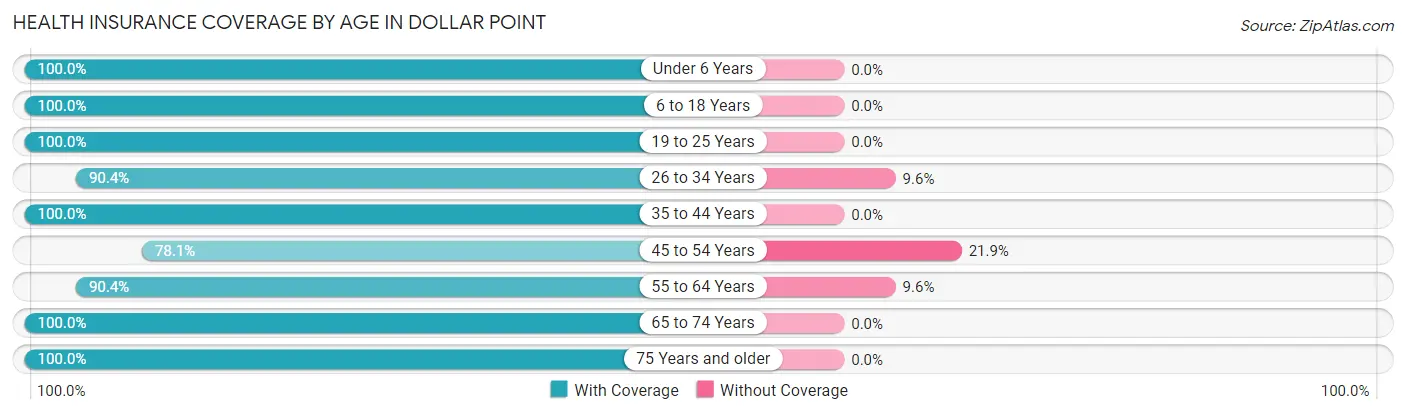
| Age Bracket | With Coverage | Without Coverage |
| Under 6 Years | 77 (100.0%) | 0 (0.0%) |
| 6 to 18 Years | 144 (100.0%) | 0 (0.0%) |
| 19 to 25 Years | 125 (100.0%) | 0 (0.0%) |
| 26 to 34 Years | 151 (90.4%) | 16 (9.6%) |
| 35 to 44 Years | 80 (100.0%) | 0 (0.0%) |
| 45 to 54 Years | 132 (78.1%) | 37 (21.9%) |
| 55 to 64 Years | 217 (90.4%) | 23 (9.6%) |
| 65 to 74 Years | 131 (100.0%) | 0 (0.0%) |
| 75 Years and older | 98 (100.0%) | 0 (0.0%) |
| Total | 1,155 (93.8%) | 76 (6.2%) |
Health Insurance Coverage by Citizenship Status in Dollar Point
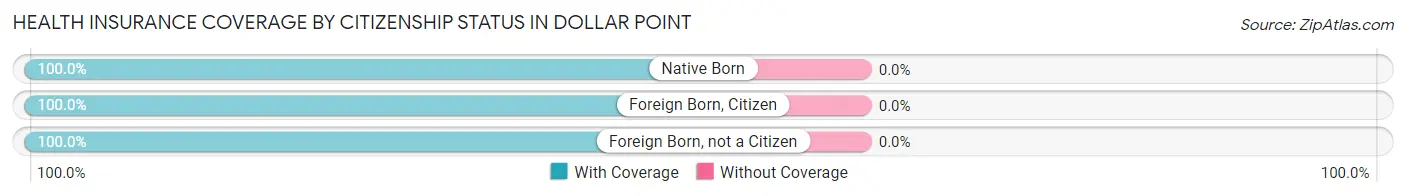
| Citizenship Status | With Coverage | Without Coverage |
| Native Born | 77 (100.0%) | 0 (0.0%) |
| Foreign Born, Citizen | 144 (100.0%) | 0 (0.0%) |
| Foreign Born, not a Citizen | 125 (100.0%) | 0 (0.0%) |
Health Insurance Coverage by Household Income in Dollar Point
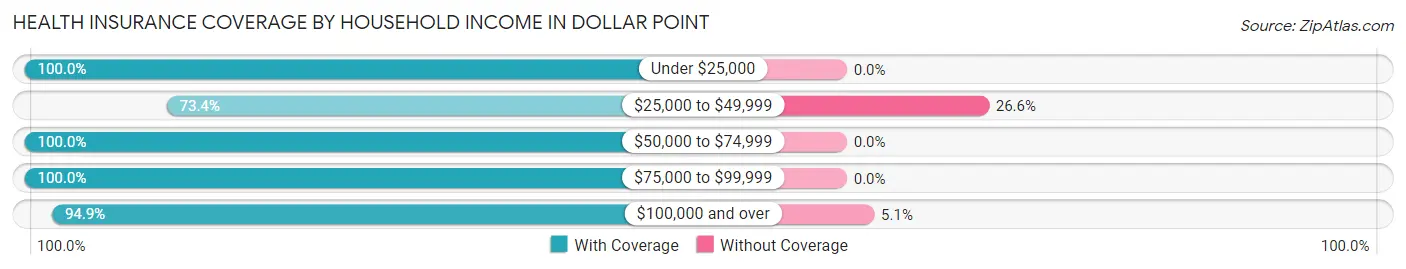
| Household Income | With Coverage | Without Coverage |
| Under $25,000 | 49 (100.0%) | 0 (0.0%) |
| $25,000 to $49,999 | 91 (73.4%) | 33 (26.6%) |
| $50,000 to $74,999 | 101 (100.0%) | 0 (0.0%) |
| $75,000 to $99,999 | 118 (100.0%) | 0 (0.0%) |
| $100,000 and over | 796 (94.9%) | 43 (5.1%) |
Public vs Private Health Insurance Coverage by Age in Dollar Point
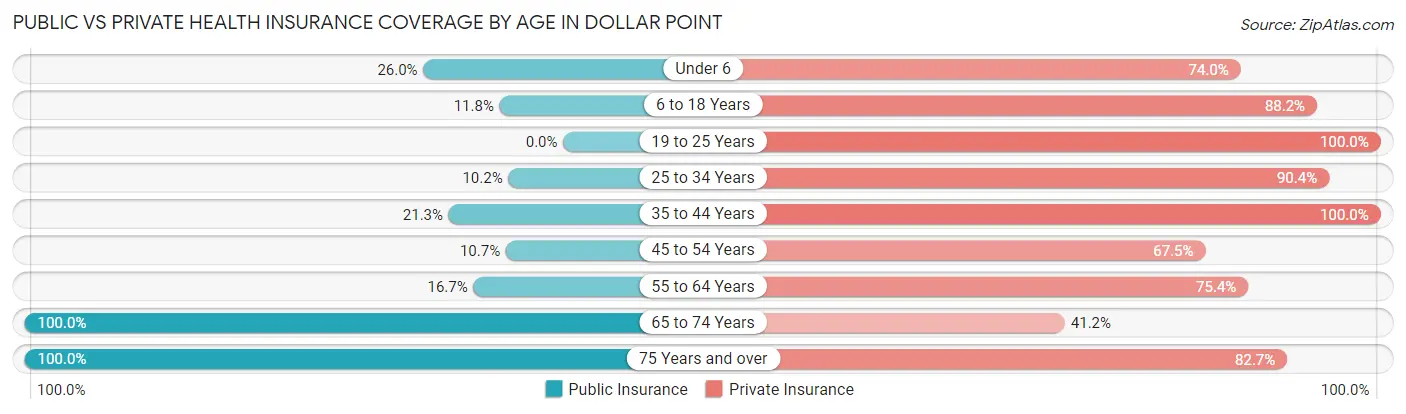
| Age Bracket | Public Insurance | Private Insurance |
| Under 6 | 20 (26.0%) | 57 (74.0%) |
| 6 to 18 Years | 17 (11.8%) | 127 (88.2%) |
| 19 to 25 Years | 0 (0.0%) | 125 (100.0%) |
| 25 to 34 Years | 17 (10.2%) | 151 (90.4%) |
| 35 to 44 Years | 17 (21.2%) | 80 (100.0%) |
| 45 to 54 Years | 18 (10.6%) | 114 (67.5%) |
| 55 to 64 Years | 40 (16.7%) | 181 (75.4%) |
| 65 to 74 Years | 131 (100.0%) | 54 (41.2%) |
| 75 Years and over | 98 (100.0%) | 81 (82.7%) |
| Total | 358 (29.1%) | 970 (78.8%) |
Disability Status by Sex by Age in Dollar Point
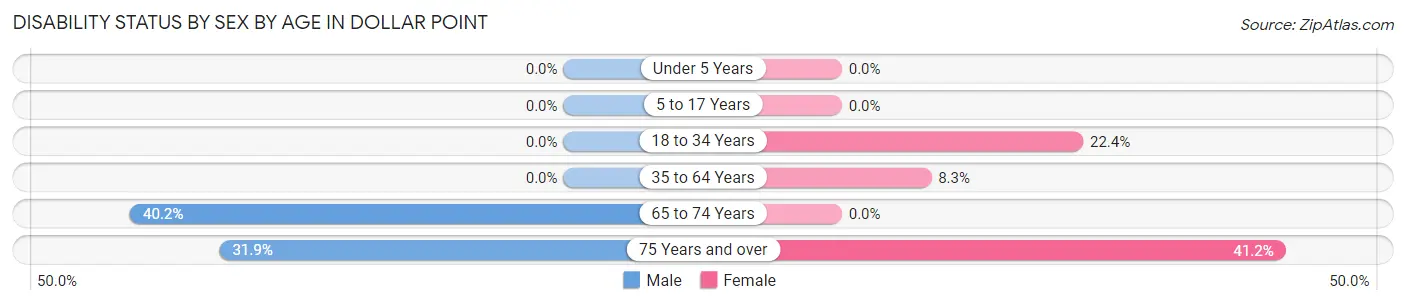
| Age Bracket | Male | Female |
| Under 5 Years | 0 (0.0%) | 0 (0.0%) |
| 5 to 17 Years | 0 (0.0%) | 0 (0.0%) |
| 18 to 34 Years | 0 (0.0%) | 45 (22.4%) |
| 35 to 64 Years | 0 (0.0%) | 22 (8.3%) |
| 65 to 74 Years | 39 (40.2%) | 0 (0.0%) |
| 75 Years and over | 15 (31.9%) | 21 (41.2%) |
Disability Class by Sex by Age in Dollar Point
Disability Class: Hearing Difficulty
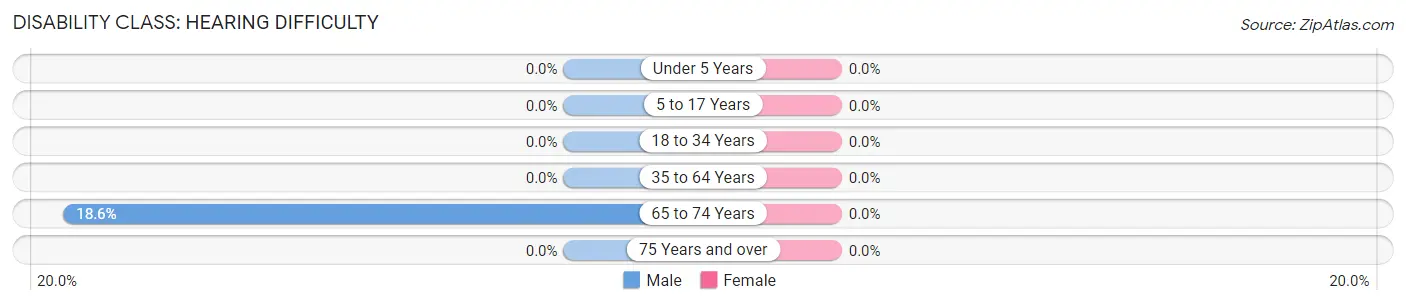
| Age Bracket | Male | Female |
| Under 5 Years | 0 (0.0%) | 0 (0.0%) |
| 5 to 17 Years | 0 (0.0%) | 0 (0.0%) |
| 18 to 34 Years | 0 (0.0%) | 0 (0.0%) |
| 35 to 64 Years | 0 (0.0%) | 0 (0.0%) |
| 65 to 74 Years | 18 (18.6%) | 0 (0.0%) |
| 75 Years and over | 0 (0.0%) | 0 (0.0%) |
Disability Class: Vision Difficulty
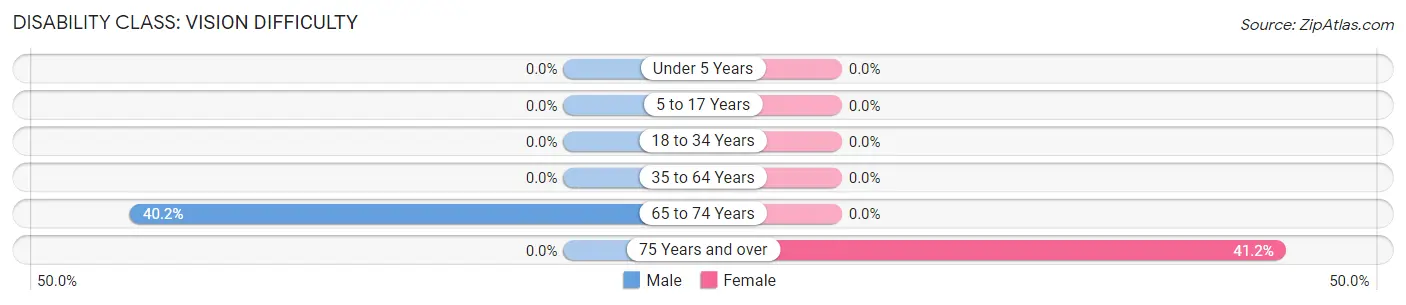
| Age Bracket | Male | Female |
| Under 5 Years | 0 (0.0%) | 0 (0.0%) |
| 5 to 17 Years | 0 (0.0%) | 0 (0.0%) |
| 18 to 34 Years | 0 (0.0%) | 0 (0.0%) |
| 35 to 64 Years | 0 (0.0%) | 0 (0.0%) |
| 65 to 74 Years | 39 (40.2%) | 0 (0.0%) |
| 75 Years and over | 0 (0.0%) | 21 (41.2%) |
Disability Class: Cognitive Difficulty
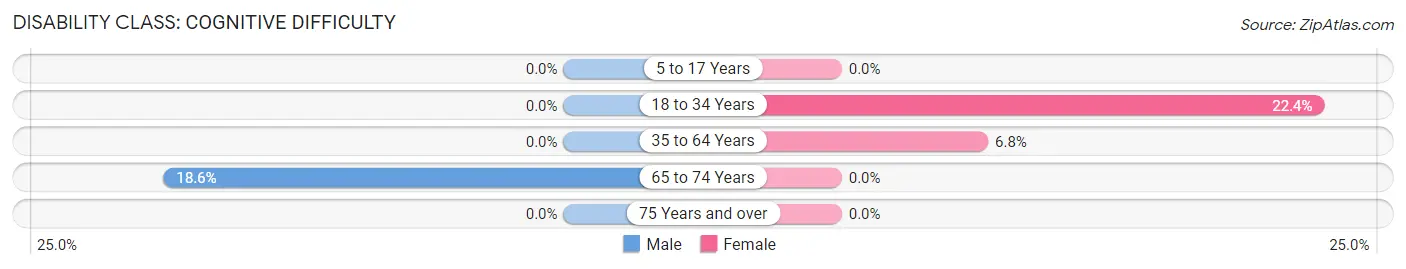
| Age Bracket | Male | Female |
| 5 to 17 Years | 0 (0.0%) | 0 (0.0%) |
| 18 to 34 Years | 0 (0.0%) | 45 (22.4%) |
| 35 to 64 Years | 0 (0.0%) | 18 (6.8%) |
| 65 to 74 Years | 18 (18.6%) | 0 (0.0%) |
| 75 Years and over | 0 (0.0%) | 0 (0.0%) |
Disability Class: Ambulatory Difficulty
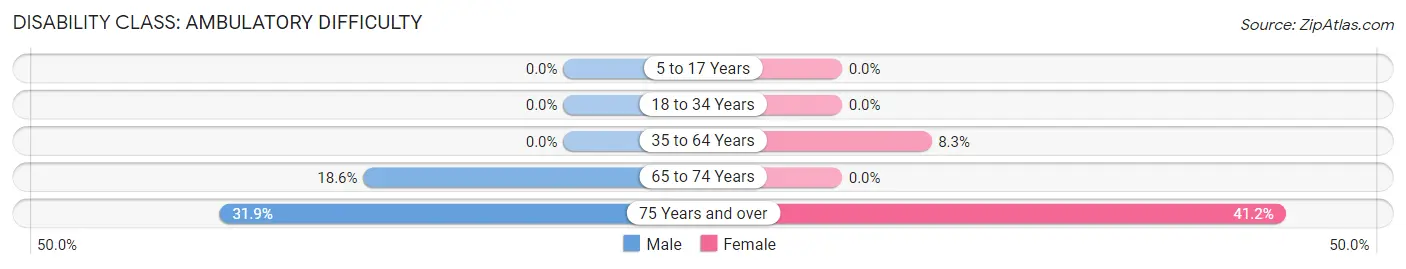
| Age Bracket | Male | Female |
| 5 to 17 Years | 0 (0.0%) | 0 (0.0%) |
| 18 to 34 Years | 0 (0.0%) | 0 (0.0%) |
| 35 to 64 Years | 0 (0.0%) | 22 (8.3%) |
| 65 to 74 Years | 18 (18.6%) | 0 (0.0%) |
| 75 Years and over | 15 (31.9%) | 21 (41.2%) |
Disability Class: Self-Care Difficulty
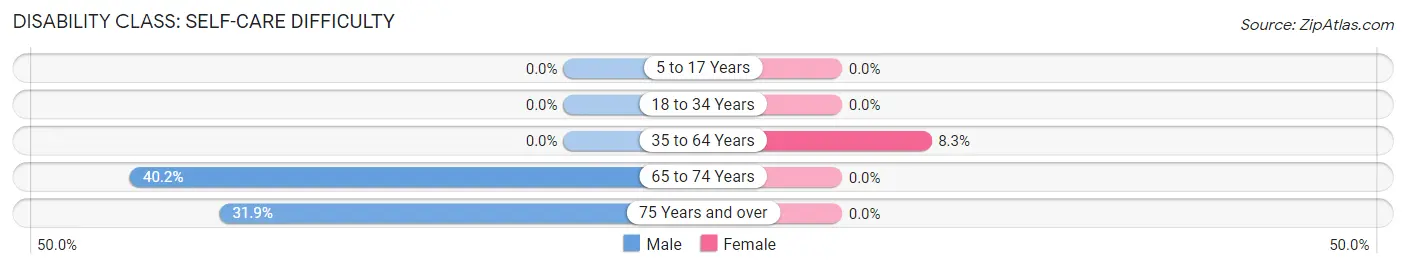
| Age Bracket | Male | Female |
| 5 to 17 Years | 0 (0.0%) | 0 (0.0%) |
| 18 to 34 Years | 0 (0.0%) | 0 (0.0%) |
| 35 to 64 Years | 0 (0.0%) | 22 (8.3%) |
| 65 to 74 Years | 39 (40.2%) | 0 (0.0%) |
| 75 Years and over | 15 (31.9%) | 0 (0.0%) |
Technology Access in Dollar Point
Computing Device Access in Dollar Point
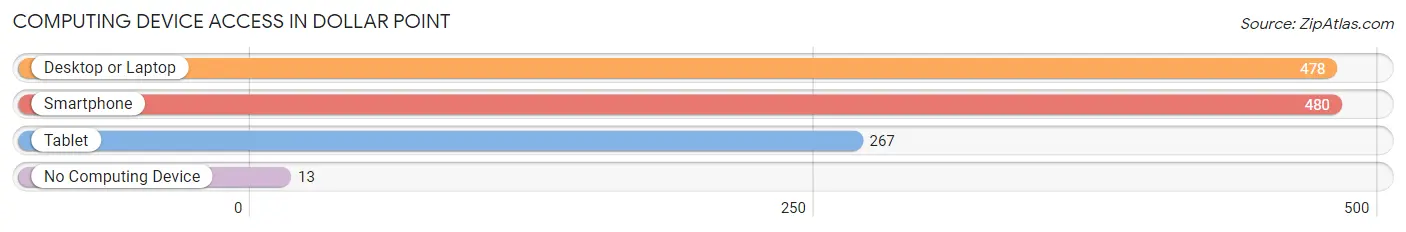
| Device Type | # Households | % Households |
| Desktop or Laptop | 478 | 94.1% |
| Smartphone | 480 | 94.5% |
| Tablet | 267 | 52.6% |
| No Computing Device | 13 | 2.6% |
| Total | 508 | 100.0% |
Internet Access in Dollar Point
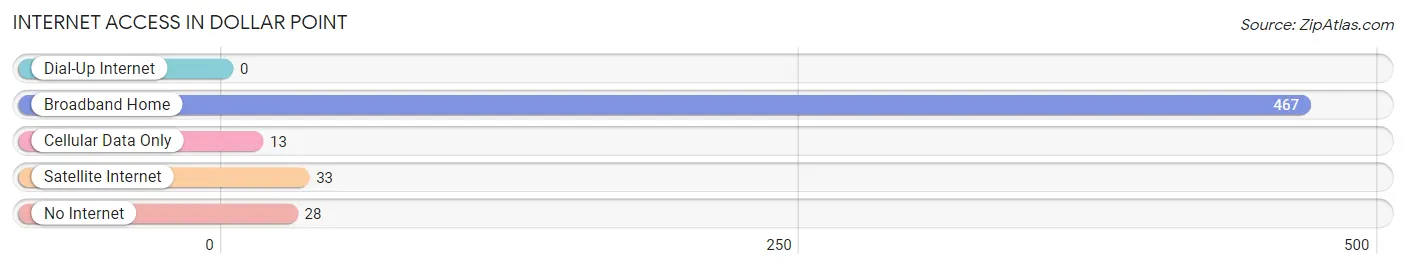
| Internet Type | # Households | % Households |
| Dial-Up Internet | 0 | 0.0% |
| Broadband Home | 467 | 91.9% |
| Cellular Data Only | 13 | 2.6% |
| Satellite Internet | 33 | 6.5% |
| No Internet | 28 | 5.5% |
| Total | 508 | 100.0% |
Dollar Point Summary
Dollar Point is a small unincorporated community located in Placer County, California, United States. It is situated on the north shore of Lake Tahoe, approximately 4 miles (6.4 km) northeast of Tahoe City. The community is named after the Dollar family, who settled in the area in the late 19th century.
History
The area now known as Dollar Point was originally inhabited by the Washoe people, who lived in the area for thousands of years before the arrival of European settlers. The first recorded European settlers in the area were the Dollar family, who arrived in the late 19th century. The family established a homestead and began to farm the land.
In the early 20th century, the area began to attract more visitors, as the popularity of Lake Tahoe as a tourist destination grew. In the 1920s, the Dollar family sold their homestead to a group of investors, who developed the area into a resort community. The area was named Dollar Point, after the family who had originally settled there.
In the 1950s, the area began to attract more permanent residents, as the popularity of Lake Tahoe as a vacation destination continued to grow. The area was eventually annexed by Placer County in the 1970s.
Geography
Dollar Point is located on the north shore of Lake Tahoe, approximately 4 miles (6.4 km) northeast of Tahoe City. The community is situated at an elevation of 6,200 feet (1,890 m). The area is surrounded by the Sierra Nevada mountain range, and is home to a variety of wildlife, including black bears, deer, and mountain lions.
Economy
The economy of Dollar Point is largely based on tourism. The area is home to a variety of resorts, hotels, and vacation rentals, as well as restaurants, bars, and other tourist-oriented businesses. The area is also home to a number of marinas, which offer boat rentals and other services.
Demographics
As of the 2010 census, the population of Dollar Point was 1,845. The racial makeup of the community was 94.3% White, 0.7% African American, 0.3% Native American, 0.7% Asian, 0.1% Pacific Islander, 1.2% from other races, and 2.1% from two or more races. Hispanic or Latino of any race were 4.2% of the population.
The median household income in Dollar Point was $68,750, and the median family income was $77,500. The per capita income for the community was $37,845. About 8.3% of families and 10.2% of the population were below the poverty line, including 14.3% of those under age 18 and 4.2% of those age 65 or over.
Common Questions
What is Per Capita Income in Dollar Point?
Per Capita income in Dollar Point is $57,701.
What is the Median Family Income in Dollar Point?
Median Family Income in Dollar Point is $124,514.
What is the Median Household income in Dollar Point?
Median Household Income in Dollar Point is $113,269.
What is Income or Wage Gap in Dollar Point?
Income or Wage Gap in Dollar Point is 26.3%.
Women in Dollar Point earn 73.7 cents for every dollar earned by a man.
What is Inequality or Gini Index in Dollar Point?
Inequality or Gini Index in Dollar Point is 0.45.
What is the Total Population of Dollar Point?
Total Population of Dollar Point is 1,233.
What is the Total Male Population of Dollar Point?
Total Male Population of Dollar Point is 543.
What is the Total Female Population of Dollar Point?
Total Female Population of Dollar Point is 690.
What is the Ratio of Males per 100 Females in Dollar Point?
There are 78.70 Males per 100 Females in Dollar Point.
What is the Ratio of Females per 100 Males in Dollar Point?
There are 127.07 Females per 100 Males in Dollar Point.
What is the Median Population Age in Dollar Point?
Median Population Age in Dollar Point is 50.0 Years.
What is the Average Family Size in Dollar Point
Average Family Size in Dollar Point is 3.3 People.
What is the Average Household Size in Dollar Point
Average Household Size in Dollar Point is 2.4 People.
How Large is the Labor Force in Dollar Point?
There are 715 People in the Labor Forcein in Dollar Point.
What is the Percentage of People in the Labor Force in Dollar Point?
68.4% of People are in the Labor Force in Dollar Point.
What is the Unemployment Rate in Dollar Point?
Unemployment Rate in Dollar Point is 2.5%.