Cities with the Highest Percentage of South American Population in Minnesota
RELATED REPORTS & OPTIONS
South American
Minnesota
Compare Cities
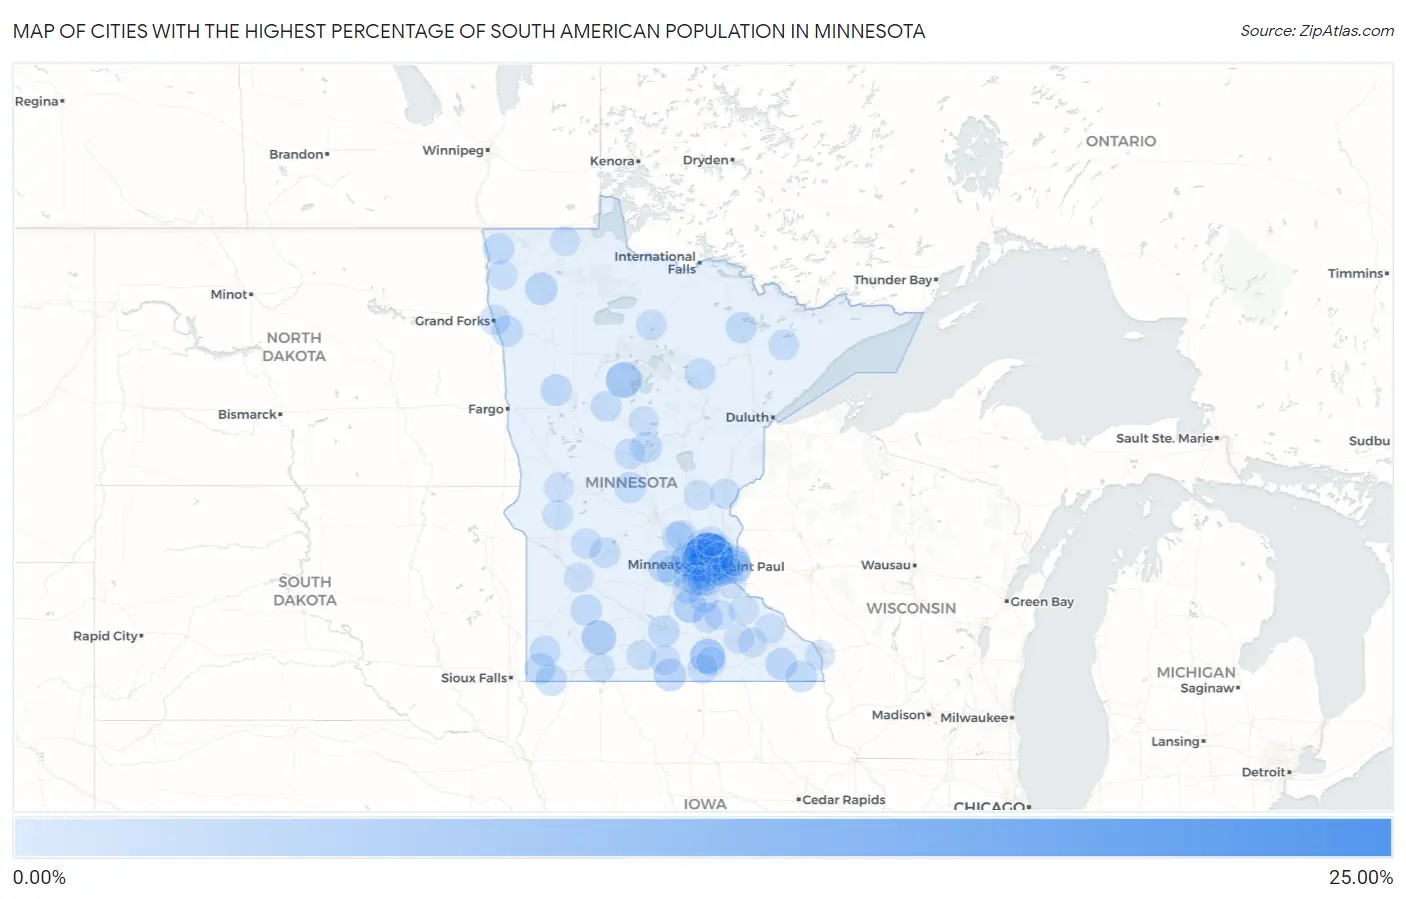
Map of Cities with the Highest Percentage of South American Population in Minnesota
0.00%
25.00%
Cities with the Highest Percentage of South American Population in Minnesota
| City | South American | vs State | vs National | |
| 1. | Hilltop | 23.78% | 0.57%(+23.2)#1 | 1.28%(+22.5)#39 |
| 2. | Laporte | 6.90% | 0.57%(+6.33)#2 | 1.28%(+5.61)#376 |
| 3. | Geneva | 6.27% | 0.57%(+5.70)#3 | 1.28%(+4.98)#440 |
| 4. | Columbia Heights | 5.82% | 0.57%(+5.25)#4 | 1.28%(+4.54)#497 |
| 5. | Jeffers | 5.56% | 0.57%(+4.98)#5 | 1.28%(+4.27)#527 |
| 6. | Fridley | 4.29% | 0.57%(+3.72)#6 | 1.28%(+3.01)#760 |
| 7. | Montgomery | 4.24% | 0.57%(+3.67)#7 | 1.28%(+2.96)#778 |
| 8. | Holt | 3.33% | 0.57%(+2.76)#8 | 1.28%(+2.05)#1,070 |
| 9. | Frost | 3.15% | 0.57%(+2.58)#9 | 1.28%(+1.86)#1,143 |
| 10. | Winsted | 3.06% | 0.57%(+2.49)#10 | 1.28%(+1.77)#1,193 |
| 11. | Lanesboro | 2.65% | 0.57%(+2.08)#11 | 1.28%(+1.37)#1,404 |
| 12. | Ogema | 2.53% | 0.57%(+1.96)#12 | 1.28%(+1.25)#1,476 |
| 13. | Hopkins | 2.25% | 0.57%(+1.68)#13 | 1.28%(+0.967)#1,672 |
| 14. | Minneapolis | 2.24% | 0.57%(+1.67)#14 | 1.28%(+0.955)#1,684 |
| 15. | Skyline | 2.22% | 0.57%(+1.65)#15 | 1.28%(+0.939)#1,699 |
| 16. | Lucan | 2.21% | 0.57%(+1.64)#16 | 1.28%(+0.927)#1,712 |
| 17. | Spring Grove | 2.20% | 0.57%(+1.63)#17 | 1.28%(+0.921)#1,716 |
| 18. | Mayer | 2.15% | 0.57%(+1.58)#18 | 1.28%(+0.871)#1,750 |
| 19. | Monticello | 2.15% | 0.57%(+1.58)#19 | 1.28%(+0.870)#1,752 |
| 20. | Fisher | 2.09% | 0.57%(+1.52)#20 | 1.28%(+0.806)#1,813 |
| 21. | Lauderdale | 2.08% | 0.57%(+1.51)#21 | 1.28%(+0.795)#1,825 |
| 22. | East Gull Lake | 2.04% | 0.57%(+1.47)#22 | 1.28%(+0.762)#1,851 |
| 23. | Ellsworth | 2.02% | 0.57%(+1.45)#23 | 1.28%(+0.741)#1,876 |
| 24. | Hallock | 2.00% | 0.57%(+1.43)#24 | 1.28%(+0.714)#1,902 |
| 25. | Cook | 1.96% | 0.57%(+1.39)#25 | 1.28%(+0.678)#1,931 |
| 26. | Arden Hills | 1.91% | 0.57%(+1.34)#26 | 1.28%(+0.624)#1,990 |
| 27. | Swanville | 1.89% | 0.57%(+1.32)#27 | 1.28%(+0.604)#2,000 |
| 28. | Bovey | 1.77% | 0.57%(+1.20)#28 | 1.28%(+0.487)#2,125 |
| 29. | Long Lake | 1.75% | 0.57%(+1.18)#29 | 1.28%(+0.469)#2,142 |
| 30. | Luverne | 1.75% | 0.57%(+1.18)#30 | 1.28%(+0.468)#2,144 |
| 31. | Burnsville | 1.62% | 0.57%(+1.05)#31 | 1.28%(+0.337)#2,298 |
| 32. | Dresbach | 1.54% | 0.57%(+0.973)#32 | 1.28%(+0.261)#2,393 |
| 33. | Edgerton | 1.51% | 0.57%(+0.942)#33 | 1.28%(+0.230)#2,430 |
| 34. | St Louis Park | 1.47% | 0.57%(+0.898)#34 | 1.28%(+0.186)#2,498 |
| 35. | Lakeland | 1.47% | 0.57%(+0.895)#35 | 1.28%(+0.183)#2,506 |
| 36. | Richfield | 1.45% | 0.57%(+0.877)#36 | 1.28%(+0.165)#2,524 |
| 37. | East Grand Forks | 1.43% | 0.57%(+0.855)#37 | 1.28%(+0.143)#2,568 |
| 38. | Mendota | 1.41% | 0.57%(+0.837)#38 | 1.28%(+0.125)#2,597 |
| 39. | Northome | 1.39% | 0.57%(+0.818)#39 | 1.28%(+0.106)#2,632 |
| 40. | Babbitt | 1.38% | 0.57%(+0.809)#40 | 1.28%(+0.097)#2,658 |
| 41. | Park Rapids | 1.35% | 0.57%(+0.774)#41 | 1.28%(+0.062)#2,705 |
| 42. | Willmar | 1.30% | 0.57%(+0.733)#42 | 1.28%(+0.021)#2,770 |
| 43. | Oak Park Heights | 1.29% | 0.57%(+0.723)#43 | 1.28%(+0.011)#2,789 |
| 44. | Motley | 1.24% | 0.57%(+0.665)#44 | 1.28%(-0.047)#2,891 |
| 45. | Spring Lake Park | 1.13% | 0.57%(+0.563)#45 | 1.28%(-0.149)#3,140 |
| 46. | Falcon Heights | 1.11% | 0.57%(+0.538)#46 | 1.28%(-0.175)#3,190 |
| 47. | Elko New Market | 1.07% | 0.57%(+0.501)#47 | 1.28%(-0.211)#3,279 |
| 48. | Loretto | 1.07% | 0.57%(+0.494)#48 | 1.28%(-0.218)#3,303 |
| 49. | Robbinsdale | 1.06% | 0.57%(+0.488)#49 | 1.28%(-0.224)#3,317 |
| 50. | Murdock | 1.05% | 0.57%(+0.482)#50 | 1.28%(-0.230)#3,332 |
| 51. | Crystal | 1.05% | 0.57%(+0.475)#51 | 1.28%(-0.238)#3,347 |
| 52. | Golden Valley | 0.99% | 0.57%(+0.423)#52 | 1.28%(-0.290)#3,460 |
| 53. | Big Lake | 0.99% | 0.57%(+0.416)#53 | 1.28%(-0.296)#3,476 |
| 54. | Brooklyn Center | 0.98% | 0.57%(+0.405)#54 | 1.28%(-0.308)#3,507 |
| 55. | Chaska | 0.95% | 0.57%(+0.380)#55 | 1.28%(-0.332)#3,596 |
| 56. | Delavan | 0.94% | 0.57%(+0.372)#56 | 1.28%(-0.340)#3,620 |
| 57. | Minnetonka | 0.93% | 0.57%(+0.361)#57 | 1.28%(-0.351)#3,651 |
| 58. | Nerstrand | 0.92% | 0.57%(+0.351)#58 | 1.28%(-0.361)#3,680 |
| 59. | Anoka | 0.92% | 0.57%(+0.346)#59 | 1.28%(-0.367)#3,702 |
| 60. | Sunfish Lake | 0.90% | 0.57%(+0.333)#60 | 1.28%(-0.379)#3,738 |
| 61. | Maple Plain | 0.90% | 0.57%(+0.328)#61 | 1.28%(-0.384)#3,756 |
| 62. | Morris | 0.88% | 0.57%(+0.312)#62 | 1.28%(-0.400)#3,806 |
| 63. | Eden Prairie | 0.87% | 0.57%(+0.295)#63 | 1.28%(-0.417)#3,847 |
| 64. | St Marys Point | 0.86% | 0.57%(+0.285)#64 | 1.28%(-0.427)#3,867 |
| 65. | Faribault | 0.81% | 0.57%(+0.240)#65 | 1.28%(-0.472)#4,001 |
| 66. | Albert Lea | 0.80% | 0.57%(+0.232)#66 | 1.28%(-0.480)#4,023 |
| 67. | Bloomington | 0.80% | 0.57%(+0.229)#67 | 1.28%(-0.483)#4,039 |
| 68. | Maplewood | 0.80% | 0.57%(+0.226)#68 | 1.28%(-0.486)#4,055 |
| 69. | Brooklyn Park | 0.79% | 0.57%(+0.224)#69 | 1.28%(-0.489)#4,069 |
| 70. | Maple Grove | 0.74% | 0.57%(+0.169)#70 | 1.28%(-0.543)#4,265 |
| 71. | Truman | 0.74% | 0.57%(+0.169)#71 | 1.28%(-0.543)#4,267 |
| 72. | Ogilvie | 0.73% | 0.57%(+0.159)#72 | 1.28%(-0.553)#4,301 |
| 73. | Plymouth | 0.72% | 0.57%(+0.151)#73 | 1.28%(-0.561)#4,330 |
| 74. | Plainview | 0.72% | 0.57%(+0.148)#74 | 1.28%(-0.564)#4,340 |
| 75. | Pine City | 0.72% | 0.57%(+0.147)#75 | 1.28%(-0.566)#4,344 |
| 76. | Pine River | 0.71% | 0.57%(+0.139)#76 | 1.28%(-0.573)#4,377 |
| 77. | White Bear Lake | 0.70% | 0.57%(+0.132)#77 | 1.28%(-0.580)#4,412 |
| 78. | Kasson | 0.67% | 0.57%(+0.100)#78 | 1.28%(-0.612)#4,544 |
| 79. | Roseville | 0.67% | 0.57%(+0.100)#79 | 1.28%(-0.612)#4,545 |
| 80. | Lino Lakes | 0.66% | 0.57%(+0.093)#80 | 1.28%(-0.619)#4,567 |
| 81. | Rochester | 0.66% | 0.57%(+0.091)#81 | 1.28%(-0.621)#4,575 |
| 82. | Roseau | 0.66% | 0.57%(+0.088)#82 | 1.28%(-0.624)#4,590 |
| 83. | Goodhue | 0.65% | 0.57%(+0.079)#83 | 1.28%(-0.633)#4,622 |
| 84. | Osseo | 0.65% | 0.57%(+0.074)#84 | 1.28%(-0.638)#4,638 |
| 85. | La Crescent | 0.64% | 0.57%(+0.064)#85 | 1.28%(-0.648)#4,685 |
| 86. | Vadnais Heights | 0.60% | 0.57%(+0.028)#86 | 1.28%(-0.685)#4,830 |
| 87. | Hastings | 0.60% | 0.57%(+0.027)#87 | 1.28%(-0.685)#4,833 |
| 88. | Hollandale | 0.59% | 0.57%(+0.021)#88 | 1.28%(-0.691)#4,853 |
| 89. | Blaine | 0.59% | 0.57%(+0.019)#89 | 1.28%(-0.694)#4,861 |
| 90. | Jordan | 0.59% | 0.57%(+0.016)#90 | 1.28%(-0.696)#4,874 |
| 91. | Savage | 0.58% | 0.57%(+0.012)#91 | 1.28%(-0.701)#4,895 |
| 92. | Granite Falls | 0.58% | 0.57%(+0.007)#92 | 1.28%(-0.705)#4,917 |
| 93. | Barrett | 0.57% | 0.57%(-0.003)#93 | 1.28%(-0.715)#4,970 |
| 94. | Woodbury | 0.57% | 0.57%(-0.006)#94 | 1.28%(-0.718)#4,984 |
| 95. | South St Paul | 0.56% | 0.57%(-0.013)#95 | 1.28%(-0.725)#5,016 |
| 96. | Lakefield | 0.55% | 0.57%(-0.018)#96 | 1.28%(-0.730)#5,035 |
| 97. | Shakopee | 0.55% | 0.57%(-0.025)#97 | 1.28%(-0.737)#5,058 |
| 98. | Stephen | 0.54% | 0.57%(-0.028)#98 | 1.28%(-0.740)#5,072 |
| 99. | Ham Lake | 0.54% | 0.57%(-0.031)#99 | 1.28%(-0.743)#5,096 |
| 100. | Bayport | 0.54% | 0.57%(-0.033)#100 | 1.28%(-0.745)#5,103 |
Common Questions
What are the Top 10 Cities with the Highest Percentage of South American Population in Minnesota?
Top 10 Cities with the Highest Percentage of South American Population in Minnesota are:
#1
23.78%
#2
6.90%
#3
6.27%
#4
5.82%
#5
5.56%
#6
4.29%
#7
4.24%
#8
3.33%
#9
3.15%
#10
3.06%
What city has the Highest Percentage of South American Population in Minnesota?
Hilltop has the Highest Percentage of South American Population in Minnesota with 23.78%.
What is the Percentage of South American Population in the State of Minnesota?
Percentage of South American Population in Minnesota is 0.57%.
What is the Percentage of South American Population in the United States?
Percentage of South American Population in the United States is 1.28%.