Cities with the Highest Percentage of South American Population in Connecticut
RELATED REPORTS & OPTIONS
South American
Connecticut
Compare Cities
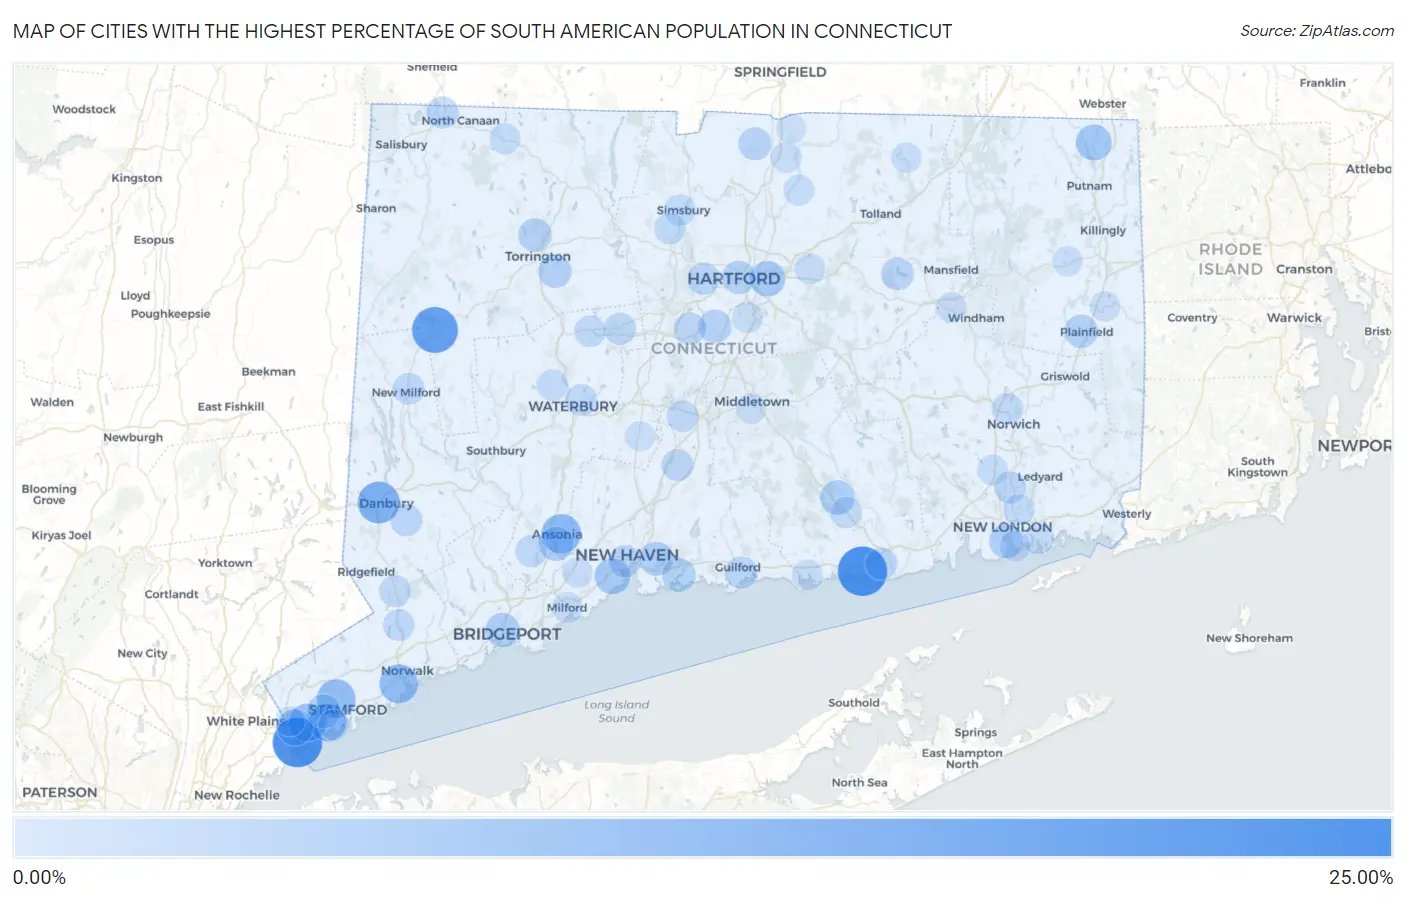
Map of Cities with the Highest Percentage of South American Population in Connecticut
0.00%
25.00%
Cities with the Highest Percentage of South American Population in Connecticut
| City | South American | vs State | vs National | |
| 1. | Byram | 21.10% | 3.05%(+18.1)#1 | 1.28%(+19.8)#54 |
| 2. | Saybrook Manor | 21.04% | 3.05%(+18.0)#2 | 1.28%(+19.8)#55 |
| 3. | New Preston | 17.15% | 3.05%(+14.1)#3 | 1.28%(+15.9)#73 |
| 4. | Greens Farms | 14.03% | 3.05%(+11.0)#4 | 1.28%(+12.7)#117 |
| 5. | Danbury | 12.90% | 3.05%(+9.86)#5 | 1.28%(+11.6)#140 |
| 6. | Danielson Borough | 11.15% | 3.05%(+8.10)#6 | 1.28%(+9.87)#173 |
| 7. | Botsford | 10.33% | 3.05%(+7.29)#7 | 1.28%(+9.05)#198 |
| 8. | Ansonia | 10.24% | 3.05%(+7.20)#8 | 1.28%(+8.96)#201 |
| 9. | Route 7 Gateway | 10.01% | 3.05%(+6.96)#9 | 1.28%(+8.73)#212 |
| 10. | Norwalk | 9.59% | 3.05%(+6.55)#10 | 1.28%(+8.31)#224 |
| 11. | Stamford | 9.50% | 3.05%(+6.45)#11 | 1.28%(+8.22)#229 |
| 12. | Greenwich | 8.74% | 3.05%(+5.69)#12 | 1.28%(+7.46)#261 |
| 13. | Riverside | 8.47% | 3.05%(+5.42)#13 | 1.28%(+7.18)#273 |
| 14. | Pemberwick | 7.19% | 3.05%(+4.15)#14 | 1.28%(+5.91)#355 |
| 15. | North Grosvenor Dale | 6.79% | 3.05%(+3.75)#15 | 1.28%(+5.51)#390 |
| 16. | West Haven | 6.70% | 3.05%(+3.65)#16 | 1.28%(+5.41)#398 |
| 17. | Poplar Plains | 6.64% | 3.05%(+3.59)#17 | 1.28%(+5.36)#404 |
| 18. | Ball Pond | 6.36% | 3.05%(+3.32)#18 | 1.28%(+5.08)#430 |
| 19. | East Hartford | 6.20% | 3.05%(+3.16)#19 | 1.28%(+4.92)#447 |
| 20. | Lakes East | 5.35% | 3.05%(+2.31)#20 | 1.28%(+4.07)#557 |
| 21. | Derby | 5.35% | 3.05%(+2.31)#21 | 1.28%(+4.07)#559 |
| 22. | Chester Center | 5.26% | 3.05%(+2.22)#22 | 1.28%(+3.98)#566 |
| 23. | Bridgeport | 5.08% | 3.05%(+2.04)#23 | 1.28%(+3.80)#593 |
| 24. | New London | 4.89% | 3.05%(+1.85)#24 | 1.28%(+3.61)#624 |
| 25. | East Haven | 4.70% | 3.05%(+1.66)#25 | 1.28%(+3.42)#669 |
| 26. | Cos Cob | 4.51% | 3.05%(+1.47)#26 | 1.28%(+3.23)#704 |
| 27. | Branford Center | 4.50% | 3.05%(+1.45)#27 | 1.28%(+3.22)#709 |
| 28. | Taylor Corners | 4.24% | 3.05%(+1.20)#28 | 1.28%(+2.96)#776 |
| 29. | Bridgewater | 4.23% | 3.05%(+1.18)#29 | 1.28%(+2.94)#787 |
| 30. | Plainfield Village | 4.14% | 3.05%(+1.10)#30 | 1.28%(+2.86)#815 |
| 31. | Torrington | 4.12% | 3.05%(+1.07)#31 | 1.28%(+2.83)#818 |
| 32. | Noroton | 4.10% | 3.05%(+1.06)#32 | 1.28%(+2.82)#821 |
| 33. | Northwest Harwinton | 4.06% | 3.05%(+1.01)#33 | 1.28%(+2.78)#836 |
| 34. | Hartford | 4.03% | 3.05%(+0.984)#34 | 1.28%(+2.75)#842 |
| 35. | Newington | 3.91% | 3.05%(+0.869)#35 | 1.28%(+2.63)#874 |
| 36. | Staples | 3.76% | 3.05%(+0.719)#36 | 1.28%(+2.48)#918 |
| 37. | Suffield Depot | 3.71% | 3.05%(+0.667)#37 | 1.28%(+2.43)#939 |
| 38. | Coventry Lake | 3.41% | 3.05%(+0.363)#38 | 1.28%(+2.12)#1,041 |
| 39. | Old Hill | 3.26% | 3.05%(+0.211)#39 | 1.28%(+1.97)#1,092 |
| 40. | New Haven | 3.16% | 3.05%(+0.113)#40 | 1.28%(+1.88)#1,138 |
| 41. | New Britain | 3.16% | 3.05%(+0.111)#41 | 1.28%(+1.87)#1,140 |
| 42. | Candlewood Orchards | 3.05% | 3.05%(+0.008)#42 | 1.28%(+1.77)#1,197 |
| 43. | West Hartford | 3.05% | 3.05%(+0.005)#43 | 1.28%(+1.77)#1,198 |
| 44. | Bethel | 2.99% | 3.05%(-0.058)#44 | 1.28%(+1.70)#1,226 |
| 45. | Canaan | 2.96% | 3.05%(-0.089)#45 | 1.28%(+1.67)#1,240 |
| 46. | Guilford Center | 2.95% | 3.05%(-0.093)#46 | 1.28%(+1.67)#1,242 |
| 47. | Gales Ferry | 2.88% | 3.05%(-0.170)#47 | 1.28%(+1.59)#1,286 |
| 48. | Naugatuck Borough | 2.80% | 3.05%(-0.246)#48 | 1.28%(+1.52)#1,326 |
| 49. | Wallingford Center | 2.76% | 3.05%(-0.286)#49 | 1.28%(+1.48)#1,357 |
| 50. | Bristol | 2.75% | 3.05%(-0.295)#50 | 1.28%(+1.47)#1,361 |
| 51. | Old Saybrook Center | 2.73% | 3.05%(-0.318)#51 | 1.28%(+1.44)#1,372 |
| 52. | Darien Downtown | 2.72% | 3.05%(-0.326)#52 | 1.28%(+1.44)#1,379 |
| 53. | New Milford | 2.62% | 3.05%(-0.423)#53 | 1.28%(+1.34)#1,419 |
| 54. | Shelton | 2.62% | 3.05%(-0.429)#54 | 1.28%(+1.33)#1,424 |
| 55. | Waterbury | 2.51% | 3.05%(-0.536)#55 | 1.28%(+1.23)#1,489 |
| 56. | Meriden | 2.46% | 3.05%(-0.583)#56 | 1.28%(+1.18)#1,520 |
| 57. | Georgetown | 2.42% | 3.05%(-0.630)#57 | 1.28%(+1.13)#1,554 |
| 58. | Wilton Center | 2.38% | 3.05%(-0.670)#58 | 1.28%(+1.09)#1,592 |
| 59. | Terryville | 2.34% | 3.05%(-0.704)#59 | 1.28%(+1.06)#1,616 |
| 60. | Norwich | 2.26% | 3.05%(-0.781)#60 | 1.28%(+0.981)#1,660 |
| 61. | Bigelow Corners | 2.24% | 3.05%(-0.801)#61 | 1.28%(+0.960)#1,679 |
| 62. | Saugatuck | 2.23% | 3.05%(-0.811)#62 | 1.28%(+0.951)#1,687 |
| 63. | Deep River Center | 2.19% | 3.05%(-0.860)#63 | 1.28%(+0.902)#1,731 |
| 64. | Oakville | 2.17% | 3.05%(-0.872)#64 | 1.28%(+0.890)#1,735 |
| 65. | Weatogue | 2.17% | 3.05%(-0.874)#65 | 1.28%(+0.888)#1,737 |
| 66. | Simsbury Center | 2.11% | 3.05%(-0.934)#66 | 1.28%(+0.828)#1,794 |
| 67. | Trumbull Center | 2.10% | 3.05%(-0.945)#67 | 1.28%(+0.817)#1,803 |
| 68. | Newtown Borough | 2.04% | 3.05%(-1.00)#68 | 1.28%(+0.759)#1,853 |
| 69. | Conning Towers Nautilus Park | 1.87% | 3.05%(-1.17)#69 | 1.28%(+0.590)#2,013 |
| 70. | Candlewood Isle | 1.71% | 3.05%(-1.33)#70 | 1.28%(+0.430)#2,186 |
| 71. | Norfolk | 1.69% | 3.05%(-1.36)#71 | 1.28%(+0.404)#2,217 |
| 72. | Broad Brook | 1.65% | 3.05%(-1.40)#72 | 1.28%(+0.364)#2,259 |
| 73. | Clinton | 1.64% | 3.05%(-1.41)#73 | 1.28%(+0.355)#2,272 |
| 74. | Mill Plain | 1.63% | 3.05%(-1.42)#74 | 1.28%(+0.346)#2,285 |
| 75. | Wethersfield | 1.59% | 3.05%(-1.46)#75 | 1.28%(+0.302)#2,342 |
| 76. | Southwood Acres | 1.58% | 3.05%(-1.47)#76 | 1.28%(+0.294)#2,350 |
| 77. | Quinnipiac University | 1.56% | 3.05%(-1.48)#77 | 1.28%(+0.280)#2,370 |
| 78. | Oxoboxo River | 1.52% | 3.05%(-1.52)#78 | 1.28%(+0.240)#2,417 |
| 79. | Manchester | 1.51% | 3.05%(-1.53)#79 | 1.28%(+0.227)#2,434 |
| 80. | Milford City Balance | 1.50% | 3.05%(-1.55)#80 | 1.28%(+0.213)#2,458 |
| 81. | Old Greenwich | 1.37% | 3.05%(-1.67)#81 | 1.28%(+0.091)#2,666 |
| 82. | Poquonock Bridge | 1.37% | 3.05%(-1.68)#82 | 1.28%(+0.084)#2,670 |
| 83. | Groton | 1.31% | 3.05%(-1.73)#83 | 1.28%(+0.030)#2,756 |
| 84. | Moosup | 1.29% | 3.05%(-1.75)#84 | 1.28%(+0.008)#2,796 |
| 85. | Willimantic | 1.19% | 3.05%(-1.85)#85 | 1.28%(-0.090)#3,000 |
| 86. | Orange | 1.17% | 3.05%(-1.87)#86 | 1.28%(-0.110)#3,048 |
| 87. | Middletown | 1.10% | 3.05%(-1.94)#87 | 1.28%(-0.182)#3,208 |
| 88. | Noroton Heights | 1.10% | 3.05%(-1.95)#88 | 1.28%(-0.185)#3,219 |
| 89. | Brooklyn | 1.02% | 3.05%(-2.03)#89 | 1.28%(-0.267)#3,415 |
| 90. | East | 1.00% | 3.05%(-2.04)#90 | 1.28%(-0.281)#3,441 |
| 91. | Stafford Springs | 1.00% | 3.05%(-2.04)#91 | 1.28%(-0.281)#3,444 |
| 92. | Oronoque | 0.96% | 3.05%(-2.09)#92 | 1.28%(-0.324)#3,577 |
| 93. | Coleytown | 0.94% | 3.05%(-2.10)#93 | 1.28%(-0.339)#3,619 |
| 94. | Westport | 0.94% | 3.05%(-2.11)#94 | 1.28%(-0.346)#3,637 |
| 95. | Cheshire Village | 0.92% | 3.05%(-2.13)#95 | 1.28%(-0.365)#3,693 |
| 96. | Lordship | 0.88% | 3.05%(-2.16)#96 | 1.28%(-0.400)#3,808 |
| 97. | Bantam Borough | 0.86% | 3.05%(-2.18)#97 | 1.28%(-0.422)#3,853 |
| 98. | Sherwood Manor | 0.84% | 3.05%(-2.21)#98 | 1.28%(-0.446)#3,919 |
| 99. | Glenville | 0.84% | 3.05%(-2.21)#99 | 1.28%(-0.448)#3,927 |
| 100. | New Canaan | 0.82% | 3.05%(-2.23)#100 | 1.28%(-0.467)#3,985 |
1
2Common Questions
What are the Top 10 Cities with the Highest Percentage of South American Population in Connecticut?
Top 10 Cities with the Highest Percentage of South American Population in Connecticut are:
#1
21.10%
#2
21.04%
#3
17.15%
#4
12.90%
#5
10.24%
#6
9.59%
#7
9.50%
#8
8.74%
#9
8.47%
#10
7.19%
What city has the Highest Percentage of South American Population in Connecticut?
Byram has the Highest Percentage of South American Population in Connecticut with 21.10%.
What is the Percentage of South American Population in the State of Connecticut?
Percentage of South American Population in Connecticut is 3.05%.
What is the Percentage of South American Population in the United States?
Percentage of South American Population in the United States is 1.28%.