Cities with the Highest Percentage of South American Population in Missouri
RELATED REPORTS & OPTIONS
South American
Missouri
Compare Cities
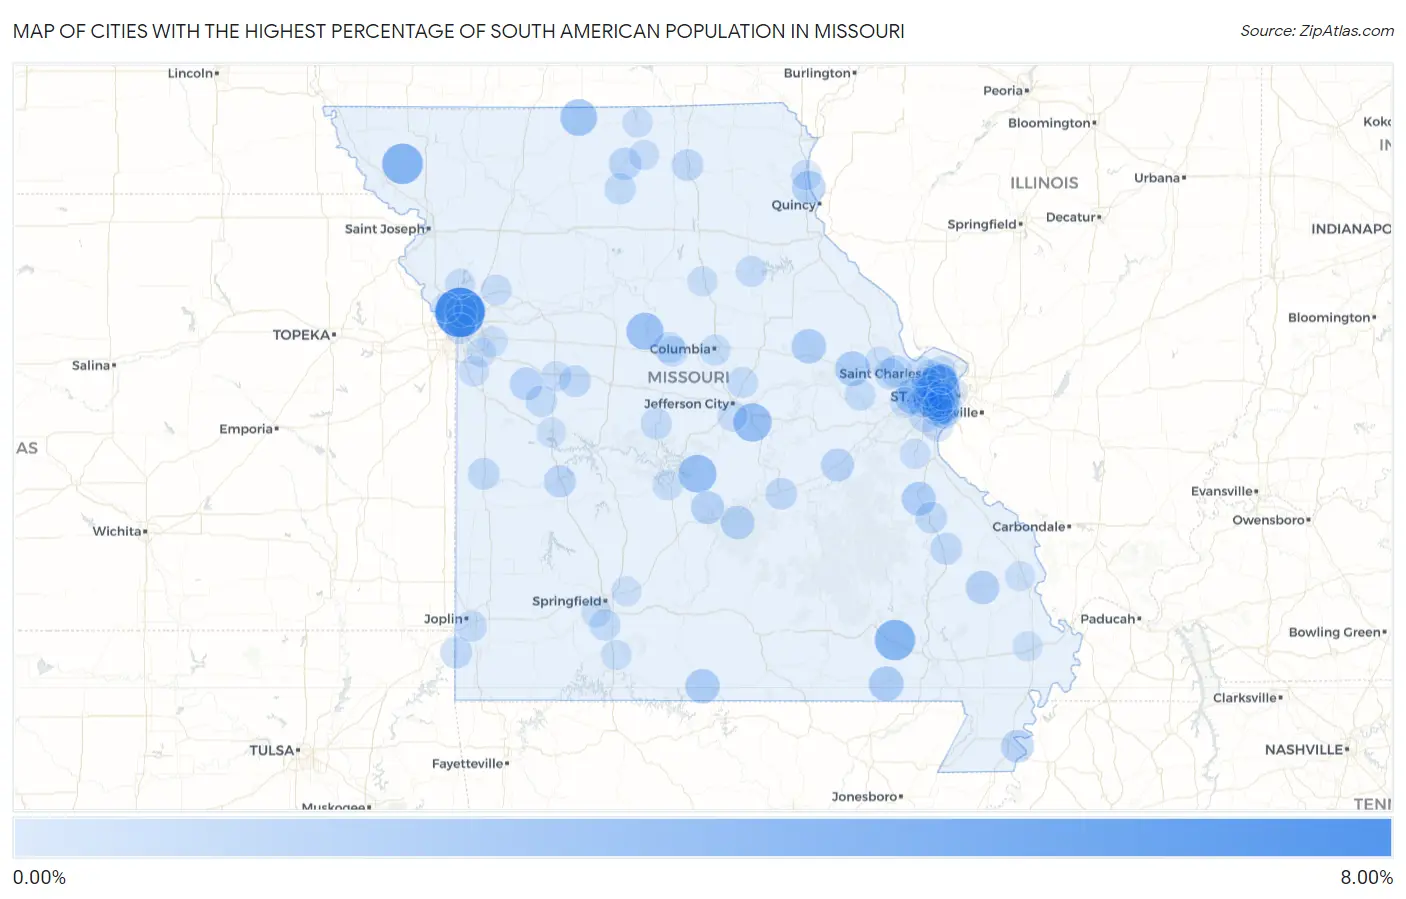
Map of Cities with the Highest Percentage of South American Population in Missouri
0.00%
8.00%
Cities with the Highest Percentage of South American Population in Missouri
| City | South American | vs State | vs National | |
| 1. | Oaks | 7.65% | 0.24%(+7.41)#1 | 1.28%(+6.37)#325 |
| 2. | Overland | 4.21% | 0.24%(+3.97)#2 | 1.28%(+2.93)#792 |
| 3. | Maitland | 4.15% | 0.24%(+3.91)#3 | 1.28%(+2.87)#811 |
| 4. | Ellsinore | 4.07% | 0.24%(+3.83)#4 | 1.28%(+2.79)#830 |
| 5. | Westphalia | 3.25% | 0.24%(+3.01)#5 | 1.28%(+1.96)#1,103 |
| 6. | Brumley | 3.12% | 0.24%(+2.89)#6 | 1.28%(+1.84)#1,153 |
| 7. | Arrow Rock | 2.78% | 0.24%(+2.54)#7 | 1.28%(+1.49)#1,343 |
| 8. | Mercer | 2.63% | 0.24%(+2.39)#8 | 1.28%(+1.35)#1,415 |
| 9. | Westwood | 2.59% | 0.24%(+2.35)#9 | 1.28%(+1.31)#1,443 |
| 10. | Woodson Terrace | 2.36% | 0.24%(+2.12)#10 | 1.28%(+1.08)#1,604 |
| 11. | Clarkson Valley | 2.07% | 0.24%(+1.83)#11 | 1.28%(+0.787)#1,835 |
| 12. | Doniphan | 1.96% | 0.24%(+1.73)#12 | 1.28%(+0.681)#1,930 |
| 13. | Truesdale | 1.94% | 0.24%(+1.71)#13 | 1.28%(+0.661)#1,949 |
| 14. | Marlborough | 1.93% | 0.24%(+1.69)#14 | 1.28%(+0.643)#1,970 |
| 15. | Montgomery City | 1.85% | 0.24%(+1.61)#15 | 1.28%(+0.563)#2,049 |
| 16. | Gainesville | 1.80% | 0.24%(+1.56)#16 | 1.28%(+0.513)#2,098 |
| 17. | Bonne Terre | 1.66% | 0.24%(+1.42)#17 | 1.28%(+0.378)#2,243 |
| 18. | Fort Leonard Wood | 1.50% | 0.24%(+1.27)#18 | 1.28%(+0.222)#2,440 |
| 19. | Marble Hill | 1.46% | 0.24%(+1.22)#19 | 1.28%(+0.173)#2,515 |
| 20. | La Grange | 1.44% | 0.24%(+1.20)#20 | 1.28%(+0.157)#2,536 |
| 21. | Richland | 1.30% | 0.24%(+1.06)#21 | 1.28%(+0.017)#2,780 |
| 22. | Affton | 1.29% | 0.24%(+1.05)#22 | 1.28%(+0.007)#2,800 |
| 23. | Bourbon | 1.25% | 0.24%(+1.01)#23 | 1.28%(-0.032)#2,873 |
| 24. | Caruthersville | 1.20% | 0.24%(+0.961)#24 | 1.28%(-0.084)#2,989 |
| 25. | Holden | 1.20% | 0.24%(+0.958)#25 | 1.28%(-0.087)#2,998 |
| 26. | Country Life Acres | 1.08% | 0.24%(+0.837)#26 | 1.28%(-0.208)#3,275 |
| 27. | Milan | 1.06% | 0.24%(+0.818)#27 | 1.28%(-0.227)#3,320 |
| 28. | Gladstone | 1.00% | 0.24%(+0.763)#28 | 1.28%(-0.282)#3,445 |
| 29. | Osceola | 0.93% | 0.24%(+0.696)#29 | 1.28%(-0.349)#3,648 |
| 30. | Fredericktown | 0.90% | 0.24%(+0.663)#30 | 1.28%(-0.382)#3,745 |
| 31. | Seneca | 0.90% | 0.24%(+0.660)#31 | 1.28%(-0.385)#3,763 |
| 32. | Kirksville | 0.86% | 0.24%(+0.618)#32 | 1.28%(-0.428)#3,870 |
| 33. | O Fallon | 0.85% | 0.24%(+0.613)#33 | 1.28%(-0.433)#3,885 |
| 34. | Rock Hill | 0.85% | 0.24%(+0.608)#34 | 1.28%(-0.437)#3,893 |
| 35. | Rolla | 0.81% | 0.24%(+0.576)#35 | 1.28%(-0.469)#3,993 |
| 36. | Murphy | 0.81% | 0.24%(+0.569)#36 | 1.28%(-0.476)#4,013 |
| 37. | Whiteman Afb | 0.80% | 0.24%(+0.563)#37 | 1.28%(-0.482)#4,034 |
| 38. | Farmington | 0.80% | 0.24%(+0.557)#38 | 1.28%(-0.488)#4,065 |
| 39. | Rich Hill | 0.79% | 0.24%(+0.557)#39 | 1.28%(-0.488)#4,068 |
| 40. | Chilhowee | 0.75% | 0.24%(+0.511)#40 | 1.28%(-0.534)#4,231 |
| 41. | North Kansas City | 0.75% | 0.24%(+0.509)#41 | 1.28%(-0.536)#4,242 |
| 42. | Chesterfield | 0.74% | 0.24%(+0.499)#42 | 1.28%(-0.546)#4,278 |
| 43. | Pleasant Valley | 0.73% | 0.24%(+0.490)#43 | 1.28%(-0.555)#4,308 |
| 44. | Versailles | 0.71% | 0.24%(+0.468)#44 | 1.28%(-0.577)#4,394 |
| 45. | Huntleigh | 0.70% | 0.24%(+0.460)#45 | 1.28%(-0.585)#4,438 |
| 46. | Browning | 0.68% | 0.24%(+0.440)#46 | 1.28%(-0.605)#4,516 |
| 47. | Lake St Louis | 0.67% | 0.24%(+0.429)#47 | 1.28%(-0.616)#4,560 |
| 48. | Saginaw | 0.66% | 0.24%(+0.418)#48 | 1.28%(-0.627)#4,604 |
| 49. | Nixa | 0.63% | 0.24%(+0.396)#49 | 1.28%(-0.650)#4,690 |
| 50. | Lakeshire | 0.63% | 0.24%(+0.395)#50 | 1.28%(-0.650)#4,691 |
| 51. | Florissant | 0.63% | 0.24%(+0.389)#51 | 1.28%(-0.656)#4,716 |
| 52. | Paris | 0.58% | 0.24%(+0.340)#52 | 1.28%(-0.706)#4,918 |
| 53. | Marthasville | 0.57% | 0.24%(+0.335)#53 | 1.28%(-0.710)#4,931 |
| 54. | Boonville | 0.57% | 0.24%(+0.332)#54 | 1.28%(-0.714)#4,959 |
| 55. | Sappington | 0.57% | 0.24%(+0.330)#55 | 1.28%(-0.715)#4,969 |
| 56. | Olivette | 0.56% | 0.24%(+0.320)#56 | 1.28%(-0.726)#5,022 |
| 57. | Columbia | 0.56% | 0.24%(+0.318)#57 | 1.28%(-0.728)#5,027 |
| 58. | New Bloomfield | 0.55% | 0.24%(+0.312)#58 | 1.28%(-0.733)#5,046 |
| 59. | Arnold | 0.51% | 0.24%(+0.276)#59 | 1.28%(-0.770)#5,209 |
| 60. | Kansas City | 0.50% | 0.24%(+0.267)#60 | 1.28%(-0.778)#5,248 |
| 61. | Ladue | 0.50% | 0.24%(+0.266)#61 | 1.28%(-0.779)#5,259 |
| 62. | Excelsior Springs | 0.50% | 0.24%(+0.265)#62 | 1.28%(-0.781)#5,264 |
| 63. | Des Peres | 0.45% | 0.24%(+0.211)#63 | 1.28%(-0.835)#5,511 |
| 64. | Windsor Place | 0.45% | 0.24%(+0.209)#64 | 1.28%(-0.837)#5,517 |
| 65. | Lemay | 0.44% | 0.24%(+0.200)#65 | 1.28%(-0.845)#5,554 |
| 66. | Crystal Lake Park | 0.43% | 0.24%(+0.197)#66 | 1.28%(-0.848)#5,577 |
| 67. | Bridgeton | 0.43% | 0.24%(+0.191)#67 | 1.28%(-0.854)#5,619 |
| 68. | Kirkwood | 0.43% | 0.24%(+0.189)#68 | 1.28%(-0.857)#5,631 |
| 69. | St Louis | 0.42% | 0.24%(+0.180)#69 | 1.28%(-0.865)#5,678 |
| 70. | Warrensburg | 0.41% | 0.24%(+0.176)#70 | 1.28%(-0.869)#5,698 |
| 71. | Camdenton | 0.40% | 0.24%(+0.164)#71 | 1.28%(-0.881)#5,775 |
| 72. | Manchester | 0.39% | 0.24%(+0.157)#72 | 1.28%(-0.888)#5,822 |
| 73. | Maplewood | 0.38% | 0.24%(+0.140)#73 | 1.28%(-0.905)#5,918 |
| 74. | Hillsboro | 0.37% | 0.24%(+0.137)#74 | 1.28%(-0.908)#5,933 |
| 75. | Raymore | 0.37% | 0.24%(+0.137)#75 | 1.28%(-0.909)#5,936 |
| 76. | Wardsville | 0.37% | 0.24%(+0.129)#76 | 1.28%(-0.916)#5,974 |
| 77. | Canton | 0.37% | 0.24%(+0.128)#77 | 1.28%(-0.917)#5,979 |
| 78. | Mehlville | 0.36% | 0.24%(+0.126)#78 | 1.28%(-0.919)#5,990 |
| 79. | Wildwood | 0.36% | 0.24%(+0.122)#79 | 1.28%(-0.923)#6,011 |
| 80. | Creve Coeur | 0.36% | 0.24%(+0.121)#80 | 1.28%(-0.924)#6,016 |
| 81. | Green City | 0.34% | 0.24%(+0.098)#81 | 1.28%(-0.948)#6,166 |
| 82. | Unionville | 0.33% | 0.24%(+0.093)#82 | 1.28%(-0.952)#6,198 |
| 83. | Saddlebrooke | 0.32% | 0.24%(+0.081)#83 | 1.28%(-0.965)#6,264 |
| 84. | Moberly | 0.31% | 0.24%(+0.076)#84 | 1.28%(-0.969)#6,295 |
| 85. | Smithville | 0.31% | 0.24%(+0.069)#85 | 1.28%(-0.976)#6,340 |
| 86. | St Charles | 0.30% | 0.24%(+0.063)#86 | 1.28%(-0.982)#6,377 |
| 87. | Blue Springs | 0.29% | 0.24%(+0.057)#87 | 1.28%(-0.989)#6,421 |
| 88. | Flint Hill | 0.29% | 0.24%(+0.050)#88 | 1.28%(-0.995)#6,467 |
| 89. | Battlefield | 0.28% | 0.24%(+0.043)#89 | 1.28%(-1.00)#6,519 |
| 90. | Jackson | 0.28% | 0.24%(+0.041)#90 | 1.28%(-1.00)#6,532 |
| 91. | Maryland Heights | 0.26% | 0.24%(+0.025)#91 | 1.28%(-1.02)#6,627 |
| 92. | Richmond Heights | 0.26% | 0.24%(+0.023)#92 | 1.28%(-1.02)#6,642 |
| 93. | Webster Groves | 0.26% | 0.24%(+0.022)#93 | 1.28%(-1.02)#6,648 |
| 94. | Clinton | 0.26% | 0.24%(+0.020)#94 | 1.28%(-1.02)#6,663 |
| 95. | Crestwood | 0.25% | 0.24%(+0.014)#95 | 1.28%(-1.03)#6,709 |
| 96. | Sikeston | 0.25% | 0.24%(+0.010)#96 | 1.28%(-1.04)#6,746 |
| 97. | Weatherby Lake | 0.25% | 0.24%(+0.010)#97 | 1.28%(-1.04)#6,747 |
| 98. | Lee S Summit | 0.25% | 0.24%(+0.008)#98 | 1.28%(-1.04)#6,758 |
| 99. | Berkeley | 0.24% | 0.24%(+0.005)#99 | 1.28%(-1.04)#6,777 |
| 100. | Strafford | 0.23% | 0.24%(-0.004)#100 | 1.28%(-1.05)#6,839 |
Common Questions
What are the Top 10 Cities with the Highest Percentage of South American Population in Missouri?
Top 10 Cities with the Highest Percentage of South American Population in Missouri are:
#1
7.65%
#2
4.21%
#3
4.15%
#4
4.07%
#5
3.25%
#6
3.12%
#7
2.78%
#8
2.63%
#9
2.59%
#10
2.36%
What city has the Highest Percentage of South American Population in Missouri?
Oaks has the Highest Percentage of South American Population in Missouri with 7.65%.
What is the Percentage of South American Population in the State of Missouri?
Percentage of South American Population in Missouri is 0.24%.
What is the Percentage of South American Population in the United States?
Percentage of South American Population in the United States is 1.28%.