Cities with the Highest Percentage of South American Population in Virginia
RELATED REPORTS & OPTIONS
South American
Virginia
Compare Cities
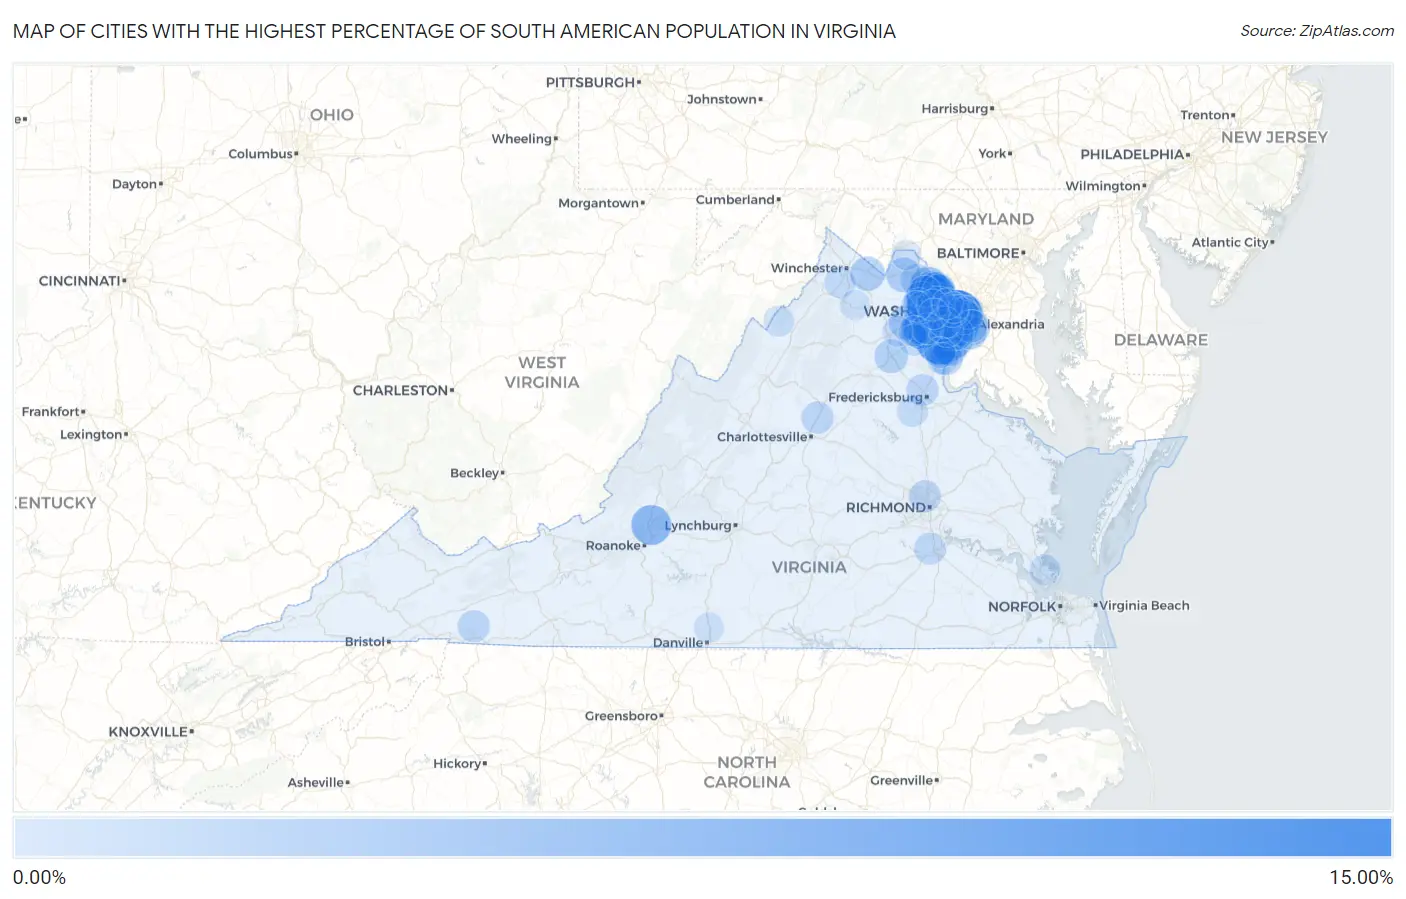
Map of Cities with the Highest Percentage of South American Population in Virginia
0.00%
15.00%
Cities with the Highest Percentage of South American Population in Virginia
| City | South American | vs State | vs National | |
| 1. | West Falls Church | 13.90% | 1.62%(+12.3)#1 | 1.28%(+12.6)#120 |
| 2. | Oak Grove | 13.66% | 1.62%(+12.0)#2 | 1.28%(+12.4)#127 |
| 3. | County Center | 13.10% | 1.62%(+11.5)#3 | 1.28%(+11.8)#137 |
| 4. | Loch Lomond | 10.96% | 1.62%(+9.34)#4 | 1.28%(+9.68)#181 |
| 5. | Fairfield | 9.50% | 1.62%(+7.88)#5 | 1.28%(+8.21)#230 |
| 6. | Annandale | 9.10% | 1.62%(+7.48)#6 | 1.28%(+7.81)#248 |
| 7. | Sterling | 8.87% | 1.62%(+7.25)#7 | 1.28%(+7.58)#253 |
| 8. | Laurel Hill | 8.60% | 1.62%(+6.98)#8 | 1.28%(+7.32)#265 |
| 9. | Troutville | 8.14% | 1.62%(+6.52)#9 | 1.28%(+6.85)#294 |
| 10. | Ravensworth | 7.74% | 1.62%(+6.12)#10 | 1.28%(+6.46)#316 |
| 11. | Fairfax | 7.66% | 1.62%(+6.05)#11 | 1.28%(+6.38)#324 |
| 12. | Burke | 7.34% | 1.62%(+5.72)#12 | 1.28%(+6.05)#347 |
| 13. | Sugarland Run | 7.33% | 1.62%(+5.71)#13 | 1.28%(+6.04)#349 |
| 14. | University Center | 7.17% | 1.62%(+5.56)#14 | 1.28%(+5.89)#357 |
| 15. | Lake Barcroft | 7.15% | 1.62%(+5.53)#15 | 1.28%(+5.86)#358 |
| 16. | Pimmit Hills | 7.09% | 1.62%(+5.47)#16 | 1.28%(+5.81)#362 |
| 17. | Lincolnia | 6.94% | 1.62%(+5.32)#17 | 1.28%(+5.65)#372 |
| 18. | West Springfield | 6.77% | 1.62%(+5.15)#18 | 1.28%(+5.49)#391 |
| 19. | Kings Park | 6.57% | 1.62%(+4.95)#19 | 1.28%(+5.29)#409 |
| 20. | Mantua | 6.48% | 1.62%(+4.86)#20 | 1.28%(+5.20)#416 |
| 21. | Potomac Mills | 6.21% | 1.62%(+4.59)#21 | 1.28%(+4.92)#446 |
| 22. | Sudley | 6.20% | 1.62%(+4.58)#22 | 1.28%(+4.91)#451 |
| 23. | Chantilly | 6.06% | 1.62%(+4.44)#23 | 1.28%(+4.78)#463 |
| 24. | Centreville | 6.05% | 1.62%(+4.43)#24 | 1.28%(+4.77)#465 |
| 25. | Lake Ridge | 6.03% | 1.62%(+4.41)#25 | 1.28%(+4.75)#471 |
| 26. | Herndon | 5.92% | 1.62%(+4.31)#26 | 1.28%(+4.64)#487 |
| 27. | Yorkshire | 5.85% | 1.62%(+4.23)#27 | 1.28%(+4.57)#494 |
| 28. | Falls Church | 5.80% | 1.62%(+4.18)#28 | 1.28%(+4.51)#499 |
| 29. | Rose Hill Cdp Fairfax County | 5.52% | 1.62%(+3.90)#29 | 1.28%(+4.23)#530 |
| 30. | Dale City | 5.42% | 1.62%(+3.80)#30 | 1.28%(+4.14)#546 |
| 31. | Burke Centre | 5.38% | 1.62%(+3.76)#31 | 1.28%(+4.10)#555 |
| 32. | Belle Haven | 5.24% | 1.62%(+3.62)#32 | 1.28%(+3.95)#571 |
| 33. | Hamilton | 5.19% | 1.62%(+3.57)#33 | 1.28%(+3.91)#579 |
| 34. | Franconia | 5.13% | 1.62%(+3.51)#34 | 1.28%(+3.85)#588 |
| 35. | Haymarket | 5.09% | 1.62%(+3.47)#35 | 1.28%(+3.81)#591 |
| 36. | Springfield | 5.03% | 1.62%(+3.41)#36 | 1.28%(+3.74)#601 |
| 37. | Berryville | 4.98% | 1.62%(+3.36)#37 | 1.28%(+3.70)#609 |
| 38. | Woodbridge | 4.96% | 1.62%(+3.34)#38 | 1.28%(+3.68)#614 |
| 39. | Bull Run | 4.92% | 1.62%(+3.30)#39 | 1.28%(+3.64)#621 |
| 40. | Dulles Town Center | 4.88% | 1.62%(+3.26)#40 | 1.28%(+3.59)#627 |
| 41. | North Springfield | 4.83% | 1.62%(+3.21)#41 | 1.28%(+3.55)#636 |
| 42. | Countryside | 4.75% | 1.62%(+3.13)#42 | 1.28%(+3.46)#656 |
| 43. | Loudoun Valley Estates | 4.74% | 1.62%(+3.12)#43 | 1.28%(+3.45)#660 |
| 44. | George Mason | 4.68% | 1.62%(+3.06)#44 | 1.28%(+3.40)#675 |
| 45. | Seven Corners | 4.64% | 1.62%(+3.02)#45 | 1.28%(+3.36)#679 |
| 46. | Hybla Valley | 4.61% | 1.62%(+2.99)#46 | 1.28%(+3.33)#682 |
| 47. | Newington Forest | 4.59% | 1.62%(+2.97)#47 | 1.28%(+3.30)#686 |
| 48. | Bealeton | 4.58% | 1.62%(+2.96)#48 | 1.28%(+3.30)#688 |
| 49. | Bailey S Crossroads | 4.51% | 1.62%(+2.89)#49 | 1.28%(+3.22)#706 |
| 50. | Idylwood | 4.23% | 1.62%(+2.61)#50 | 1.28%(+2.95)#781 |
| 51. | Cherry Hill | 4.20% | 1.62%(+2.58)#51 | 1.28%(+2.92)#800 |
| 52. | Cascades | 4.07% | 1.62%(+2.45)#52 | 1.28%(+2.78)#832 |
| 53. | Mcnair | 4.06% | 1.62%(+2.44)#53 | 1.28%(+2.78)#835 |
| 54. | Long Branch | 4.01% | 1.62%(+2.39)#54 | 1.28%(+2.72)#847 |
| 55. | Arlington | 3.96% | 1.62%(+2.34)#55 | 1.28%(+2.68)#863 |
| 56. | Union Mill | 3.95% | 1.62%(+2.33)#56 | 1.28%(+2.67)#866 |
| 57. | Oakton | 3.92% | 1.62%(+2.30)#57 | 1.28%(+2.64)#871 |
| 58. | Fair Oaks | 3.92% | 1.62%(+2.30)#58 | 1.28%(+2.64)#872 |
| 59. | Huntington | 3.87% | 1.62%(+2.25)#59 | 1.28%(+2.59)#886 |
| 60. | Troutdale | 3.78% | 1.62%(+2.16)#60 | 1.28%(+2.50)#913 |
| 61. | Fairfax Station | 3.74% | 1.62%(+2.12)#61 | 1.28%(+2.46)#926 |
| 62. | Piney Mountain | 3.73% | 1.62%(+2.11)#62 | 1.28%(+2.44)#931 |
| 63. | Great Falls Crossing | 3.69% | 1.62%(+2.07)#63 | 1.28%(+2.41)#944 |
| 64. | Lakeside | 3.69% | 1.62%(+2.07)#64 | 1.28%(+2.40)#946 |
| 65. | Leesburg | 3.68% | 1.62%(+2.06)#65 | 1.28%(+2.40)#947 |
| 66. | Newington | 3.66% | 1.62%(+2.04)#66 | 1.28%(+2.37)#954 |
| 67. | Southern Gateway | 3.65% | 1.62%(+2.03)#67 | 1.28%(+2.36)#962 |
| 68. | Reston | 3.56% | 1.62%(+1.95)#68 | 1.28%(+2.28)#983 |
| 69. | Ettrick | 3.52% | 1.62%(+1.90)#69 | 1.28%(+2.23)#1,000 |
| 70. | Hutchison | 3.45% | 1.62%(+1.84)#70 | 1.28%(+2.17)#1,023 |
| 71. | Dumfries | 3.39% | 1.62%(+1.77)#71 | 1.28%(+2.10)#1,048 |
| 72. | Braddock | 3.38% | 1.62%(+1.76)#72 | 1.28%(+2.10)#1,052 |
| 73. | Manassas | 3.36% | 1.62%(+1.74)#73 | 1.28%(+2.08)#1,060 |
| 74. | South Run | 3.36% | 1.62%(+1.74)#74 | 1.28%(+2.07)#1,062 |
| 75. | Dunn Loring | 3.33% | 1.62%(+1.71)#75 | 1.28%(+2.05)#1,071 |
| 76. | Arcola | 3.28% | 1.62%(+1.66)#76 | 1.28%(+2.00)#1,083 |
| 77. | Stephens City | 3.27% | 1.62%(+1.66)#77 | 1.28%(+1.99)#1,086 |
| 78. | Moorefield | 3.26% | 1.62%(+1.64)#78 | 1.28%(+1.98)#1,089 |
| 79. | South Riding | 3.20% | 1.62%(+1.58)#79 | 1.28%(+1.92)#1,120 |
| 80. | Kings Park West | 3.19% | 1.62%(+1.57)#80 | 1.28%(+1.91)#1,122 |
| 81. | Nokesville | 3.17% | 1.62%(+1.55)#81 | 1.28%(+1.88)#1,130 |
| 82. | Lowes Island | 3.16% | 1.62%(+1.54)#82 | 1.28%(+1.88)#1,136 |
| 83. | Leesylvania | 3.14% | 1.62%(+1.52)#83 | 1.28%(+1.86)#1,146 |
| 84. | Ashburn | 3.09% | 1.62%(+1.47)#84 | 1.28%(+1.81)#1,171 |
| 85. | Spotsylvania Courthouse | 3.09% | 1.62%(+1.47)#85 | 1.28%(+1.80)#1,178 |
| 86. | Manassas Park | 3.08% | 1.62%(+1.46)#86 | 1.28%(+1.79)#1,186 |
| 87. | Bethel Manor | 3.08% | 1.62%(+1.46)#87 | 1.28%(+1.79)#1,188 |
| 88. | Floris | 3.06% | 1.62%(+1.44)#88 | 1.28%(+1.78)#1,191 |
| 89. | Montclair | 3.02% | 1.62%(+1.40)#89 | 1.28%(+1.74)#1,213 |
| 90. | Basye | 2.98% | 1.62%(+1.36)#90 | 1.28%(+1.70)#1,231 |
| 91. | Wolf Trap | 2.98% | 1.62%(+1.36)#91 | 1.28%(+1.70)#1,233 |
| 92. | New Baltimore | 2.84% | 1.62%(+1.22)#92 | 1.28%(+1.56)#1,304 |
| 93. | Tysons | 2.81% | 1.62%(+1.19)#93 | 1.28%(+1.52)#1,320 |
| 94. | Stone Ridge | 2.77% | 1.62%(+1.15)#94 | 1.28%(+1.49)#1,347 |
| 95. | Sully Square | 2.73% | 1.62%(+1.12)#95 | 1.28%(+1.45)#1,368 |
| 96. | Linton Hall | 2.68% | 1.62%(+1.06)#96 | 1.28%(+1.40)#1,389 |
| 97. | Greenbriar | 2.68% | 1.62%(+1.06)#97 | 1.28%(+1.40)#1,391 |
| 98. | Blairs | 2.66% | 1.62%(+1.04)#98 | 1.28%(+1.38)#1,399 |
| 99. | Skyland Estates | 2.65% | 1.62%(+1.04)#99 | 1.28%(+1.37)#1,403 |
| 100. | Lovettsville | 2.59% | 1.62%(+0.969)#100 | 1.28%(+1.31)#1,444 |
Common Questions
What are the Top 10 Cities with the Highest Percentage of South American Population in Virginia?
Top 10 Cities with the Highest Percentage of South American Population in Virginia are:
#1
13.90%
#2
13.66%
#3
13.10%
#4
10.96%
#5
9.10%
#6
8.87%
#7
8.60%
#8
8.14%
#9
7.74%
#10
7.66%
What city has the Highest Percentage of South American Population in Virginia?
West Falls Church has the Highest Percentage of South American Population in Virginia with 13.90%.
What is the Percentage of South American Population in the State of Virginia?
Percentage of South American Population in Virginia is 1.62%.
What is the Percentage of South American Population in the United States?
Percentage of South American Population in the United States is 1.28%.