Cities with the Highest Percentage of South American Population in South Carolina
RELATED REPORTS & OPTIONS
South American
South Carolina
Compare Cities
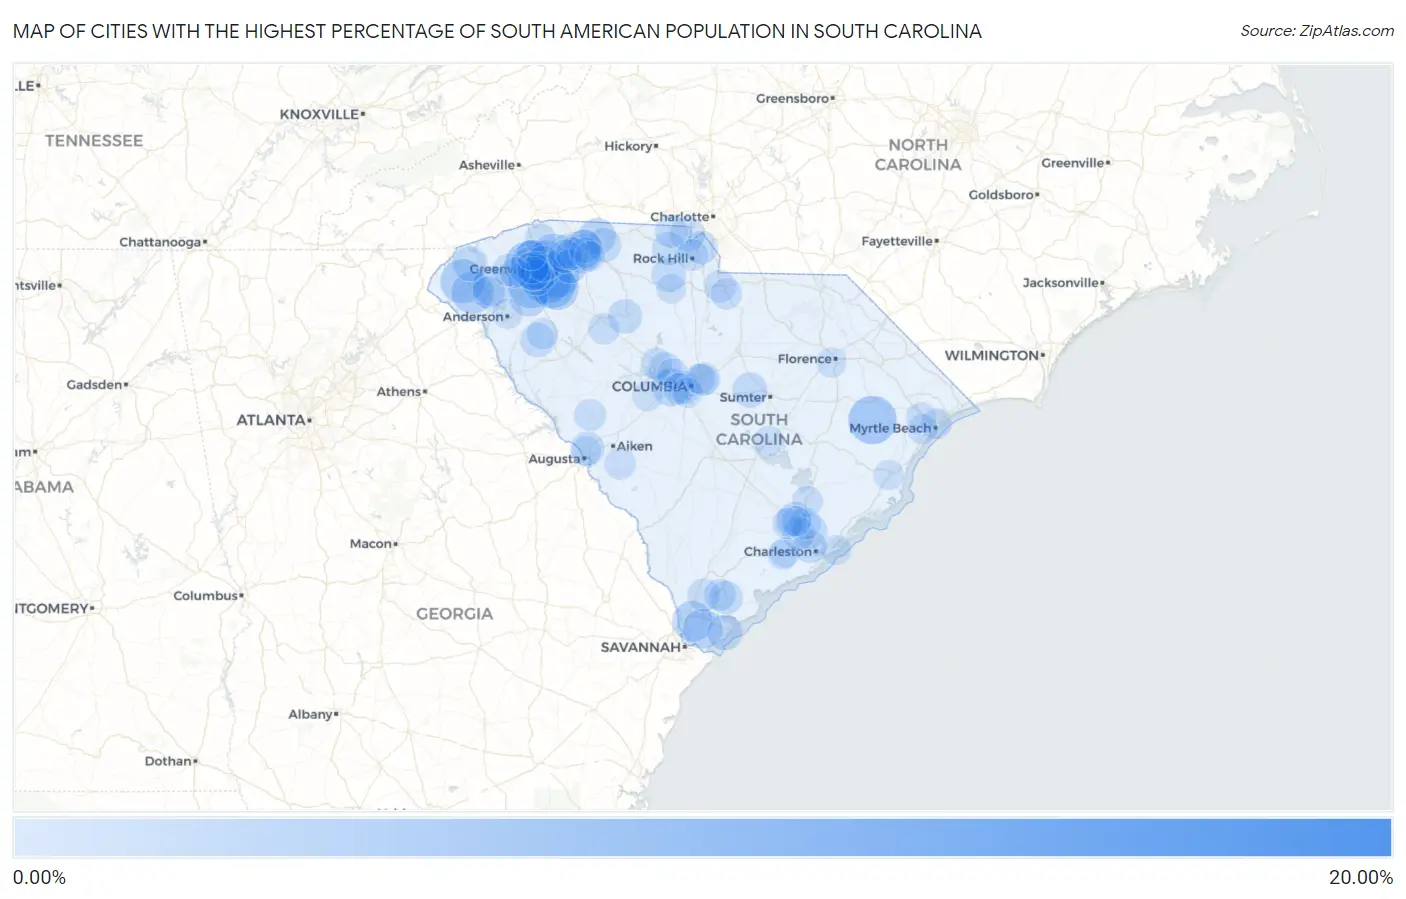
Map of Cities with the Highest Percentage of South American Population in South Carolina
0.00%
20.00%
Cities with the Highest Percentage of South American Population in South Carolina
| City | South American | vs State | vs National | |
| 1. | Hamer | 16.45% | 0.66%(+15.8)#1 | 1.28%(+15.2)#82 |
| 2. | Mauldin | 4.74% | 0.66%(+4.08)#2 | 1.28%(+3.46)#658 |
| 3. | Camp Croft | 4.61% | 0.66%(+3.95)#3 | 1.28%(+3.32)#683 |
| 4. | Hemingway | 4.51% | 0.66%(+3.86)#4 | 1.28%(+3.23)#705 |
| 5. | Berea | 4.44% | 0.66%(+3.78)#5 | 1.28%(+3.16)#721 |
| 6. | Golden Grove | 4.05% | 0.66%(+3.39)#6 | 1.28%(+2.77)#838 |
| 7. | Five Forks | 3.93% | 0.66%(+3.27)#7 | 1.28%(+2.65)#867 |
| 8. | Simpsonville | 3.88% | 0.66%(+3.22)#8 | 1.28%(+2.60)#884 |
| 9. | Sans Souci | 3.71% | 0.66%(+3.05)#9 | 1.28%(+2.42)#941 |
| 10. | West Union | 3.55% | 0.66%(+2.90)#10 | 1.28%(+2.27)#985 |
| 11. | Greer | 3.23% | 0.66%(+2.57)#11 | 1.28%(+1.95)#1,107 |
| 12. | Fountain Inn | 3.09% | 0.66%(+2.43)#12 | 1.28%(+1.81)#1,172 |
| 13. | Seneca | 3.09% | 0.66%(+2.43)#13 | 1.28%(+1.81)#1,173 |
| 14. | Baxter | 2.81% | 0.66%(+2.15)#14 | 1.28%(+1.52)#1,321 |
| 15. | Hardeeville | 2.67% | 0.66%(+2.01)#15 | 1.28%(+1.39)#1,395 |
| 16. | Central | 2.62% | 0.66%(+1.96)#16 | 1.28%(+1.33)#1,420 |
| 17. | Parker | 2.61% | 0.66%(+1.95)#17 | 1.28%(+1.32)#1,429 |
| 18. | Bluffton | 2.53% | 0.66%(+1.87)#18 | 1.28%(+1.25)#1,479 |
| 19. | Southern Shops | 2.49% | 0.66%(+1.83)#19 | 1.28%(+1.21)#1,503 |
| 20. | Arkwright | 2.47% | 0.66%(+1.81)#20 | 1.28%(+1.19)#1,516 |
| 21. | Taylors | 2.44% | 0.66%(+1.78)#21 | 1.28%(+1.16)#1,540 |
| 22. | Arcadia | 2.32% | 0.66%(+1.66)#22 | 1.28%(+1.04)#1,628 |
| 23. | Pelzer | 2.16% | 0.66%(+1.50)#23 | 1.28%(+0.879)#1,746 |
| 24. | Greenville | 2.13% | 0.66%(+1.47)#24 | 1.28%(+0.848)#1,768 |
| 25. | Judson | 2.13% | 0.66%(+1.47)#25 | 1.28%(+0.846)#1,771 |
| 26. | Lexington | 2.05% | 0.66%(+1.39)#26 | 1.28%(+0.762)#1,849 |
| 27. | Chickasaw Point | 1.82% | 0.66%(+1.17)#27 | 1.28%(+0.541)#2,070 |
| 28. | Mayo | 1.77% | 0.66%(+1.11)#28 | 1.28%(+0.483)#2,129 |
| 29. | Gantt | 1.62% | 0.66%(+0.960)#29 | 1.28%(+0.335)#2,301 |
| 30. | Wade Hampton | 1.56% | 0.66%(+0.906)#30 | 1.28%(+0.281)#2,365 |
| 31. | Hilton Head Island | 1.52% | 0.66%(+0.867)#31 | 1.28%(+0.242)#2,412 |
| 32. | Hanahan | 1.45% | 0.66%(+0.789)#32 | 1.28%(+0.164)#2,525 |
| 33. | Stateburg | 1.44% | 0.66%(+0.780)#33 | 1.28%(+0.154)#2,545 |
| 34. | Lake Wylie | 1.42% | 0.66%(+0.760)#34 | 1.28%(+0.135)#2,580 |
| 35. | Salem | 1.38% | 0.66%(+0.721)#35 | 1.28%(+0.096)#2,659 |
| 36. | Lowrys | 1.35% | 0.66%(+0.689)#36 | 1.28%(+0.064)#2,702 |
| 37. | Cowpens | 1.34% | 0.66%(+0.685)#37 | 1.28%(+0.060)#2,708 |
| 38. | Due West | 1.31% | 0.66%(+0.649)#38 | 1.28%(+0.023)#2,766 |
| 39. | Whitmire | 1.27% | 0.66%(+0.617)#39 | 1.28%(-0.008)#2,825 |
| 40. | Lyman | 1.23% | 0.66%(+0.572)#40 | 1.28%(-0.053)#2,909 |
| 41. | Belvedere | 1.23% | 0.66%(+0.569)#41 | 1.28%(-0.056)#2,919 |
| 42. | Beech Island | 1.18% | 0.66%(+0.518)#42 | 1.28%(-0.108)#3,042 |
| 43. | Carolina Forest | 1.17% | 0.66%(+0.510)#43 | 1.28%(-0.115)#3,060 |
| 44. | Sangaree | 1.16% | 0.66%(+0.506)#44 | 1.28%(-0.120)#3,068 |
| 45. | Reidville | 1.15% | 0.66%(+0.495)#45 | 1.28%(-0.130)#3,096 |
| 46. | York | 1.12% | 0.66%(+0.467)#46 | 1.28%(-0.158)#3,161 |
| 47. | Valley Falls | 1.10% | 0.66%(+0.440)#47 | 1.28%(-0.185)#3,218 |
| 48. | Duncan | 1.09% | 0.66%(+0.428)#48 | 1.28%(-0.198)#3,245 |
| 49. | Dunean | 1.08% | 0.66%(+0.422)#49 | 1.28%(-0.203)#3,264 |
| 50. | Fort Mill | 1.03% | 0.66%(+0.376)#50 | 1.28%(-0.249)#3,371 |
| 51. | Beaufort | 1.02% | 0.66%(+0.358)#51 | 1.28%(-0.267)#3,413 |
| 52. | Lake Murray Of Richland | 1.01% | 0.66%(+0.354)#52 | 1.28%(-0.271)#3,424 |
| 53. | Charleston | 1.00% | 0.66%(+0.345)#53 | 1.28%(-0.280)#3,440 |
| 54. | Clover | 0.97% | 0.66%(+0.313)#54 | 1.28%(-0.313)#3,530 |
| 55. | Ridgeland | 0.94% | 0.66%(+0.279)#55 | 1.28%(-0.347)#3,640 |
| 56. | Wellford | 0.93% | 0.66%(+0.273)#56 | 1.28%(-0.352)#3,653 |
| 57. | Clemson | 0.92% | 0.66%(+0.265)#57 | 1.28%(-0.360)#3,679 |
| 58. | North Charleston | 0.89% | 0.66%(+0.234)#58 | 1.28%(-0.392)#3,786 |
| 59. | Woodfield | 0.88% | 0.66%(+0.219)#59 | 1.28%(-0.406)#3,823 |
| 60. | Lancaster | 0.86% | 0.66%(+0.203)#60 | 1.28%(-0.422)#3,852 |
| 61. | West Columbia | 0.86% | 0.66%(+0.201)#61 | 1.28%(-0.424)#3,858 |
| 62. | Arial | 0.86% | 0.66%(+0.199)#62 | 1.28%(-0.426)#3,864 |
| 63. | Laurel Bay | 0.73% | 0.66%(+0.068)#63 | 1.28%(-0.558)#4,314 |
| 64. | Edgefield | 0.72% | 0.66%(+0.061)#64 | 1.28%(-0.564)#4,341 |
| 65. | Chapin | 0.71% | 0.66%(+0.055)#65 | 1.28%(-0.570)#4,363 |
| 66. | City View | 0.71% | 0.66%(+0.050)#66 | 1.28%(-0.576)#4,388 |
| 67. | Goose Creek | 0.67% | 0.66%(+0.009)#67 | 1.28%(-0.616)#4,558 |
| 68. | Rock Hill | 0.66% | 0.66%(-0.001)#68 | 1.28%(-0.627)#4,601 |
| 69. | Joanna | 0.64% | 0.66%(-0.018)#69 | 1.28%(-0.643)#4,666 |
| 70. | New Ellenton | 0.64% | 0.66%(-0.020)#70 | 1.28%(-0.645)#4,672 |
| 71. | Lincolnville | 0.62% | 0.66%(-0.034)#71 | 1.28%(-0.659)#4,729 |
| 72. | Columbia | 0.62% | 0.66%(-0.040)#72 | 1.28%(-0.665)#4,746 |
| 73. | Elgin | 0.59% | 0.66%(-0.068)#73 | 1.28%(-0.693)#4,859 |
| 74. | Oak Grove | 0.58% | 0.66%(-0.078)#74 | 1.28%(-0.703)#4,911 |
| 75. | Donalds | 0.53% | 0.66%(-0.123)#75 | 1.28%(-0.748)#5,121 |
| 76. | Irmo | 0.51% | 0.66%(-0.145)#76 | 1.28%(-0.770)#5,207 |
| 77. | Myrtle Beach | 0.48% | 0.66%(-0.176)#77 | 1.28%(-0.801)#5,348 |
| 78. | Tigerville | 0.47% | 0.66%(-0.187)#78 | 1.28%(-0.812)#5,406 |
| 79. | Moncks Corner | 0.46% | 0.66%(-0.197)#79 | 1.28%(-0.822)#5,451 |
| 80. | Summerville | 0.45% | 0.66%(-0.208)#80 | 1.28%(-0.833)#5,500 |
| 81. | Red Hill | 0.42% | 0.66%(-0.235)#81 | 1.28%(-0.860)#5,644 |
| 82. | Summerton | 0.42% | 0.66%(-0.238)#82 | 1.28%(-0.863)#5,668 |
| 83. | Easley | 0.39% | 0.66%(-0.265)#83 | 1.28%(-0.890)#5,831 |
| 84. | Georgetown | 0.39% | 0.66%(-0.268)#84 | 1.28%(-0.893)#5,851 |
| 85. | Saxon | 0.38% | 0.66%(-0.274)#85 | 1.28%(-0.900)#5,884 |
| 86. | Anderson | 0.37% | 0.66%(-0.287)#86 | 1.28%(-0.912)#5,951 |
| 87. | Summit | 0.37% | 0.66%(-0.287)#87 | 1.28%(-0.912)#5,953 |
| 88. | Cayce | 0.37% | 0.66%(-0.287)#88 | 1.28%(-0.912)#5,954 |
| 89. | Socastee | 0.36% | 0.66%(-0.294)#89 | 1.28%(-0.919)#5,993 |
| 90. | Ravenel | 0.35% | 0.66%(-0.308)#90 | 1.28%(-0.933)#6,069 |
| 91. | White Knoll | 0.35% | 0.66%(-0.310)#91 | 1.28%(-0.935)#6,082 |
| 92. | Ladson | 0.35% | 0.66%(-0.312)#92 | 1.28%(-0.937)#6,091 |
| 93. | Arcadia Lakes | 0.34% | 0.66%(-0.314)#93 | 1.28%(-0.939)#6,105 |
| 94. | Travelers Rest | 0.34% | 0.66%(-0.318)#94 | 1.28%(-0.943)#6,132 |
| 95. | North Augusta | 0.33% | 0.66%(-0.330)#95 | 1.28%(-0.956)#6,215 |
| 96. | Isle Of Palms | 0.32% | 0.66%(-0.336)#96 | 1.28%(-0.961)#6,244 |
| 97. | Spartanburg | 0.30% | 0.66%(-0.355)#97 | 1.28%(-0.980)#6,367 |
| 98. | Chester | 0.29% | 0.66%(-0.373)#98 | 1.28%(-0.998)#6,482 |
| 99. | Florence | 0.28% | 0.66%(-0.375)#99 | 1.28%(-1.00)#6,497 |
| 100. | Hollywood | 0.28% | 0.66%(-0.380)#100 | 1.28%(-1.01)#6,542 |
Common Questions
What are the Top 10 Cities with the Highest Percentage of South American Population in South Carolina?
Top 10 Cities with the Highest Percentage of South American Population in South Carolina are:
#1
4.74%
#2
4.51%
#3
4.44%
#4
4.05%
#5
3.93%
#6
3.88%
#7
3.71%
#8
3.55%
#9
3.23%
#10
3.09%
What city has the Highest Percentage of South American Population in South Carolina?
Mauldin has the Highest Percentage of South American Population in South Carolina with 4.74%.
What is the Percentage of South American Population in the State of South Carolina?
Percentage of South American Population in South Carolina is 0.66%.
What is the Percentage of South American Population in the United States?
Percentage of South American Population in the United States is 1.28%.