Cities with the Highest Percentage of South American Population in Indiana
RELATED REPORTS & OPTIONS
South American
Indiana
Compare Cities
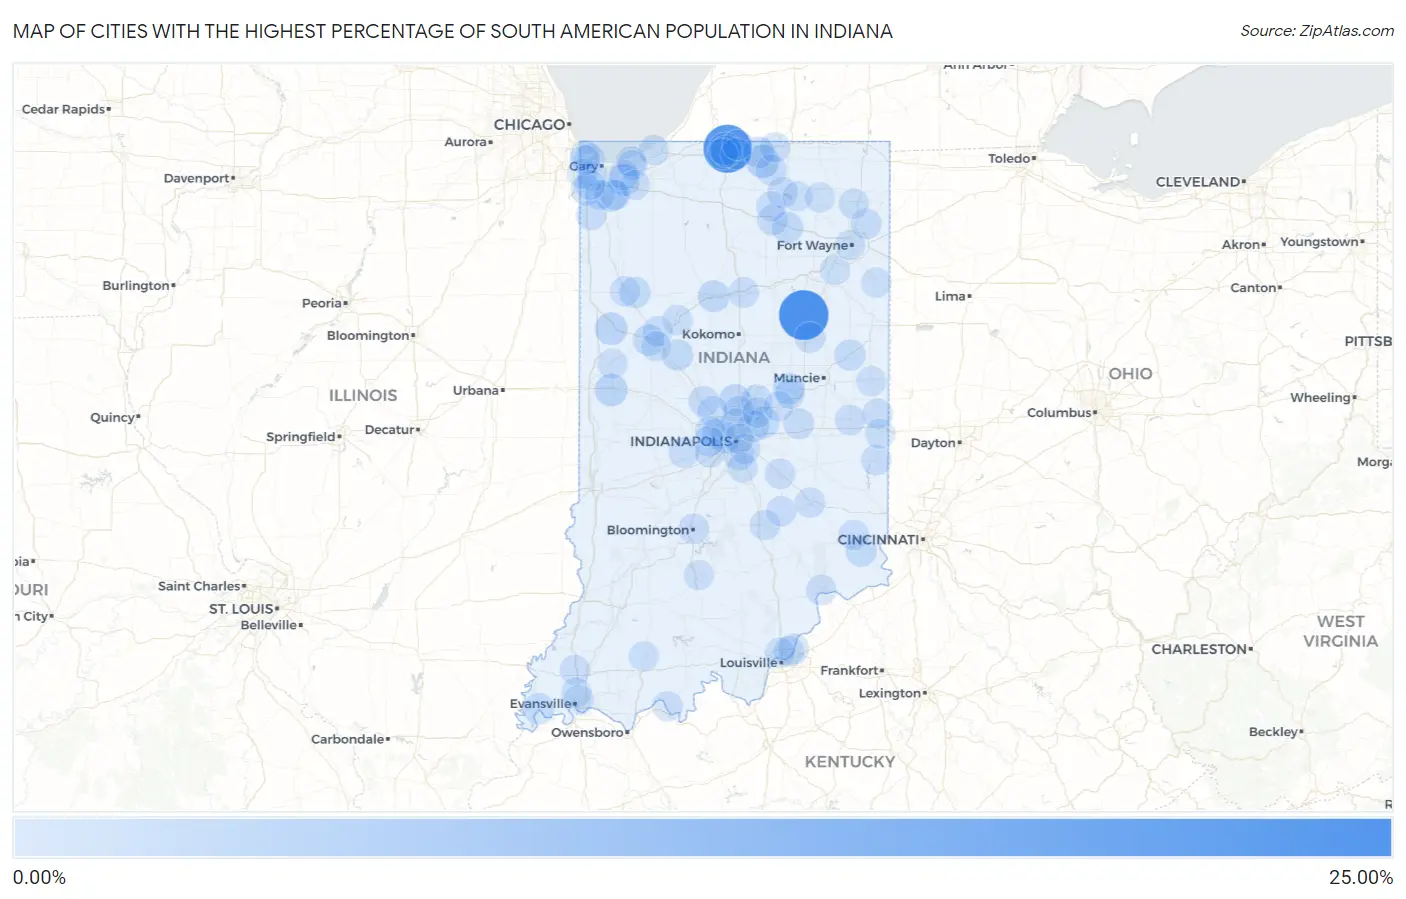
Map of Cities with the Highest Percentage of South American Population in Indiana
0.00%
25.00%
Cities with the Highest Percentage of South American Population in Indiana
| City | South American | vs State | vs National | |
| 1. | Landess | 24.47% | 0.32%(+24.2)#1 | 1.28%(+23.2)#34 |
| 2. | Indian Village | 22.56% | 0.32%(+22.2)#2 | 1.28%(+21.3)#46 |
| 3. | Dunlap | 3.87% | 0.32%(+3.55)#3 | 1.28%(+2.59)#888 |
| 4. | Winfield | 3.46% | 0.32%(+3.15)#4 | 1.28%(+2.18)#1,021 |
| 5. | Veedersburg | 3.08% | 0.32%(+2.76)#5 | 1.28%(+1.80)#1,183 |
| 6. | Oxford | 3.01% | 0.32%(+2.69)#6 | 1.28%(+1.73)#1,219 |
| 7. | Roseland | 2.90% | 0.32%(+2.58)#7 | 1.28%(+1.61)#1,274 |
| 8. | Logansport | 2.12% | 0.32%(+1.80)#8 | 1.28%(+0.836)#1,781 |
| 9. | Salt Creek Commons | 2.05% | 0.32%(+1.73)#9 | 1.28%(+0.766)#1,848 |
| 10. | Westfield | 2.03% | 0.32%(+1.71)#10 | 1.28%(+0.750)#1,866 |
| 11. | Mccordsville | 1.93% | 0.32%(+1.62)#11 | 1.28%(+0.651)#1,958 |
| 12. | Notre Dame | 1.87% | 0.32%(+1.55)#12 | 1.28%(+0.584)#2,017 |
| 13. | Woodlawn Heights | 1.77% | 0.32%(+1.45)#13 | 1.28%(+0.487)#2,126 |
| 14. | Mulberry | 1.72% | 0.32%(+1.40)#14 | 1.28%(+0.433)#2,184 |
| 15. | Pierceton | 1.71% | 0.32%(+1.39)#15 | 1.28%(+0.428)#2,190 |
| 16. | Elkhart | 1.58% | 0.32%(+1.26)#16 | 1.28%(+0.297)#2,346 |
| 17. | West Lafayette | 1.56% | 0.32%(+1.24)#17 | 1.28%(+0.275)#2,376 |
| 18. | Mount Vernon | 1.48% | 0.32%(+1.16)#18 | 1.28%(+0.198)#2,482 |
| 19. | Redkey | 1.42% | 0.32%(+1.10)#19 | 1.28%(+0.139)#2,574 |
| 20. | Clermont | 1.42% | 0.32%(+1.10)#20 | 1.28%(+0.133)#2,583 |
| 21. | Wolcott | 1.38% | 0.32%(+1.06)#21 | 1.28%(+0.099)#2,651 |
| 22. | Dillsboro | 1.38% | 0.32%(+1.06)#22 | 1.28%(+0.099)#2,652 |
| 23. | Mishawaka | 1.34% | 0.32%(+1.02)#23 | 1.28%(+0.057)#2,715 |
| 24. | St John | 1.33% | 0.32%(+1.01)#24 | 1.28%(+0.048)#2,730 |
| 25. | Gilmer Park | 1.29% | 0.32%(+0.968)#25 | 1.28%(+0.003)#2,808 |
| 26. | Lawrence | 1.27% | 0.32%(+0.954)#26 | 1.28%(-0.011)#2,835 |
| 27. | Noblesville | 1.12% | 0.32%(+0.801)#27 | 1.28%(-0.164)#3,175 |
| 28. | Carmel | 1.09% | 0.32%(+0.772)#28 | 1.28%(-0.193)#3,236 |
| 29. | Goshen | 1.04% | 0.32%(+0.725)#29 | 1.28%(-0.240)#3,351 |
| 30. | Warsaw | 1.03% | 0.32%(+0.714)#30 | 1.28%(-0.251)#3,375 |
| 31. | Speedway | 0.94% | 0.32%(+0.620)#31 | 1.28%(-0.345)#3,635 |
| 32. | Leo Cedarville | 0.93% | 0.32%(+0.614)#32 | 1.28%(-0.351)#3,652 |
| 33. | Wilkinson | 0.92% | 0.32%(+0.599)#33 | 1.28%(-0.366)#3,699 |
| 34. | Syracuse | 0.91% | 0.32%(+0.591)#34 | 1.28%(-0.374)#3,725 |
| 35. | Upland | 0.91% | 0.32%(+0.590)#35 | 1.28%(-0.375)#3,726 |
| 36. | Homecroft | 0.81% | 0.32%(+0.496)#36 | 1.28%(-0.469)#3,991 |
| 37. | Meridian Hills | 0.80% | 0.32%(+0.484)#37 | 1.28%(-0.481)#4,027 |
| 38. | South Bend | 0.76% | 0.32%(+0.441)#38 | 1.28%(-0.525)#4,199 |
| 39. | Lowell | 0.73% | 0.32%(+0.409)#39 | 1.28%(-0.556)#4,309 |
| 40. | Lebanon | 0.72% | 0.32%(+0.400)#40 | 1.28%(-0.565)#4,343 |
| 41. | Amo | 0.71% | 0.32%(+0.393)#41 | 1.28%(-0.572)#4,373 |
| 42. | Avon | 0.71% | 0.32%(+0.389)#42 | 1.28%(-0.576)#4,389 |
| 43. | Bloomington | 0.70% | 0.32%(+0.384)#43 | 1.28%(-0.581)#4,415 |
| 44. | Whitestown | 0.68% | 0.32%(+0.365)#44 | 1.28%(-0.600)#4,491 |
| 45. | Beech Grove | 0.68% | 0.32%(+0.360)#45 | 1.28%(-0.605)#4,514 |
| 46. | Columbus | 0.67% | 0.32%(+0.354)#46 | 1.28%(-0.611)#4,538 |
| 47. | Liberty | 0.67% | 0.32%(+0.353)#47 | 1.28%(-0.612)#4,539 |
| 48. | Utica | 0.64% | 0.32%(+0.326)#48 | 1.28%(-0.639)#4,644 |
| 49. | Madison | 0.63% | 0.32%(+0.308)#49 | 1.28%(-0.657)#4,719 |
| 50. | Tell City | 0.62% | 0.32%(+0.298)#50 | 1.28%(-0.667)#4,757 |
| 51. | Peru | 0.59% | 0.32%(+0.271)#51 | 1.28%(-0.694)#4,864 |
| 52. | Fishers | 0.59% | 0.32%(+0.269)#52 | 1.28%(-0.697)#4,876 |
| 53. | Fountain City | 0.52% | 0.32%(+0.199)#53 | 1.28%(-0.766)#5,188 |
| 54. | Milan | 0.50% | 0.32%(+0.187)#54 | 1.28%(-0.778)#5,250 |
| 55. | Hope | 0.47% | 0.32%(+0.155)#55 | 1.28%(-0.810)#5,396 |
| 56. | Greensburg | 0.45% | 0.32%(+0.137)#56 | 1.28%(-0.828)#5,474 |
| 57. | Michigan City | 0.45% | 0.32%(+0.135)#57 | 1.28%(-0.830)#5,483 |
| 58. | Garrett | 0.44% | 0.32%(+0.117)#58 | 1.28%(-0.848)#5,572 |
| 59. | Shelbyville | 0.43% | 0.32%(+0.109)#59 | 1.28%(-0.856)#5,629 |
| 60. | Haubstadt | 0.42% | 0.32%(+0.105)#60 | 1.28%(-0.860)#5,647 |
| 61. | Indianapolis | 0.42% | 0.32%(+0.104)#61 | 1.28%(-0.861)#5,651 |
| 62. | East Chicago | 0.41% | 0.32%(+0.092)#62 | 1.28%(-0.873)#5,720 |
| 63. | Battle Ground | 0.39% | 0.32%(+0.068)#63 | 1.28%(-0.897)#5,871 |
| 64. | Porter | 0.37% | 0.32%(+0.047)#64 | 1.28%(-0.918)#5,985 |
| 65. | Hagerstown | 0.36% | 0.32%(+0.044)#65 | 1.28%(-0.921)#6,002 |
| 66. | Griffith | 0.36% | 0.32%(+0.040)#66 | 1.28%(-0.925)#6,017 |
| 67. | Plainfield | 0.35% | 0.32%(+0.030)#67 | 1.28%(-0.935)#6,086 |
| 68. | Jeffersonville | 0.35% | 0.32%(+0.030)#68 | 1.28%(-0.936)#6,087 |
| 69. | Remington | 0.34% | 0.32%(+0.018)#69 | 1.28%(-0.947)#6,160 |
| 70. | Decatur | 0.32% | 0.32%(+0.001)#70 | 1.28%(-0.964)#6,259 |
| 71. | Lafayette | 0.29% | 0.32%(-0.031)#71 | 1.28%(-0.997)#6,475 |
| 72. | South Haven | 0.28% | 0.32%(-0.042)#72 | 1.28%(-1.01)#6,552 |
| 73. | Brownsburg | 0.28% | 0.32%(-0.042)#73 | 1.28%(-1.01)#6,554 |
| 74. | Highland | 0.27% | 0.32%(-0.050)#74 | 1.28%(-1.01)#6,590 |
| 75. | Greenwood | 0.24% | 0.32%(-0.074)#75 | 1.28%(-1.04)#6,766 |
| 76. | Pendleton | 0.24% | 0.32%(-0.075)#76 | 1.28%(-1.04)#6,775 |
| 77. | Whiting | 0.24% | 0.32%(-0.078)#77 | 1.28%(-1.04)#6,790 |
| 78. | Munster | 0.24% | 0.32%(-0.082)#78 | 1.28%(-1.05)#6,821 |
| 79. | Delphi | 0.23% | 0.32%(-0.084)#79 | 1.28%(-1.05)#6,831 |
| 80. | Huntingburg | 0.22% | 0.32%(-0.102)#80 | 1.28%(-1.07)#6,961 |
| 81. | Bristol | 0.21% | 0.32%(-0.103)#81 | 1.28%(-1.07)#6,970 |
| 82. | Anderson | 0.21% | 0.32%(-0.105)#82 | 1.28%(-1.07)#6,986 |
| 83. | Leesburg | 0.21% | 0.32%(-0.106)#83 | 1.28%(-1.07)#6,993 |
| 84. | Lakes Of The Four Seasons | 0.21% | 0.32%(-0.107)#84 | 1.28%(-1.07)#7,006 |
| 85. | Crown Point | 0.21% | 0.32%(-0.111)#85 | 1.28%(-1.08)#7,034 |
| 86. | Zanesville | 0.19% | 0.32%(-0.129)#86 | 1.28%(-1.09)#7,175 |
| 87. | Cromwell | 0.18% | 0.32%(-0.134)#87 | 1.28%(-1.10)#7,200 |
| 88. | Bedford | 0.18% | 0.32%(-0.137)#88 | 1.28%(-1.10)#7,225 |
| 89. | Evansville | 0.17% | 0.32%(-0.150)#89 | 1.28%(-1.11)#7,310 |
| 90. | Clarksville | 0.17% | 0.32%(-0.151)#90 | 1.28%(-1.12)#7,320 |
| 91. | Fort Wayne | 0.16% | 0.32%(-0.154)#91 | 1.28%(-1.12)#7,344 |
| 92. | Attica | 0.16% | 0.32%(-0.155)#92 | 1.28%(-1.12)#7,351 |
| 93. | Hammond | 0.16% | 0.32%(-0.155)#93 | 1.28%(-1.12)#7,354 |
| 94. | Granger | 0.16% | 0.32%(-0.158)#94 | 1.28%(-1.12)#7,375 |
| 95. | Chesterton | 0.16% | 0.32%(-0.163)#95 | 1.28%(-1.13)#7,406 |
| 96. | Richmond | 0.15% | 0.32%(-0.169)#96 | 1.28%(-1.13)#7,452 |
| 97. | Schererville | 0.15% | 0.32%(-0.173)#97 | 1.28%(-1.14)#7,482 |
| 98. | Albion | 0.14% | 0.32%(-0.177)#98 | 1.28%(-1.14)#7,513 |
| 99. | Valparaiso | 0.14% | 0.32%(-0.180)#99 | 1.28%(-1.14)#7,531 |
| 100. | Winchester | 0.13% | 0.32%(-0.189)#100 | 1.28%(-1.15)#7,593 |
Common Questions
What are the Top 10 Cities with the Highest Percentage of South American Population in Indiana?
Top 10 Cities with the Highest Percentage of South American Population in Indiana are:
#1
24.47%
#2
22.56%
#3
3.87%
#4
3.46%
#5
3.08%
#6
3.01%
#7
2.90%
#8
2.12%
#9
2.05%
#10
2.03%
What city has the Highest Percentage of South American Population in Indiana?
Landess has the Highest Percentage of South American Population in Indiana with 24.47%.
What is the Percentage of South American Population in the State of Indiana?
Percentage of South American Population in Indiana is 0.32%.
What is the Percentage of South American Population in the United States?
Percentage of South American Population in the United States is 1.28%.