Cities with the Highest Percentage of South American Population in Texas
RELATED REPORTS & OPTIONS
South American
Texas
Compare Cities
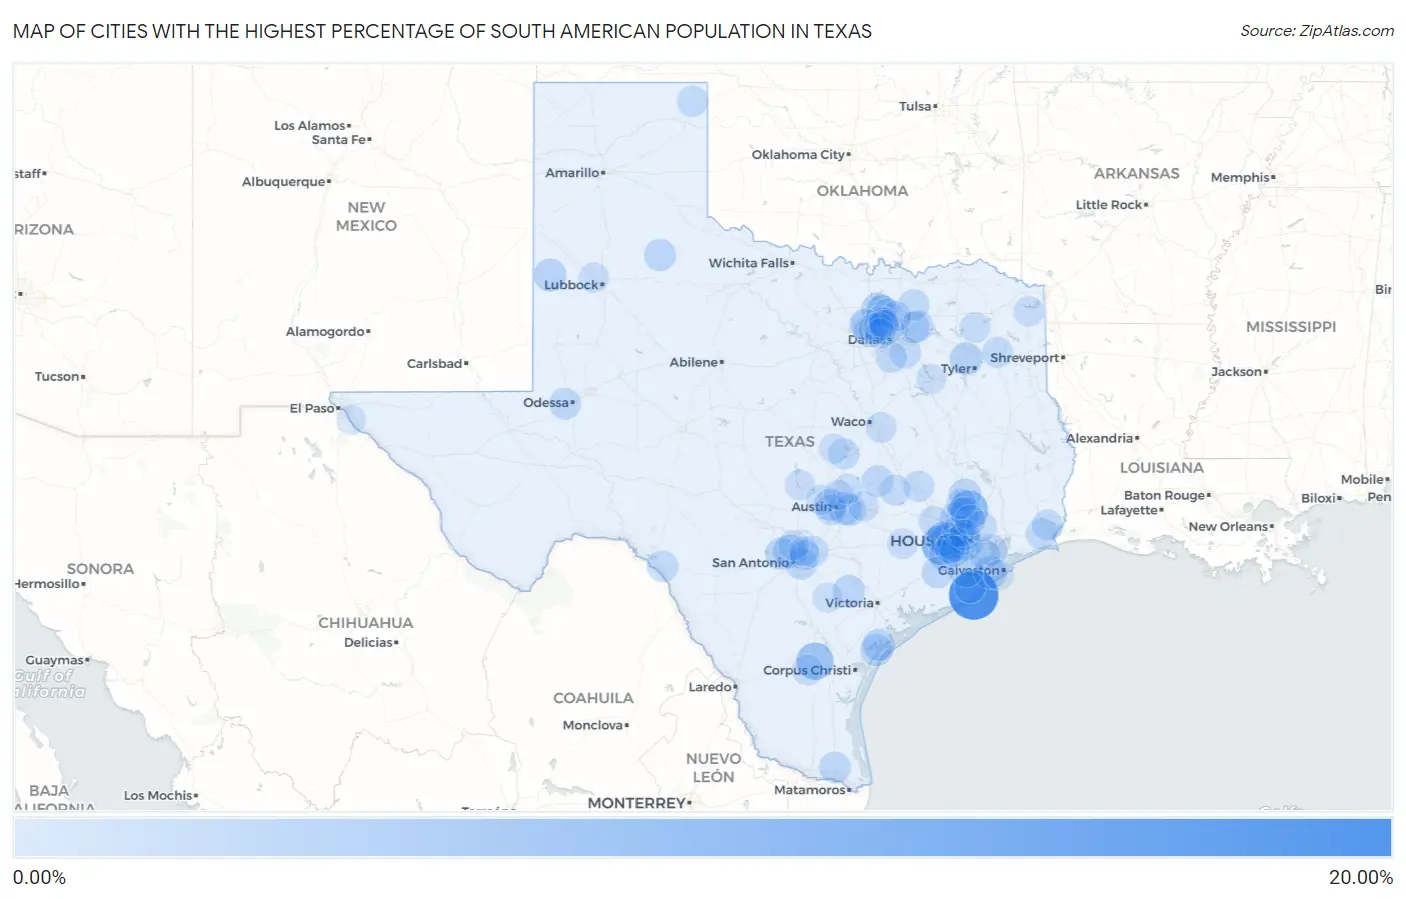
Map of Cities with the Highest Percentage of South American Population in Texas
0.00%
20.00%
Cities with the Highest Percentage of South American Population in Texas
| City | South American | vs State | vs National | |
| 1. | Quintana | 19.51% | 0.97%(+18.5)#1 | 1.28%(+18.2)#63 |
| 2. | Fulshear | 9.73% | 0.97%(+8.77)#2 | 1.28%(+8.45)#220 |
| 3. | Woodloch | 9.15% | 0.97%(+8.18)#3 | 1.28%(+7.87)#244 |
| 4. | Amargosa | 7.69% | 0.97%(+6.73)#4 | 1.28%(+6.41)#321 |
| 5. | Cinco Ranch | 7.37% | 0.97%(+6.40)#5 | 1.28%(+6.08)#341 |
| 6. | Bonney | 5.08% | 0.97%(+4.11)#6 | 1.28%(+3.79)#595 |
| 7. | Katy | 5.04% | 0.97%(+4.08)#7 | 1.28%(+3.76)#599 |
| 8. | Bellaire | 4.74% | 0.97%(+3.78)#8 | 1.28%(+3.46)#657 |
| 9. | Mission Bend | 4.58% | 0.97%(+3.61)#9 | 1.28%(+3.30)#689 |
| 10. | Shavano Park | 4.29% | 0.97%(+3.32)#10 | 1.28%(+3.01)#761 |
| 11. | Hideaway | 4.02% | 0.97%(+3.05)#11 | 1.28%(+2.73)#845 |
| 12. | Tomball | 3.85% | 0.97%(+2.88)#12 | 1.28%(+2.56)#893 |
| 13. | Hitchcock | 3.83% | 0.97%(+2.86)#13 | 1.28%(+2.54)#899 |
| 14. | Morton | 3.82% | 0.97%(+2.85)#14 | 1.28%(+2.53)#906 |
| 15. | Hornsby Bend | 3.74% | 0.97%(+2.78)#15 | 1.28%(+2.46)#925 |
| 16. | Addison | 3.54% | 0.97%(+2.57)#16 | 1.28%(+2.25)#989 |
| 17. | Willis | 3.49% | 0.97%(+2.52)#17 | 1.28%(+2.21)#1,012 |
| 18. | The Woodlands | 3.33% | 0.97%(+2.37)#18 | 1.28%(+2.05)#1,069 |
| 19. | Fulton | 3.30% | 0.97%(+2.34)#19 | 1.28%(+2.02)#1,081 |
| 20. | Yorktown | 3.30% | 0.97%(+2.33)#20 | 1.28%(+2.02)#1,082 |
| 21. | Lamar | 3.27% | 0.97%(+2.31)#21 | 1.28%(+1.99)#1,087 |
| 22. | Spring Valley Village | 3.27% | 0.97%(+2.30)#22 | 1.28%(+1.99)#1,088 |
| 23. | Colleyville | 3.08% | 0.97%(+2.11)#23 | 1.28%(+1.80)#1,184 |
| 24. | Matador | 3.08% | 0.97%(+2.11)#24 | 1.28%(+1.80)#1,185 |
| 25. | Lost Creek | 3.02% | 0.97%(+2.05)#25 | 1.28%(+1.74)#1,214 |
| 26. | Rosenberg | 3.02% | 0.97%(+2.05)#26 | 1.28%(+1.73)#1,216 |
| 27. | Helotes | 3.01% | 0.97%(+2.04)#27 | 1.28%(+1.73)#1,220 |
| 28. | Cross Roads | 2.97% | 0.97%(+2.01)#28 | 1.28%(+1.69)#1,235 |
| 29. | Royse City | 2.91% | 0.97%(+1.94)#29 | 1.28%(+1.63)#1,265 |
| 30. | West Odessa | 2.87% | 0.97%(+1.90)#30 | 1.28%(+1.58)#1,291 |
| 31. | Rockdale | 2.84% | 0.97%(+1.87)#31 | 1.28%(+1.56)#1,306 |
| 32. | Webberville | 2.82% | 0.97%(+1.85)#32 | 1.28%(+1.53)#1,313 |
| 33. | Shoreacres | 2.79% | 0.97%(+1.82)#33 | 1.28%(+1.51)#1,336 |
| 34. | Primera | 2.76% | 0.97%(+1.79)#34 | 1.28%(+1.48)#1,356 |
| 35. | Boling | 2.68% | 0.97%(+1.72)#35 | 1.28%(+1.40)#1,390 |
| 36. | Fate | 2.66% | 0.97%(+1.69)#36 | 1.28%(+1.37)#1,402 |
| 37. | China Grove | 2.65% | 0.97%(+1.68)#37 | 1.28%(+1.37)#1,406 |
| 38. | Laughlin Afb | 2.63% | 0.97%(+1.66)#38 | 1.28%(+1.34)#1,416 |
| 39. | Combine | 2.61% | 0.97%(+1.64)#39 | 1.28%(+1.32)#1,430 |
| 40. | Jersey Village | 2.59% | 0.97%(+1.62)#40 | 1.28%(+1.31)#1,441 |
| 41. | Blue Ridge | 2.55% | 0.97%(+1.58)#41 | 1.28%(+1.26)#1,464 |
| 42. | Taylor Landing | 2.49% | 0.97%(+1.53)#42 | 1.28%(+1.21)#1,502 |
| 43. | Clute | 2.45% | 0.97%(+1.48)#43 | 1.28%(+1.16)#1,530 |
| 44. | Little Elm | 2.42% | 0.97%(+1.45)#44 | 1.28%(+1.14)#1,552 |
| 45. | Shenandoah | 2.41% | 0.97%(+1.45)#45 | 1.28%(+1.13)#1,555 |
| 46. | Santa Clara | 2.38% | 0.97%(+1.42)#46 | 1.28%(+1.10)#1,580 |
| 47. | Lipscomb | 2.38% | 0.97%(+1.41)#47 | 1.28%(+1.10)#1,585 |
| 48. | Nolanville | 2.36% | 0.97%(+1.39)#48 | 1.28%(+1.08)#1,602 |
| 49. | College Station | 2.21% | 0.97%(+1.24)#49 | 1.28%(+0.927)#1,711 |
| 50. | Central Gardens | 2.21% | 0.97%(+1.24)#50 | 1.28%(+0.923)#1,714 |
| 51. | Red Oak | 2.19% | 0.97%(+1.23)#51 | 1.28%(+0.912)#1,722 |
| 52. | Paloma Creek South | 2.19% | 0.97%(+1.22)#52 | 1.28%(+0.902)#1,732 |
| 53. | Union Grove | 2.13% | 0.97%(+1.17)#53 | 1.28%(+0.850)#1,765 |
| 54. | Roanoke | 2.09% | 0.97%(+1.12)#54 | 1.28%(+0.808)#1,811 |
| 55. | Webster | 2.07% | 0.97%(+1.10)#55 | 1.28%(+0.782)#1,837 |
| 56. | Willow Grove | 2.06% | 0.97%(+1.10)#56 | 1.28%(+0.779)#1,839 |
| 57. | Sugar Land | 2.05% | 0.97%(+1.09)#57 | 1.28%(+0.769)#1,843 |
| 58. | Houston | 2.03% | 0.97%(+1.06)#58 | 1.28%(+0.743)#1,872 |
| 59. | Caldwell | 2.01% | 0.97%(+1.05)#59 | 1.28%(+0.731)#1,887 |
| 60. | Westlake | 2.00% | 0.97%(+1.03)#60 | 1.28%(+0.717)#1,899 |
| 61. | San Diego | 2.00% | 0.97%(+1.03)#61 | 1.28%(+0.716)#1,900 |
| 62. | Pine Island | 1.99% | 0.97%(+1.02)#62 | 1.28%(+0.704)#1,913 |
| 63. | Atascocita | 1.98% | 0.97%(+1.01)#63 | 1.28%(+0.693)#1,920 |
| 64. | Sunset Valley | 1.96% | 0.97%(+0.991)#64 | 1.28%(+0.674)#1,937 |
| 65. | Rockwell Place | 1.94% | 0.97%(+0.974)#65 | 1.28%(+0.657)#1,952 |
| 66. | Randolph Afb | 1.92% | 0.97%(+0.959)#66 | 1.28%(+0.642)#1,973 |
| 67. | Farmers Branch | 1.92% | 0.97%(+0.954)#67 | 1.28%(+0.637)#1,977 |
| 68. | Stockton Bend | 1.86% | 0.97%(+0.892)#68 | 1.28%(+0.575)#2,031 |
| 69. | Riesel | 1.85% | 0.97%(+0.879)#69 | 1.28%(+0.562)#2,050 |
| 70. | Lewisville | 1.80% | 0.97%(+0.833)#70 | 1.28%(+0.516)#2,095 |
| 71. | Winnsboro | 1.75% | 0.97%(+0.783)#71 | 1.28%(+0.466)#2,149 |
| 72. | Douglassville | 1.72% | 0.97%(+0.758)#72 | 1.28%(+0.441)#2,175 |
| 73. | Frisco | 1.72% | 0.97%(+0.754)#73 | 1.28%(+0.437)#2,176 |
| 74. | Timberwood Park | 1.69% | 0.97%(+0.727)#74 | 1.28%(+0.410)#2,209 |
| 75. | Columbus | 1.68% | 0.97%(+0.716)#75 | 1.28%(+0.399)#2,222 |
| 76. | Conroe | 1.64% | 0.97%(+0.670)#76 | 1.28%(+0.353)#2,274 |
| 77. | Grapevine | 1.63% | 0.97%(+0.667)#77 | 1.28%(+0.350)#2,281 |
| 78. | Allen | 1.61% | 0.97%(+0.647)#78 | 1.28%(+0.330)#2,307 |
| 79. | Seis Lagos | 1.61% | 0.97%(+0.642)#79 | 1.28%(+0.325)#2,312 |
| 80. | Mcdade | 1.61% | 0.97%(+0.641)#80 | 1.28%(+0.324)#2,314 |
| 81. | Granite Shoals | 1.57% | 0.97%(+0.603)#81 | 1.28%(+0.286)#2,357 |
| 82. | Spring | 1.57% | 0.97%(+0.603)#82 | 1.28%(+0.286)#2,358 |
| 83. | Hutto | 1.56% | 0.97%(+0.593)#83 | 1.28%(+0.276)#2,374 |
| 84. | Coppell | 1.54% | 0.97%(+0.577)#84 | 1.28%(+0.260)#2,396 |
| 85. | Irving | 1.52% | 0.97%(+0.553)#85 | 1.28%(+0.236)#2,421 |
| 86. | Point Venture | 1.51% | 0.97%(+0.546)#86 | 1.28%(+0.229)#2,431 |
| 87. | Shallowater | 1.50% | 0.97%(+0.538)#87 | 1.28%(+0.221)#2,443 |
| 88. | Hebron | 1.47% | 0.97%(+0.500)#88 | 1.28%(+0.183)#2,505 |
| 89. | Karnes City | 1.41% | 0.97%(+0.447)#89 | 1.28%(+0.130)#2,588 |
| 90. | Rosanky | 1.41% | 0.97%(+0.446)#90 | 1.28%(+0.129)#2,590 |
| 91. | Carrollton | 1.41% | 0.97%(+0.444)#91 | 1.28%(+0.127)#2,594 |
| 92. | Fort Hood | 1.40% | 0.97%(+0.431)#92 | 1.28%(+0.114)#2,619 |
| 93. | Wells Branch | 1.39% | 0.97%(+0.426)#93 | 1.28%(+0.108)#2,630 |
| 94. | Pecan Grove | 1.39% | 0.97%(+0.421)#94 | 1.28%(+0.104)#2,638 |
| 95. | Star Harbor | 1.38% | 0.97%(+0.412)#95 | 1.28%(+0.095)#2,660 |
| 96. | Belterra | 1.36% | 0.97%(+0.397)#96 | 1.28%(+0.080)#2,680 |
| 97. | Galveston | 1.36% | 0.97%(+0.391)#97 | 1.28%(+0.074)#2,687 |
| 98. | San Elizario | 1.32% | 0.97%(+0.354)#98 | 1.28%(+0.037)#2,750 |
| 99. | Selma | 1.28% | 0.97%(+0.317)#99 | 1.28%(-0.000)#2,814 |
| 100. | Sienna | 1.28% | 0.97%(+0.313)#100 | 1.28%(-0.005)#2,820 |
Common Questions
What are the Top 10 Cities with the Highest Percentage of South American Population in Texas?
Top 10 Cities with the Highest Percentage of South American Population in Texas are:
#1
19.51%
#2
9.73%
#3
9.15%
#4
7.69%
#5
7.37%
#6
5.08%
#7
5.04%
#8
4.74%
#9
4.58%
#10
4.29%
What city has the Highest Percentage of South American Population in Texas?
Quintana has the Highest Percentage of South American Population in Texas with 19.51%.
What is the Percentage of South American Population in the State of Texas?
Percentage of South American Population in Texas is 0.97%.
What is the Percentage of South American Population in the United States?
Percentage of South American Population in the United States is 1.28%.