Cities with the Highest Percentage of South American Population in Utah
RELATED REPORTS & OPTIONS
South American
Utah
Compare Cities
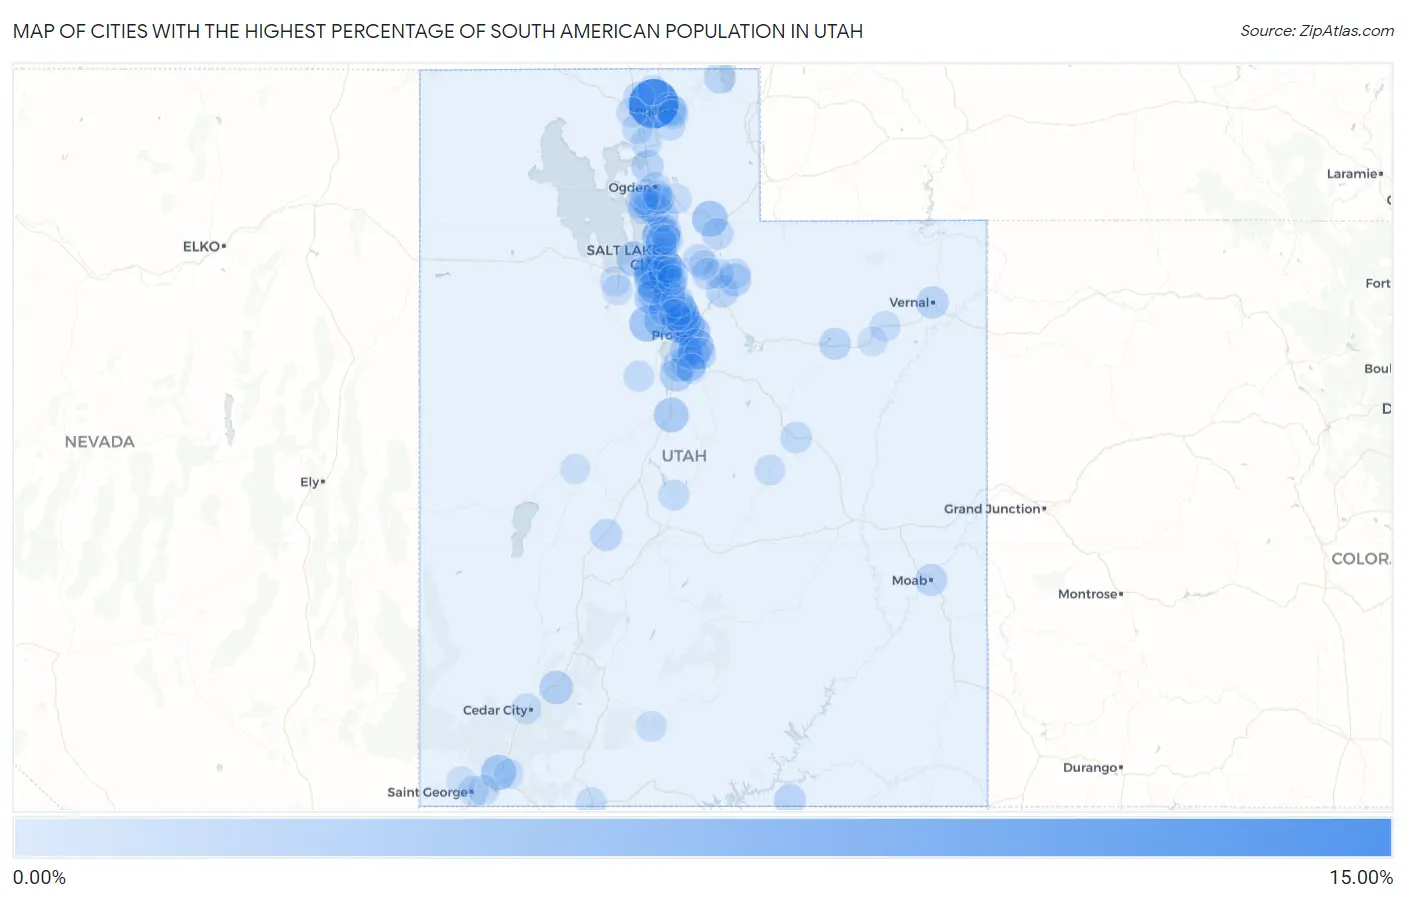
Map of Cities with the Highest Percentage of South American Population in Utah
0.00%
15.00%
Cities with the Highest Percentage of South American Population in Utah
| City | South American | vs State | vs National | |
| 1. | Peter | 10.87% | 1.57%(+9.30)#1 | 1.28%(+9.59)#185 |
| 2. | West Bountiful | 4.56% | 1.57%(+2.98)#2 | 1.28%(+3.27)#696 |
| 3. | Orem | 3.80% | 1.57%(+2.23)#3 | 1.28%(+2.52)#908 |
| 4. | Vineyard | 3.74% | 1.57%(+2.16)#4 | 1.28%(+2.45)#927 |
| 5. | West Jordan | 3.56% | 1.57%(+1.99)#5 | 1.28%(+2.28)#982 |
| 6. | Eagle Mountain | 3.44% | 1.57%(+1.87)#6 | 1.28%(+2.16)#1,028 |
| 7. | South Salt Lake | 3.31% | 1.57%(+1.74)#7 | 1.28%(+2.03)#1,078 |
| 8. | Henefer | 3.25% | 1.57%(+1.68)#8 | 1.28%(+1.97)#1,100 |
| 9. | Provo | 3.08% | 1.57%(+1.51)#9 | 1.28%(+1.80)#1,180 |
| 10. | Leeds | 3.01% | 1.57%(+1.44)#10 | 1.28%(+1.72)#1,221 |
| 11. | Springville | 2.94% | 1.57%(+1.36)#11 | 1.28%(+1.65)#1,250 |
| 12. | Saratoga Springs | 2.93% | 1.57%(+1.36)#12 | 1.28%(+1.65)#1,251 |
| 13. | Lindon | 2.93% | 1.57%(+1.36)#13 | 1.28%(+1.64)#1,258 |
| 14. | Sandy | 2.87% | 1.57%(+1.30)#14 | 1.28%(+1.59)#1,288 |
| 15. | Nephi | 2.77% | 1.57%(+1.19)#15 | 1.28%(+1.48)#1,350 |
| 16. | Salem | 2.76% | 1.57%(+1.18)#16 | 1.28%(+1.47)#1,358 |
| 17. | Magna | 2.65% | 1.57%(+1.08)#17 | 1.28%(+1.37)#1,405 |
| 18. | Taylorsville | 2.56% | 1.57%(+0.993)#18 | 1.28%(+1.28)#1,452 |
| 19. | Riverton | 2.49% | 1.57%(+0.922)#19 | 1.28%(+1.21)#1,499 |
| 20. | West Valley City | 2.45% | 1.57%(+0.876)#20 | 1.28%(+1.17)#1,528 |
| 21. | Midvale | 2.40% | 1.57%(+0.829)#21 | 1.28%(+1.12)#1,566 |
| 22. | Pleasant Grove | 2.32% | 1.57%(+0.748)#22 | 1.28%(+1.04)#1,625 |
| 23. | Kearns | 2.32% | 1.57%(+0.747)#23 | 1.28%(+1.04)#1,627 |
| 24. | Herriman | 2.29% | 1.57%(+0.715)#24 | 1.28%(+1.00)#1,642 |
| 25. | Murray | 2.19% | 1.57%(+0.616)#25 | 1.28%(+0.905)#1,728 |
| 26. | Cedar Hills | 2.12% | 1.57%(+0.553)#26 | 1.28%(+0.842)#1,774 |
| 27. | Parowan | 2.08% | 1.57%(+0.503)#27 | 1.28%(+0.792)#1,828 |
| 28. | Payson | 1.99% | 1.57%(+0.420)#28 | 1.28%(+0.710)#1,907 |
| 29. | Santaquin | 1.84% | 1.57%(+0.267)#29 | 1.28%(+0.556)#2,056 |
| 30. | Draper | 1.84% | 1.57%(+0.266)#30 | 1.28%(+0.556)#2,057 |
| 31. | Palmyra | 1.83% | 1.57%(+0.255)#31 | 1.28%(+0.544)#2,068 |
| 32. | Spanish Fork | 1.73% | 1.57%(+0.156)#32 | 1.28%(+0.445)#2,168 |
| 33. | Salt Lake City | 1.73% | 1.57%(+0.154)#33 | 1.28%(+0.443)#2,172 |
| 34. | Francis | 1.72% | 1.57%(+0.144)#34 | 1.28%(+0.433)#2,182 |
| 35. | Lehi | 1.64% | 1.57%(+0.068)#35 | 1.28%(+0.357)#2,265 |
| 36. | Layton | 1.57% | 1.57%(-0.005)#36 | 1.28%(+0.284)#2,361 |
| 37. | Heber | 1.55% | 1.57%(-0.026)#37 | 1.28%(+0.263)#2,391 |
| 38. | South Jordan | 1.53% | 1.57%(-0.039)#38 | 1.28%(+0.250)#2,406 |
| 39. | North Salt Lake | 1.51% | 1.57%(-0.064)#39 | 1.28%(+0.225)#2,436 |
| 40. | Alpine | 1.50% | 1.57%(-0.071)#40 | 1.28%(+0.218)#2,449 |
| 41. | Vernal | 1.50% | 1.57%(-0.073)#41 | 1.28%(+0.216)#2,454 |
| 42. | South Willard | 1.49% | 1.57%(-0.086)#42 | 1.28%(+0.203)#2,473 |
| 43. | Centerville | 1.43% | 1.57%(-0.139)#43 | 1.28%(+0.151)#2,553 |
| 44. | Moab | 1.41% | 1.57%(-0.165)#44 | 1.28%(+0.124)#2,598 |
| 45. | Navajo Mountain | 1.36% | 1.57%(-0.215)#45 | 1.28%(+0.074)#2,686 |
| 46. | Garden City | 1.32% | 1.57%(-0.252)#46 | 1.28%(+0.038)#2,749 |
| 47. | Fruit Heights | 1.31% | 1.57%(-0.260)#47 | 1.28%(+0.030)#2,758 |
| 48. | Mapleton | 1.30% | 1.57%(-0.271)#48 | 1.28%(+0.018)#2,778 |
| 49. | American Fork | 1.29% | 1.57%(-0.281)#49 | 1.28%(+0.009)#2,795 |
| 50. | Clearfield | 1.28% | 1.57%(-0.293)#50 | 1.28%(-0.004)#2,819 |
| 51. | Duchesne | 1.27% | 1.57%(-0.298)#51 | 1.28%(-0.009)#2,827 |
| 52. | Logan | 1.25% | 1.57%(-0.321)#52 | 1.28%(-0.032)#2,872 |
| 53. | Coalville | 1.24% | 1.57%(-0.331)#53 | 1.28%(-0.042)#2,885 |
| 54. | Meadow | 1.23% | 1.57%(-0.343)#54 | 1.28%(-0.054)#2,910 |
| 55. | Summit Park | 1.18% | 1.57%(-0.389)#55 | 1.28%(-0.100)#3,028 |
| 56. | Millcreek | 1.17% | 1.57%(-0.399)#56 | 1.28%(-0.110)#3,051 |
| 57. | Park City | 1.16% | 1.57%(-0.415)#57 | 1.28%(-0.125)#3,081 |
| 58. | West Point | 1.14% | 1.57%(-0.432)#58 | 1.28%(-0.143)#3,128 |
| 59. | Fielding | 1.06% | 1.57%(-0.508)#59 | 1.28%(-0.219)#3,308 |
| 60. | Wellington | 1.06% | 1.57%(-0.510)#60 | 1.28%(-0.221)#3,310 |
| 61. | River Heights | 0.94% | 1.57%(-0.633)#61 | 1.28%(-0.344)#3,630 |
| 62. | Woods Cross | 0.89% | 1.57%(-0.680)#62 | 1.28%(-0.391)#3,782 |
| 63. | Syracuse | 0.89% | 1.57%(-0.685)#63 | 1.28%(-0.396)#3,792 |
| 64. | Holladay | 0.88% | 1.57%(-0.688)#64 | 1.28%(-0.399)#3,805 |
| 65. | White | 0.86% | 1.57%(-0.709)#65 | 1.28%(-0.420)#3,850 |
| 66. | Hyrum | 0.86% | 1.57%(-0.715)#66 | 1.28%(-0.426)#3,863 |
| 67. | Ogden | 0.84% | 1.57%(-0.731)#67 | 1.28%(-0.442)#3,909 |
| 68. | South Weber | 0.83% | 1.57%(-0.741)#68 | 1.28%(-0.452)#3,945 |
| 69. | Brigham City | 0.81% | 1.57%(-0.766)#69 | 1.28%(-0.477)#4,015 |
| 70. | Gunnison | 0.80% | 1.57%(-0.776)#70 | 1.28%(-0.487)#4,059 |
| 71. | Kamas | 0.79% | 1.57%(-0.784)#71 | 1.28%(-0.495)#4,097 |
| 72. | Bear River City | 0.77% | 1.57%(-0.802)#72 | 1.28%(-0.513)#4,162 |
| 73. | East Basin | 0.77% | 1.57%(-0.804)#73 | 1.28%(-0.515)#4,168 |
| 74. | Bountiful | 0.76% | 1.57%(-0.812)#74 | 1.28%(-0.522)#4,192 |
| 75. | Eureka | 0.74% | 1.57%(-0.831)#75 | 1.28%(-0.541)#4,262 |
| 76. | Washington | 0.71% | 1.57%(-0.859)#76 | 1.28%(-0.570)#4,359 |
| 77. | Roy | 0.71% | 1.57%(-0.861)#77 | 1.28%(-0.571)#4,370 |
| 78. | Henrieville | 0.70% | 1.57%(-0.873)#78 | 1.28%(-0.584)#4,431 |
| 79. | St George | 0.68% | 1.57%(-0.892)#79 | 1.28%(-0.603)#4,505 |
| 80. | Kanab | 0.64% | 1.57%(-0.929)#80 | 1.28%(-0.640)#4,645 |
| 81. | Cedar City | 0.62% | 1.57%(-0.955)#81 | 1.28%(-0.666)#4,749 |
| 82. | Mountain Green | 0.60% | 1.57%(-0.969)#82 | 1.28%(-0.680)#4,803 |
| 83. | Cottonwood Heights | 0.60% | 1.57%(-0.971)#83 | 1.28%(-0.682)#4,815 |
| 84. | Ballard | 0.59% | 1.57%(-0.984)#84 | 1.28%(-0.695)#4,870 |
| 85. | Huntington | 0.58% | 1.57%(-0.995)#85 | 1.28%(-0.706)#4,921 |
| 86. | Hideout | 0.56% | 1.57%(-1.01)#86 | 1.28%(-0.720)#4,992 |
| 87. | Uintah | 0.56% | 1.57%(-1.01)#87 | 1.28%(-0.724)#5,010 |
| 88. | Newton | 0.55% | 1.57%(-1.02)#88 | 1.28%(-0.728)#5,032 |
| 89. | Tremonton | 0.55% | 1.57%(-1.03)#89 | 1.28%(-0.738)#5,068 |
| 90. | Erda | 0.51% | 1.57%(-1.06)#90 | 1.28%(-0.771)#5,213 |
| 91. | Tooele | 0.50% | 1.57%(-1.08)#91 | 1.28%(-0.787)#5,298 |
| 92. | Woodland Hills | 0.45% | 1.57%(-1.12)#92 | 1.28%(-0.832)#5,490 |
| 93. | Clinton | 0.43% | 1.57%(-1.14)#93 | 1.28%(-0.856)#5,626 |
| 94. | South Ogden | 0.42% | 1.57%(-1.15)#94 | 1.28%(-0.860)#5,645 |
| 95. | Snyderville | 0.40% | 1.57%(-1.17)#95 | 1.28%(-0.882)#5,784 |
| 96. | Ivins | 0.38% | 1.57%(-1.19)#96 | 1.28%(-0.902)#5,900 |
| 97. | Hinckley | 0.38% | 1.57%(-1.19)#97 | 1.28%(-0.903)#5,912 |
| 98. | Providence | 0.33% | 1.57%(-1.24)#98 | 1.28%(-0.951)#6,184 |
| 99. | Myton | 0.32% | 1.57%(-1.25)#99 | 1.28%(-0.958)#6,230 |
| 100. | La Verkin | 0.30% | 1.57%(-1.27)#100 | 1.28%(-0.985)#6,388 |
Common Questions
What are the Top 10 Cities with the Highest Percentage of South American Population in Utah?
Top 10 Cities with the Highest Percentage of South American Population in Utah are:
#1
10.87%
#2
4.56%
#3
3.80%
#4
3.74%
#5
3.56%
#6
3.44%
#7
3.31%
#8
3.25%
#9
3.08%
#10
3.01%
What city has the Highest Percentage of South American Population in Utah?
Peter has the Highest Percentage of South American Population in Utah with 10.87%.
What is the Percentage of South American Population in the State of Utah?
Percentage of South American Population in Utah is 1.57%.
What is the Percentage of South American Population in the United States?
Percentage of South American Population in the United States is 1.28%.