Lomita, CA Map & Demographics
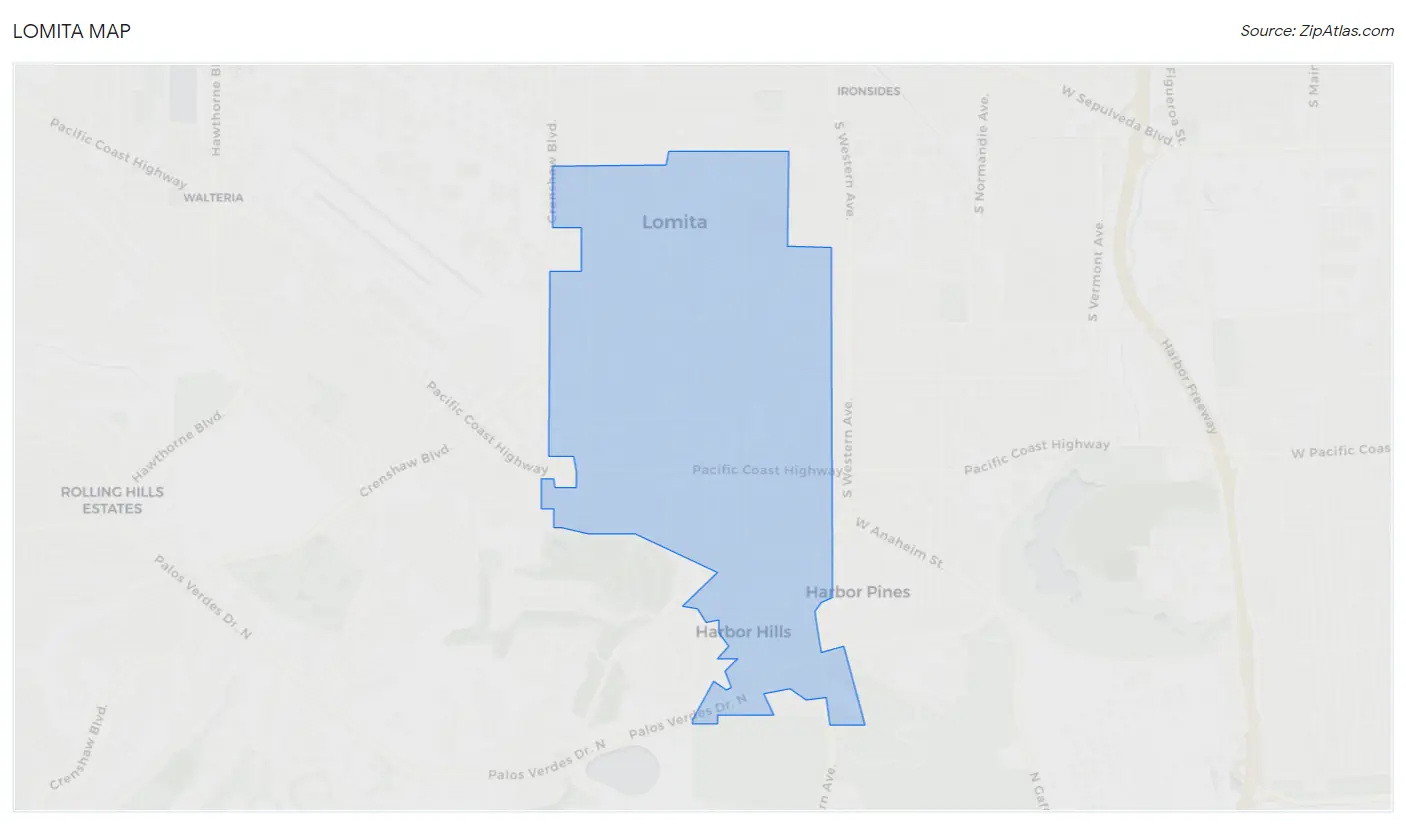
Lomita Map
Lomita Overview
$46,488
PER CAPITA INCOME
$116,077
AVG FAMILY INCOME
$87,717
AVG HOUSEHOLD INCOME
21.6%
WAGE / INCOME GAP [ % ]
78.4¢/ $1
WAGE / INCOME GAP [ $ ]
$9,431
FAMILY INCOME DEFICIT
0.47
INEQUALITY / GINI INDEX
20,662
TOTAL POPULATION
10,143
MALE POPULATION
10,519
FEMALE POPULATION
96.43
MALES / 100 FEMALES
103.71
FEMALES / 100 MALES
40.5
MEDIAN AGE
3.2
AVG FAMILY SIZE
2.6
AVG HOUSEHOLD SIZE
11,487
LABOR FORCE [ PEOPLE ]
67.2%
PERCENT IN LABOR FORCE
3.4%
UNEMPLOYMENT RATE
Lomita Zip Codes
Income in Lomita
Income Overview in Lomita
Per Capita Income in Lomita is $46,488, while median incomes of families and households are $116,077 and $87,717 respectively.
| Characteristic | Number | Measure |
| Per Capita Income | 20,662 | $46,488 |
| Median Family Income | 5,220 | $116,077 |
| Mean Family Income | 5,220 | $134,843 |
| Median Household Income | 7,890 | $87,717 |
| Mean Household Income | 7,890 | $119,435 |
| Income Deficit | 5,220 | $9,431 |
| Wage / Income Gap (%) | 20,662 | 21.57% |
| Wage / Income Gap ($) | 20,662 | 78.43¢ per $1 |
| Gini / Inequality Index | 20,662 | 0.47 |
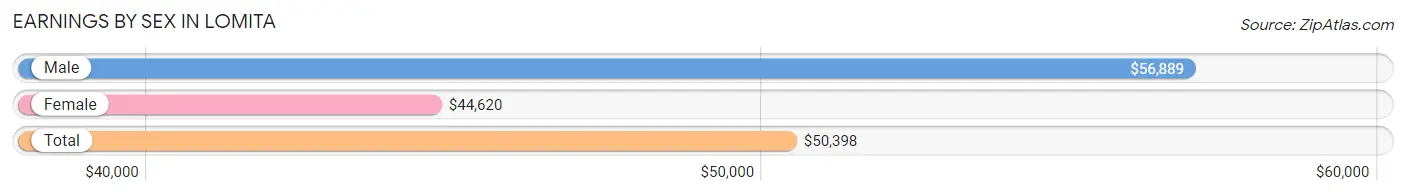
Earnings by Sex in Lomita
Average Earnings in Lomita are $50,398, $56,889 for men and $44,620 for women, a difference of 21.6%.
| Sex | Number | Average Earnings |
| Male | 5,959 (51.0%) | $56,889 |
| Female | 5,733 (49.0%) | $44,620 |
| Total | 11,692 (100.0%) | $50,398 |
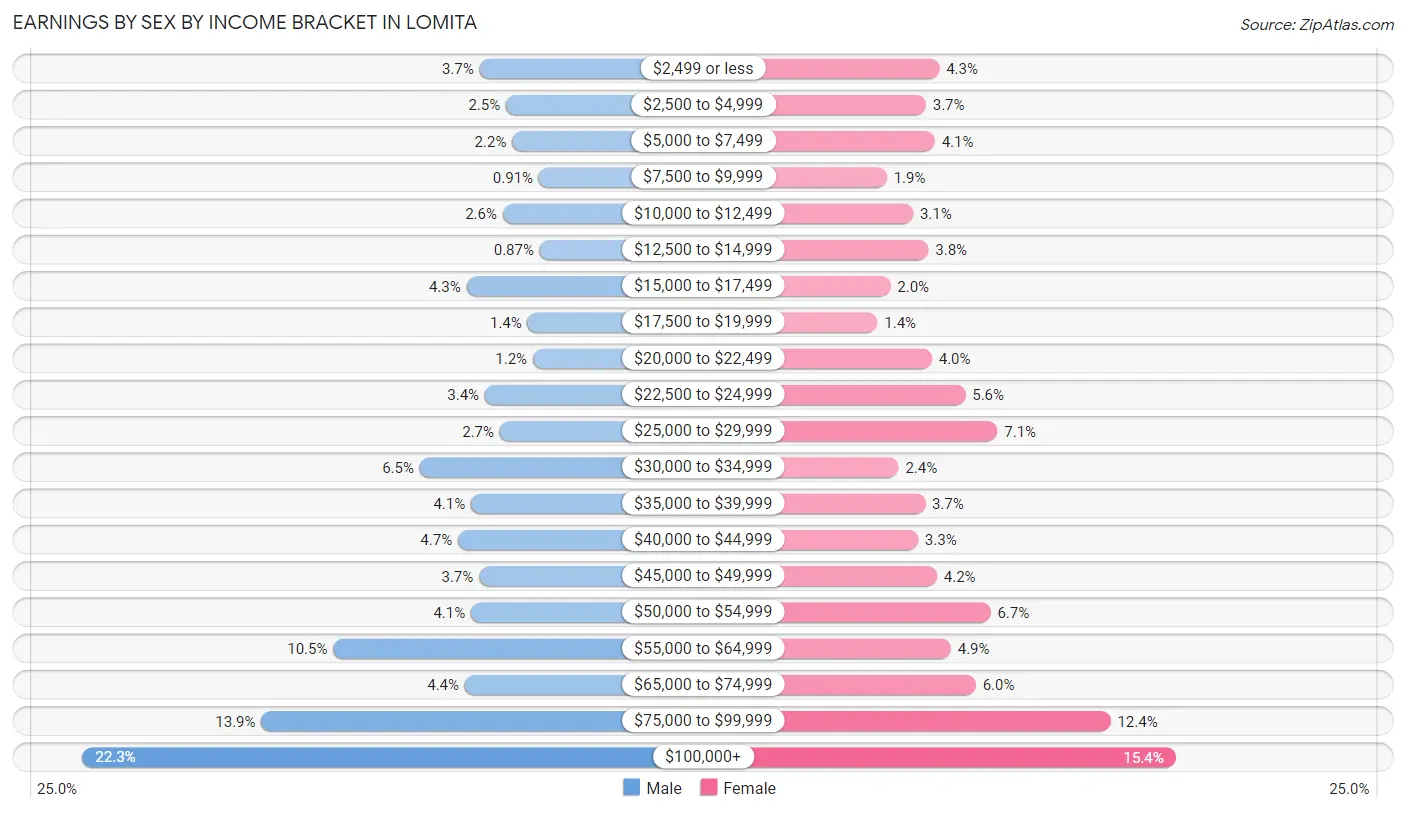
Earnings by Sex by Income Bracket in Lomita
The most common earnings brackets in Lomita are $100,000+ for men (1,328 | 22.3%) and $100,000+ for women (883 | 15.4%).
| Income | Male | Female |
| $2,499 or less | 220 (3.7%) | 248 (4.3%) |
| $2,500 to $4,999 | 146 (2.5%) | 212 (3.7%) |
| $5,000 to $7,499 | 129 (2.2%) | 236 (4.1%) |
| $7,500 to $9,999 | 54 (0.9%) | 107 (1.9%) |
| $10,000 to $12,499 | 155 (2.6%) | 178 (3.1%) |
| $12,500 to $14,999 | 52 (0.9%) | 219 (3.8%) |
| $15,000 to $17,499 | 256 (4.3%) | 117 (2.0%) |
| $17,500 to $19,999 | 86 (1.4%) | 82 (1.4%) |
| $20,000 to $22,499 | 71 (1.2%) | 228 (4.0%) |
| $22,500 to $24,999 | 205 (3.4%) | 318 (5.6%) |
| $25,000 to $29,999 | 163 (2.7%) | 404 (7.0%) |
| $30,000 to $34,999 | 387 (6.5%) | 139 (2.4%) |
| $35,000 to $39,999 | 244 (4.1%) | 210 (3.7%) |
| $40,000 to $44,999 | 280 (4.7%) | 191 (3.3%) |
| $45,000 to $49,999 | 221 (3.7%) | 242 (4.2%) |
| $50,000 to $54,999 | 244 (4.1%) | 386 (6.7%) |
| $55,000 to $64,999 | 628 (10.5%) | 279 (4.9%) |
| $65,000 to $74,999 | 261 (4.4%) | 346 (6.0%) |
| $75,000 to $99,999 | 829 (13.9%) | 708 (12.3%) |
| $100,000+ | 1,328 (22.3%) | 883 (15.4%) |
| Total | 5,959 (100.0%) | 5,733 (100.0%) |
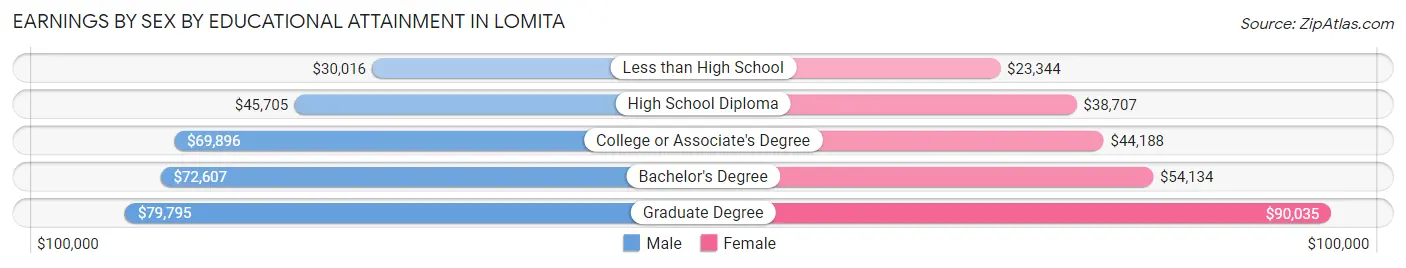
Earnings by Sex by Educational Attainment in Lomita
Average earnings in Lomita are $58,550 for men and $50,297 for women, a difference of 14.1%. Men with an educational attainment of graduate degree enjoy the highest average annual earnings of $79,795, while those with less than high school education earn the least with $30,016. Women with an educational attainment of graduate degree earn the most with the average annual earnings of $90,035, while those with less than high school education have the smallest earnings of $23,344.
| Educational Attainment | Male Income | Female Income |
| Less than High School | $30,016 | $23,344 |
| High School Diploma | $45,705 | $38,707 |
| College or Associate's Degree | $69,896 | $44,188 |
| Bachelor's Degree | $72,607 | $54,134 |
| Graduate Degree | $79,795 | $90,035 |
| Total | $58,550 | $50,297 |
Family Income in Lomita
Family Income Brackets in Lomita
According to the Lomita family income data, there are 1,086 families falling into the $200,000+ income range, which is the most common income bracket and makes up 20.8% of all families. Conversely, the less than $10,000 income bracket is the least frequent group with only 63 families (1.2%) belonging to this category.
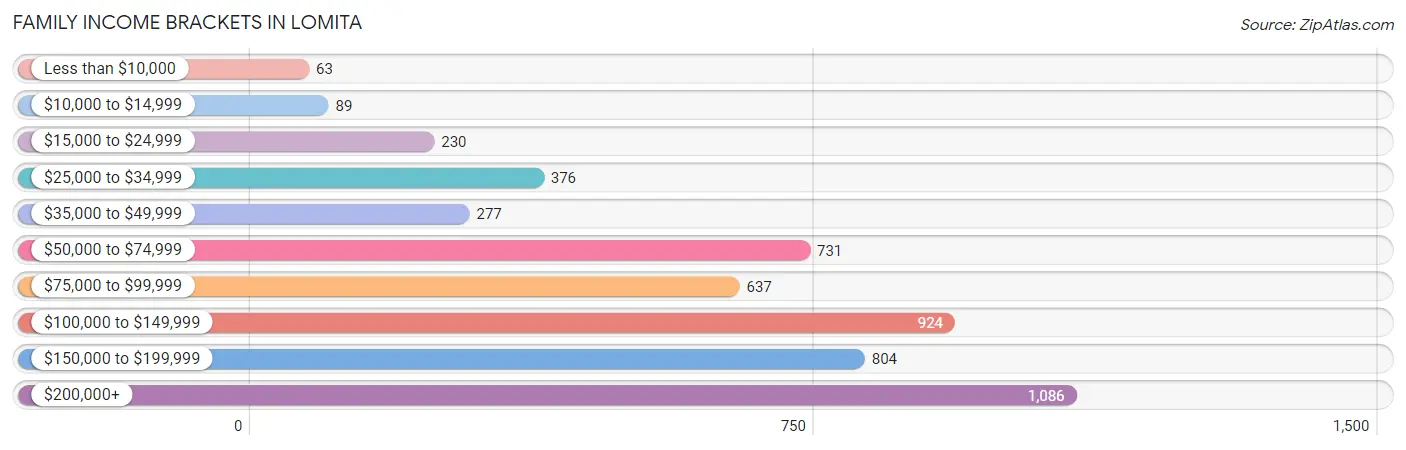
| Income Bracket | # Families | % Families |
| Less than $10,000 | 63 | 1.2% |
| $10,000 to $14,999 | 89 | 1.7% |
| $15,000 to $24,999 | 230 | 4.4% |
| $25,000 to $34,999 | 376 | 7.2% |
| $35,000 to $49,999 | 277 | 5.3% |
| $50,000 to $74,999 | 731 | 14.0% |
| $75,000 to $99,999 | 637 | 12.2% |
| $100,000 to $149,999 | 924 | 17.7% |
| $150,000 to $199,999 | 804 | 15.4% |
| $200,000+ | 1,086 | 20.8% |
Family Income by Famaliy Size in Lomita
7+ person families (40 | 0.8%) account for the highest median family income in Lomita with $219,412 per family, while 3-person families (1,216 | 23.3%) have the highest median income of $50,521 per family member.
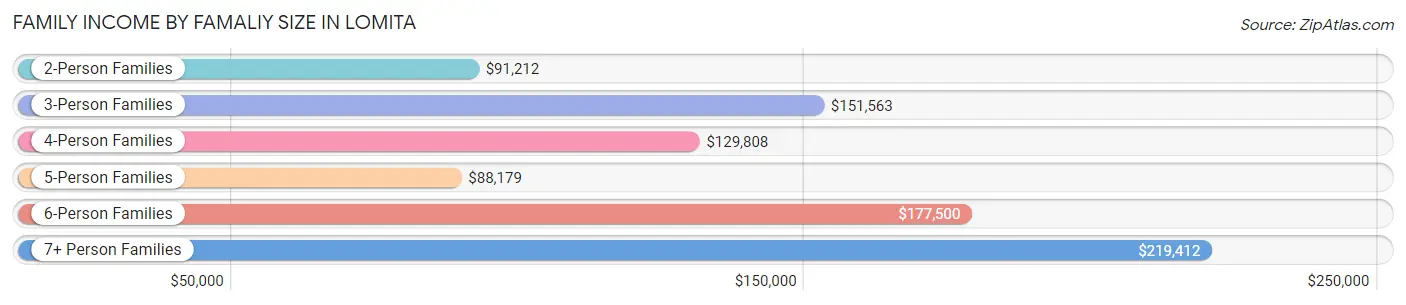
| Income Bracket | # Families | Median Income |
| 2-Person Families | 2,345 (44.9%) | $91,212 |
| 3-Person Families | 1,216 (23.3%) | $151,563 |
| 4-Person Families | 1,074 (20.6%) | $129,808 |
| 5-Person Families | 485 (9.3%) | $88,179 |
| 6-Person Families | 60 (1.1%) | $177,500 |
| 7+ Person Families | 40 (0.8%) | $219,412 |
| Total | 5,220 (100.0%) | $116,077 |
Family Income by Number of Earners in Lomita
The median family income in Lomita is $116,077, with families comprising 3+ earners (611) having the highest median family income of $194,493, while families with no earners (487) have the lowest median family income of $60,625, accounting for 11.7% and 9.3% of families, respectively.
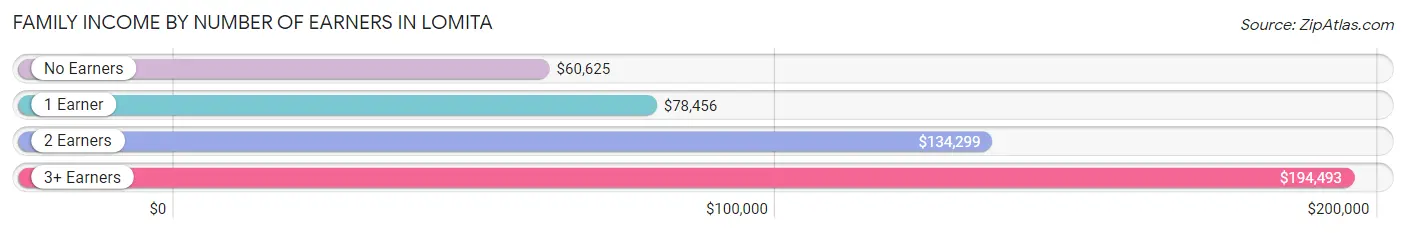
| Number of Earners | # Families | Median Income |
| No Earners | 487 (9.3%) | $60,625 |
| 1 Earner | 1,612 (30.9%) | $78,456 |
| 2 Earners | 2,510 (48.1%) | $134,299 |
| 3+ Earners | 611 (11.7%) | $194,493 |
| Total | 5,220 (100.0%) | $116,077 |
Household Income in Lomita
Household Income Brackets in Lomita
With 1,310 households falling in the category, the $200,000+ income range is the most frequent in Lomita, accounting for 16.6% of all households. In contrast, only 276 households (3.5%) fall into the $10,000 to $14,999 income bracket, making it the least populous group.
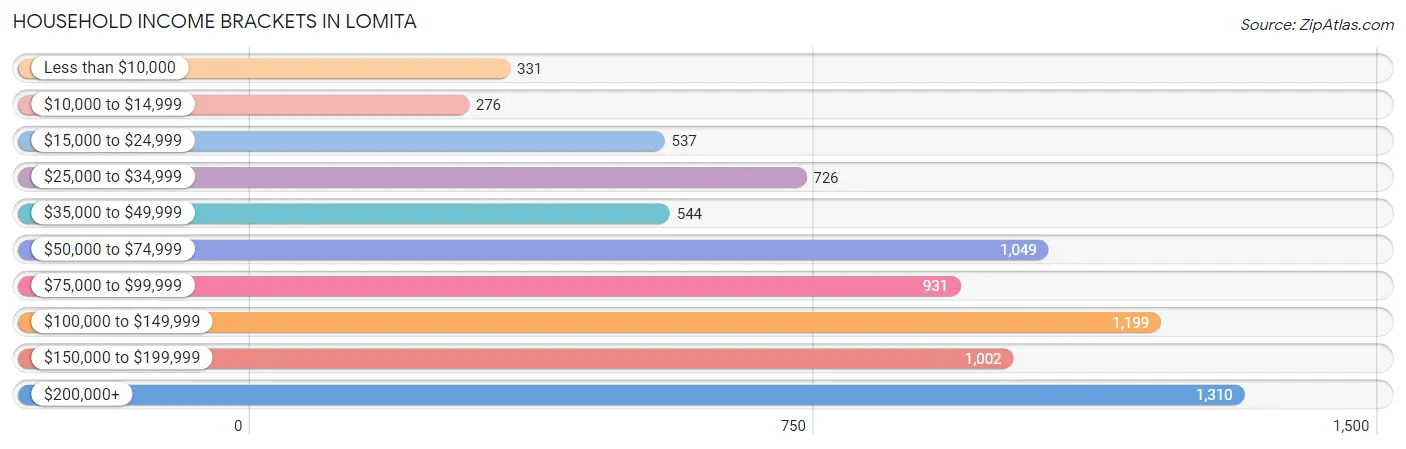
| Income Bracket | # Households | % Households |
| Less than $10,000 | 331 | 4.2% |
| $10,000 to $14,999 | 276 | 3.5% |
| $15,000 to $24,999 | 537 | 6.8% |
| $25,000 to $34,999 | 726 | 9.2% |
| $35,000 to $49,999 | 544 | 6.9% |
| $50,000 to $74,999 | 1,049 | 13.3% |
| $75,000 to $99,999 | 931 | 11.8% |
| $100,000 to $149,999 | 1,199 | 15.2% |
| $150,000 to $199,999 | 1,002 | 12.7% |
| $200,000+ | 1,310 | 16.6% |
Household Income by Householder Age in Lomita
The median household income in Lomita is $87,717, with the highest median household income of $122,317 found in the 45 to 64 years age bracket for the primary householder. A total of 3,102 households (39.3%) fall into this category. Meanwhile, the 15 to 24 years age bracket for the primary householder has the lowest median household income of $0, with 255 households (3.2%) in this group.
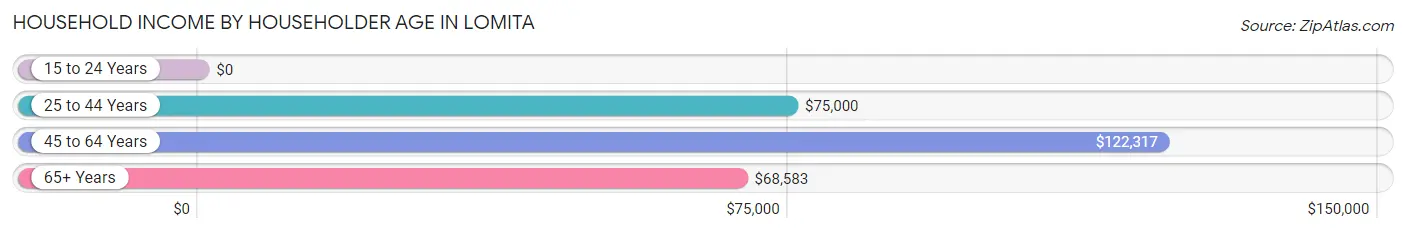
| Income Bracket | # Households | Median Income |
| 15 to 24 Years | 255 (3.2%) | $0 |
| 25 to 44 Years | 2,428 (30.8%) | $75,000 |
| 45 to 64 Years | 3,102 (39.3%) | $122,317 |
| 65+ Years | 2,105 (26.7%) | $68,583 |
| Total | 7,890 (100.0%) | $87,717 |
Poverty in Lomita
Income Below Poverty by Sex and Age in Lomita
With 9.4% poverty level for males and 14.7% for females among the residents of Lomita, 5 year old males and 15 year old females are the most vulnerable to poverty, with 55 males (30.2%) and 42 females (77.8%) in their respective age groups living below the poverty level.
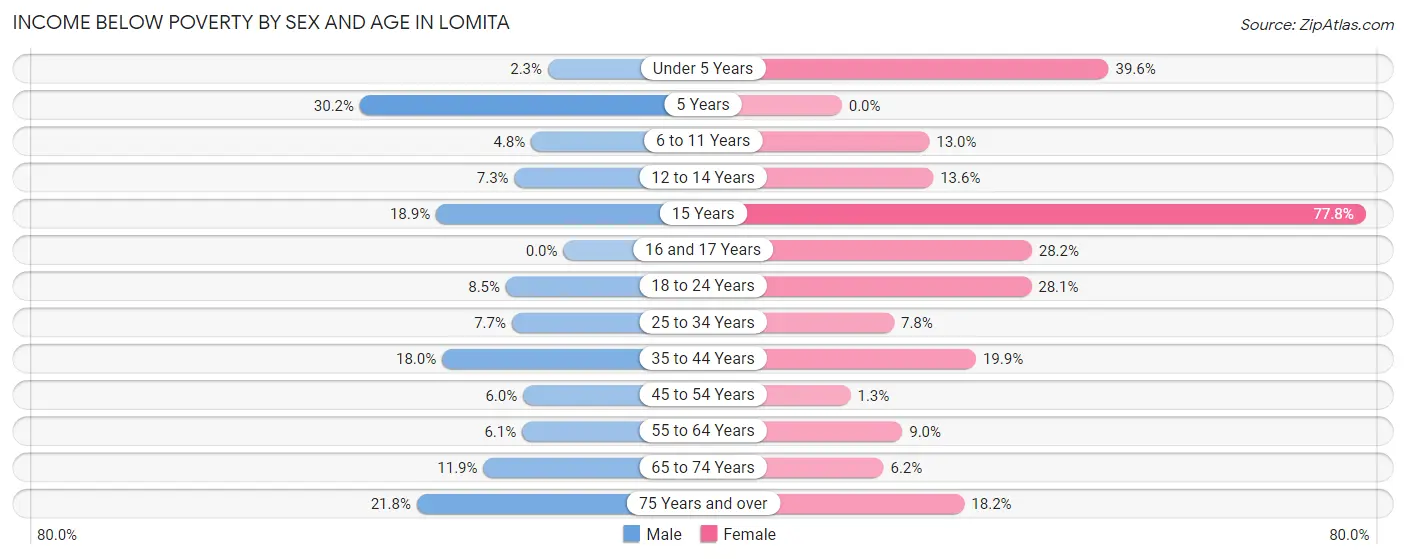
| Age Bracket | Male | Female |
| Under 5 Years | 13 (2.3%) | 305 (39.6%) |
| 5 Years | 55 (30.2%) | 0 (0.0%) |
| 6 to 11 Years | 33 (4.8%) | 69 (13.0%) |
| 12 to 14 Years | 18 (7.3%) | 33 (13.6%) |
| 15 Years | 38 (18.9%) | 42 (77.8%) |
| 16 and 17 Years | 0 (0.0%) | 99 (28.2%) |
| 18 to 24 Years | 67 (8.5%) | 240 (28.1%) |
| 25 to 34 Years | 118 (7.6%) | 119 (7.8%) |
| 35 to 44 Years | 181 (18.0%) | 293 (19.9%) |
| 45 to 54 Years | 76 (6.0%) | 15 (1.3%) |
| 55 to 64 Years | 103 (6.1%) | 127 (9.0%) |
| 65 to 74 Years | 143 (11.9%) | 90 (6.2%) |
| 75 Years and over | 106 (21.8%) | 100 (18.2%) |
| Total | 951 (9.4%) | 1,532 (14.7%) |
Income Above Poverty by Sex and Age in Lomita
According to the poverty statistics in Lomita, males aged 16 and 17 years and females aged 5 years are the age groups that are most secure financially, with 100.0% of males and 100.0% of females in these age groups living above the poverty line.
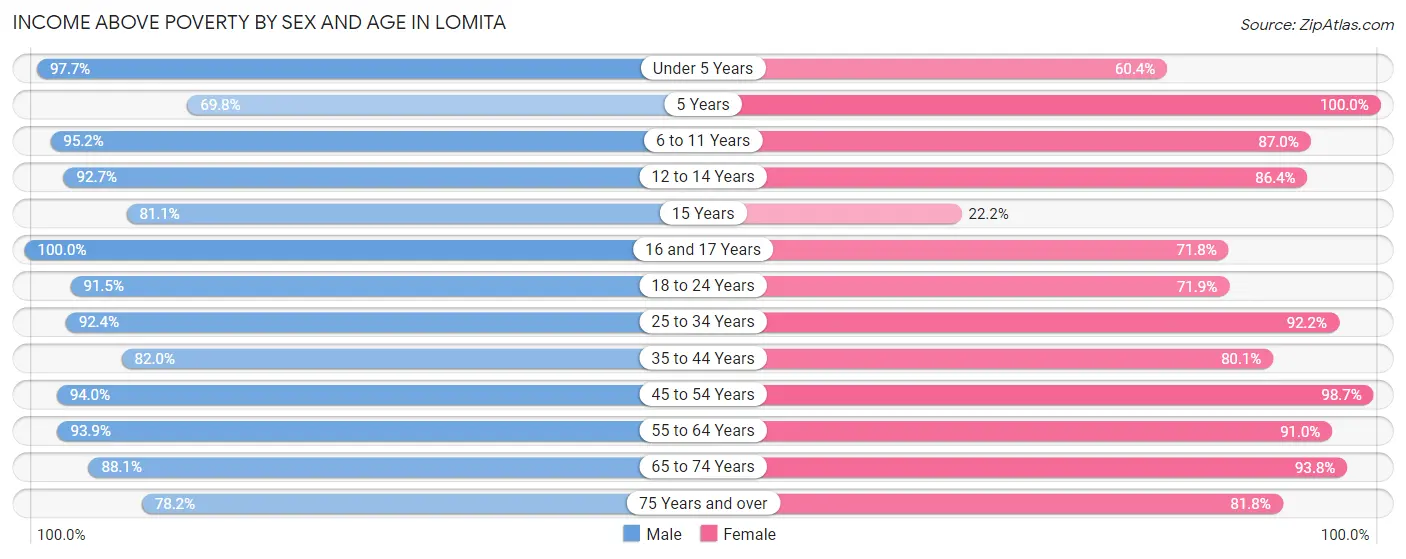
| Age Bracket | Male | Female |
| Under 5 Years | 551 (97.7%) | 465 (60.4%) |
| 5 Years | 127 (69.8%) | 21 (100.0%) |
| 6 to 11 Years | 656 (95.2%) | 462 (87.0%) |
| 12 to 14 Years | 230 (92.7%) | 210 (86.4%) |
| 15 Years | 163 (81.1%) | 12 (22.2%) |
| 16 and 17 Years | 239 (100.0%) | 252 (71.8%) |
| 18 to 24 Years | 718 (91.5%) | 613 (71.9%) |
| 25 to 34 Years | 1,425 (92.3%) | 1,414 (92.2%) |
| 35 to 44 Years | 824 (82.0%) | 1,177 (80.1%) |
| 45 to 54 Years | 1,195 (94.0%) | 1,135 (98.7%) |
| 55 to 64 Years | 1,576 (93.9%) | 1,287 (91.0%) |
| 65 to 74 Years | 1,061 (88.1%) | 1,362 (93.8%) |
| 75 Years and over | 381 (78.2%) | 449 (81.8%) |
| Total | 9,146 (90.6%) | 8,859 (85.3%) |
Income Below Poverty Among Married-Couple Families in Lomita
The poverty statistics for married-couple families in Lomita show that 4.8% or 176 of the total 3,707 families live below the poverty line. Families with 1 or 2 children have the highest poverty rate of 10.1%, comprising of 109 families. On the other hand, families with 3 or 4 children have the lowest poverty rate of 0.0%, which includes 0 families.
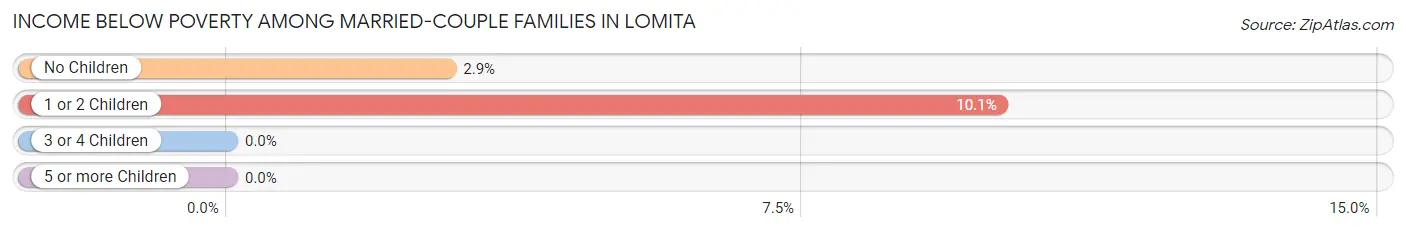
| Children | Above Poverty | Below Poverty |
| No Children | 2,281 (97.2%) | 67 (2.9%) |
| 1 or 2 Children | 974 (89.9%) | 109 (10.1%) |
| 3 or 4 Children | 276 (100.0%) | 0 (0.0%) |
| 5 or more Children | 0 (0.0%) | 0 (0.0%) |
| Total | 3,531 (95.3%) | 176 (4.8%) |
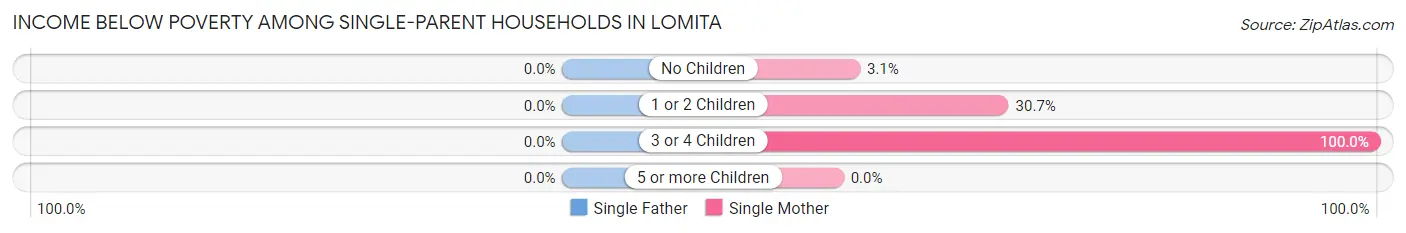
Income Below Poverty Among Single-Parent Households in Lomita
| Children | Single Father | Single Mother |
| No Children | 0 (0.0%) | 19 (3.0%) |
| 1 or 2 Children | 0 (0.0%) | 161 (30.7%) |
| 3 or 4 Children | 0 (0.0%) | 30 (100.0%) |
| 5 or more Children | 0 (0.0%) | 0 (0.0%) |
| Total | 0 (0.0%) | 210 (17.8%) |
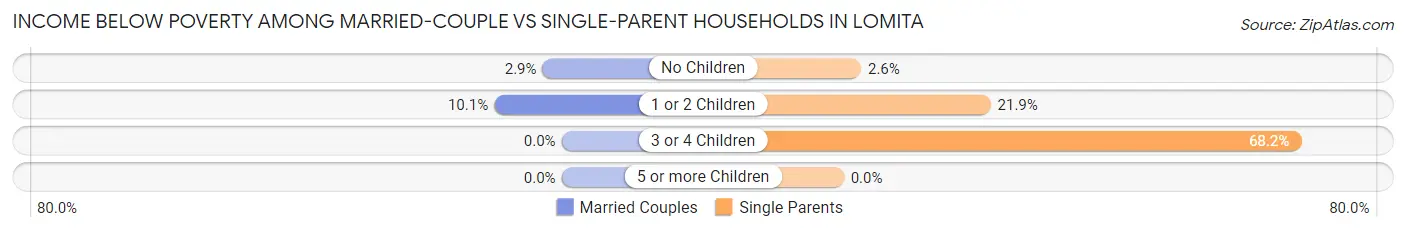
Income Below Poverty Among Married-Couple vs Single-Parent Households in Lomita
The poverty data for Lomita shows that 176 of the married-couple family households (4.8%) and 210 of the single-parent households (13.9%) are living below the poverty level. Within the married-couple family households, those with 1 or 2 children have the highest poverty rate, with 109 households (10.1%) falling below the poverty line. Among the single-parent households, those with 3 or 4 children have the highest poverty rate, with 30 household (68.2%) living below poverty.
| Children | Married-Couple Families | Single-Parent Households |
| No Children | 67 (2.9%) | 19 (2.6%) |
| 1 or 2 Children | 109 (10.1%) | 161 (21.9%) |
| 3 or 4 Children | 0 (0.0%) | 30 (68.2%) |
| 5 or more Children | 0 (0.0%) | 0 (0.0%) |
| Total | 176 (4.8%) | 210 (13.9%) |
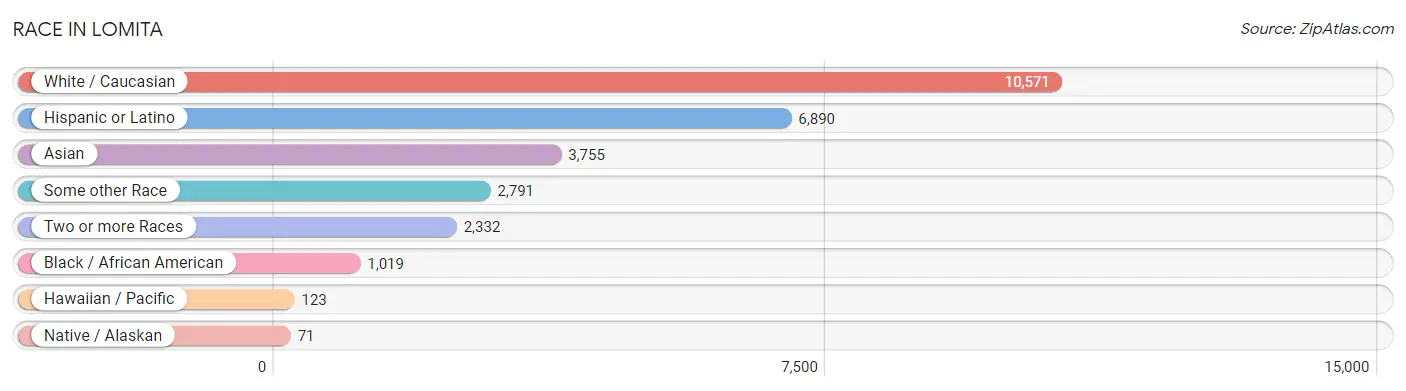
Race in Lomita
The most populous races in Lomita are White / Caucasian (10,571 | 51.2%), Hispanic or Latino (6,890 | 33.4%), and Asian (3,755 | 18.2%).
| Race | # Population | % Population |
| Asian | 3,755 | 18.2% |
| Black / African American | 1,019 | 4.9% |
| Hawaiian / Pacific | 123 | 0.6% |
| Hispanic or Latino | 6,890 | 33.4% |
| Native / Alaskan | 71 | 0.3% |
| White / Caucasian | 10,571 | 51.2% |
| Two or more Races | 2,332 | 11.3% |
| Some other Race | 2,791 | 13.5% |
| Total | 20,662 | 100.0% |
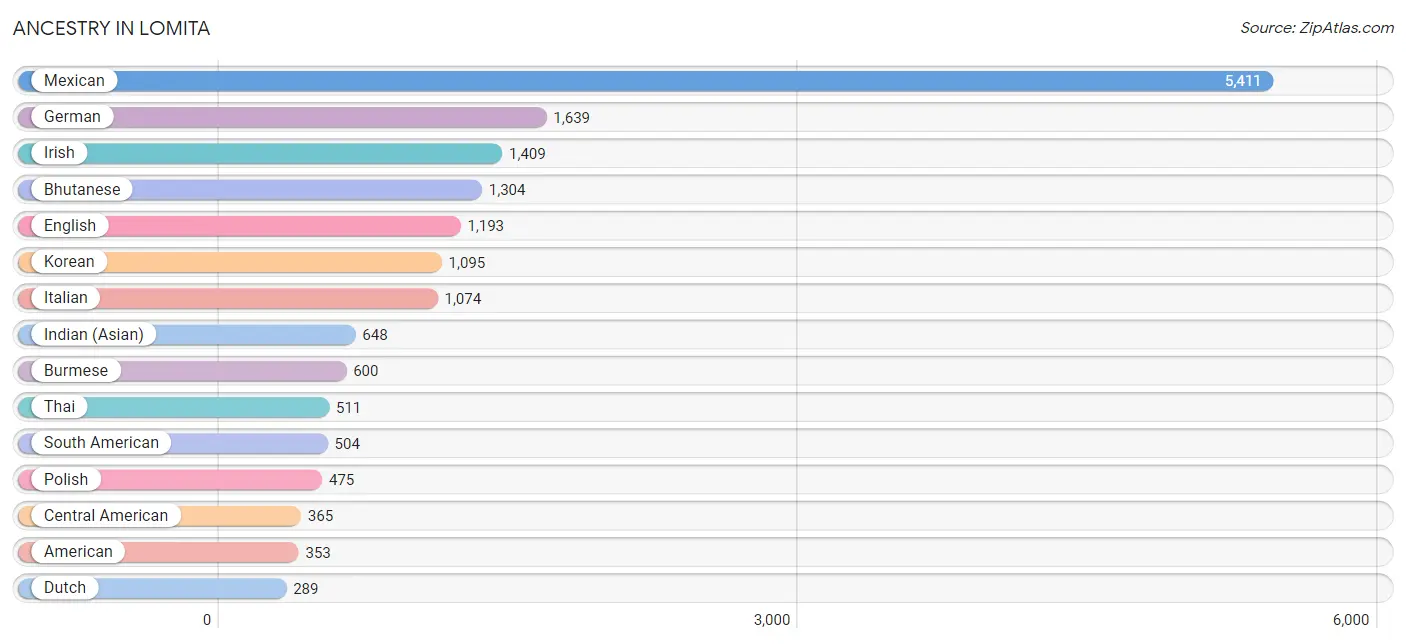
Ancestry in Lomita
The most populous ancestries reported in Lomita are Mexican (5,411 | 26.2%), German (1,639 | 7.9%), Irish (1,409 | 6.8%), Bhutanese (1,304 | 6.3%), and English (1,193 | 5.8%), together accounting for 53.0% of all Lomita residents.
| Ancestry | # Population | % Population |
| Afghan | 74 | 0.4% |
| African | 102 | 0.5% |
| American | 353 | 1.7% |
| Apache | 30 | 0.2% |
| Arab | 79 | 0.4% |
| Argentinean | 42 | 0.2% |
| Armenian | 103 | 0.5% |
| Assyrian / Chaldean / Syriac | 208 | 1.0% |
| Austrian | 32 | 0.2% |
| Belgian | 18 | 0.1% |
| Bhutanese | 1,304 | 6.3% |
| Blackfeet | 24 | 0.1% |
| Brazilian | 49 | 0.2% |
| British | 32 | 0.2% |
| Bulgarian | 11 | 0.1% |
| Burmese | 600 | 2.9% |
| Cambodian | 7 | 0.0% |
| Canadian | 225 | 1.1% |
| Central American | 365 | 1.8% |
| Cherokee | 117 | 0.6% |
| Chilean | 24 | 0.1% |
| Colombian | 113 | 0.5% |
| Croatian | 104 | 0.5% |
| Cuban | 208 | 1.0% |
| Czech | 63 | 0.3% |
| Czechoslovakian | 14 | 0.1% |
| Danish | 38 | 0.2% |
| Dutch | 289 | 1.4% |
| Ecuadorian | 50 | 0.2% |
| Egyptian | 25 | 0.1% |
| English | 1,193 | 5.8% |
| European | 99 | 0.5% |
| Filipino | 117 | 0.6% |
| Finnish | 30 | 0.2% |
| French | 185 | 0.9% |
| French Canadian | 69 | 0.3% |
| German | 1,639 | 7.9% |
| Greek | 61 | 0.3% |
| Guatemalan | 149 | 0.7% |
| Honduran | 31 | 0.2% |
| Hungarian | 44 | 0.2% |
| Indian (Asian) | 648 | 3.1% |
| Iranian | 55 | 0.3% |
| Iraqi | 4 | 0.0% |
| Irish | 1,409 | 6.8% |
| Israeli | 9 | 0.0% |
| Italian | 1,074 | 5.2% |
| Japanese | 41 | 0.2% |
| Korean | 1,095 | 5.3% |
| Laotian | 6 | 0.0% |
| Latvian | 8 | 0.0% |
| Lebanese | 2 | 0.0% |
| Lithuanian | 16 | 0.1% |
| Mexican | 5,411 | 26.2% |
| Mexican American Indian | 55 | 0.3% |
| Moroccan | 25 | 0.1% |
| Native Hawaiian | 158 | 0.8% |
| Navajo | 3 | 0.0% |
| Nigerian | 34 | 0.2% |
| Northern European | 66 | 0.3% |
| Norwegian | 195 | 0.9% |
| Paiute | 13 | 0.1% |
| Peruvian | 145 | 0.7% |
| Polish | 475 | 2.3% |
| Portuguese | 3 | 0.0% |
| Potawatomi | 6 | 0.0% |
| Puerto Rican | 146 | 0.7% |
| Romanian | 40 | 0.2% |
| Russian | 122 | 0.6% |
| Salvadoran | 185 | 0.9% |
| Samoan | 83 | 0.4% |
| Scotch-Irish | 55 | 0.3% |
| Scottish | 204 | 1.0% |
| Serbian | 18 | 0.1% |
| Shoshone | 37 | 0.2% |
| Slavic | 18 | 0.1% |
| South African | 74 | 0.4% |
| South American | 504 | 2.4% |
| Spaniard | 91 | 0.4% |
| Sri Lankan | 169 | 0.8% |
| Subsaharan African | 210 | 1.0% |
| Swedish | 245 | 1.2% |
| Swiss | 212 | 1.0% |
| Syrian | 5 | 0.0% |
| Thai | 511 | 2.5% |
| Turkish | 48 | 0.2% |
| Ukrainian | 20 | 0.1% |
| Uruguayan | 116 | 0.6% |
| Vietnamese | 20 | 0.1% |
| Welsh | 73 | 0.4% |
| Yugoslavian | 6 | 0.0% | View All 91 Rows |
Immigrants in Lomita
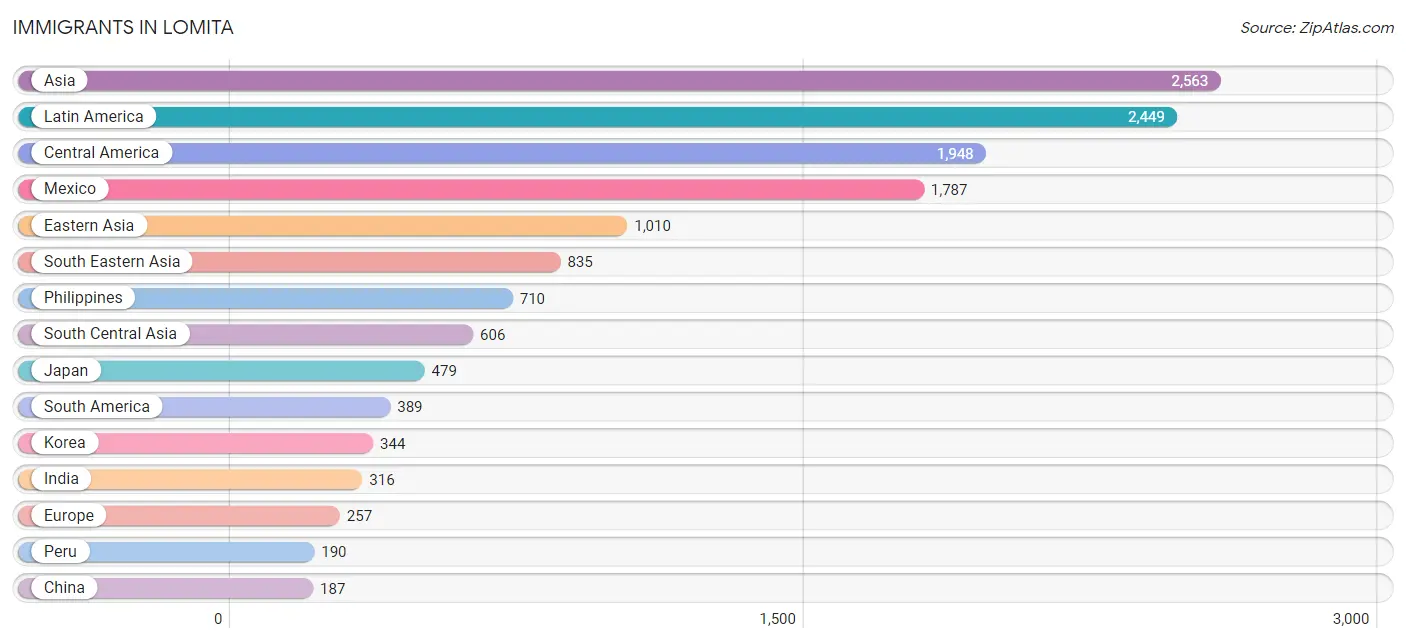
The most numerous immigrant groups reported in Lomita came from Asia (2,563 | 12.4%), Latin America (2,449 | 11.8%), Central America (1,948 | 9.4%), Mexico (1,787 | 8.6%), and Eastern Asia (1,010 | 4.9%), together accounting for 47.2% of all Lomita residents.
| Immigration Origin | # Population | % Population |
| Afghanistan | 83 | 0.4% |
| Africa | 172 | 0.8% |
| Asia | 2,563 | 12.4% |
| Bangladesh | 20 | 0.1% |
| Bosnia and Herzegovina | 6 | 0.0% |
| Brazil | 5 | 0.0% |
| Cambodia | 79 | 0.4% |
| Canada | 168 | 0.8% |
| Caribbean | 112 | 0.5% |
| Central America | 1,948 | 9.4% |
| Chile | 22 | 0.1% |
| China | 187 | 0.9% |
| Colombia | 77 | 0.4% |
| Croatia | 19 | 0.1% |
| Cuba | 94 | 0.4% |
| Czechoslovakia | 12 | 0.1% |
| Eastern Asia | 1,010 | 4.9% |
| Eastern Europe | 115 | 0.6% |
| Ecuador | 50 | 0.2% |
| Egypt | 18 | 0.1% |
| El Salvador | 80 | 0.4% |
| England | 6 | 0.0% |
| Europe | 257 | 1.2% |
| France | 22 | 0.1% |
| Guatemala | 39 | 0.2% |
| Honduras | 42 | 0.2% |
| Hong Kong | 25 | 0.1% |
| India | 316 | 1.5% |
| Iran | 169 | 0.8% |
| Iraq | 4 | 0.0% |
| Israel | 4 | 0.0% |
| Italy | 7 | 0.0% |
| Jamaica | 18 | 0.1% |
| Japan | 479 | 2.3% |
| Korea | 344 | 1.7% |
| Latin America | 2,449 | 11.8% |
| Lebanon | 10 | 0.1% |
| Mexico | 1,787 | 8.6% |
| Moldova | 11 | 0.1% |
| Morocco | 16 | 0.1% |
| Nigeria | 34 | 0.2% |
| Northern Africa | 34 | 0.2% |
| Northern Europe | 98 | 0.5% |
| Norway | 23 | 0.1% |
| Oceania | 31 | 0.2% |
| Peru | 190 | 0.9% |
| Philippines | 710 | 3.4% |
| Poland | 54 | 0.3% |
| Russia | 13 | 0.1% |
| Saudi Arabia | 9 | 0.0% |
| South Africa | 87 | 0.4% |
| South America | 389 | 1.9% |
| South Central Asia | 606 | 2.9% |
| South Eastern Asia | 835 | 4.0% |
| Southern Europe | 22 | 0.1% |
| Spain | 15 | 0.1% |
| Sri Lanka | 18 | 0.1% |
| Sweden | 10 | 0.1% |
| Taiwan | 63 | 0.3% |
| Turkey | 24 | 0.1% |
| Uruguay | 45 | 0.2% |
| Vietnam | 46 | 0.2% |
| Western Africa | 34 | 0.2% |
| Western Asia | 104 | 0.5% |
| Western Europe | 22 | 0.1% | View All 65 Rows |
Sex and Age in Lomita
Sex and Age in Lomita
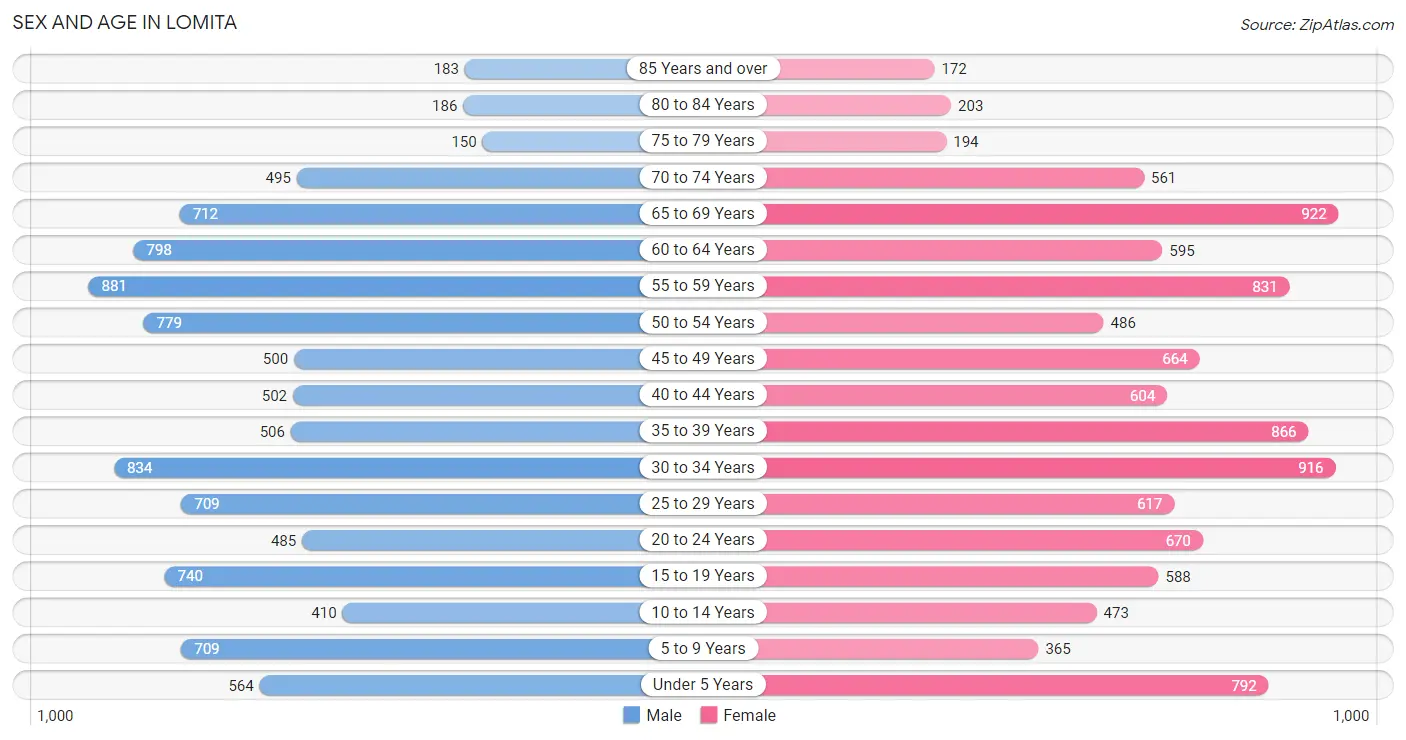
The most populous age groups in Lomita are 55 to 59 Years (881 | 8.7%) for men and 65 to 69 Years (922 | 8.8%) for women.
| Age Bracket | Male | Female |
| Under 5 Years | 564 (5.6%) | 792 (7.5%) |
| 5 to 9 Years | 709 (7.0%) | 365 (3.5%) |
| 10 to 14 Years | 410 (4.0%) | 473 (4.5%) |
| 15 to 19 Years | 740 (7.3%) | 588 (5.6%) |
| 20 to 24 Years | 485 (4.8%) | 670 (6.4%) |
| 25 to 29 Years | 709 (7.0%) | 617 (5.9%) |
| 30 to 34 Years | 834 (8.2%) | 916 (8.7%) |
| 35 to 39 Years | 506 (5.0%) | 866 (8.2%) |
| 40 to 44 Years | 502 (5.0%) | 604 (5.7%) |
| 45 to 49 Years | 500 (4.9%) | 664 (6.3%) |
| 50 to 54 Years | 779 (7.7%) | 486 (4.6%) |
| 55 to 59 Years | 881 (8.7%) | 831 (7.9%) |
| 60 to 64 Years | 798 (7.9%) | 595 (5.7%) |
| 65 to 69 Years | 712 (7.0%) | 922 (8.8%) |
| 70 to 74 Years | 495 (4.9%) | 561 (5.3%) |
| 75 to 79 Years | 150 (1.5%) | 194 (1.8%) |
| 80 to 84 Years | 186 (1.8%) | 203 (1.9%) |
| 85 Years and over | 183 (1.8%) | 172 (1.6%) |
| Total | 10,143 (100.0%) | 10,519 (100.0%) |
Families and Households in Lomita
Median Family Size in Lomita
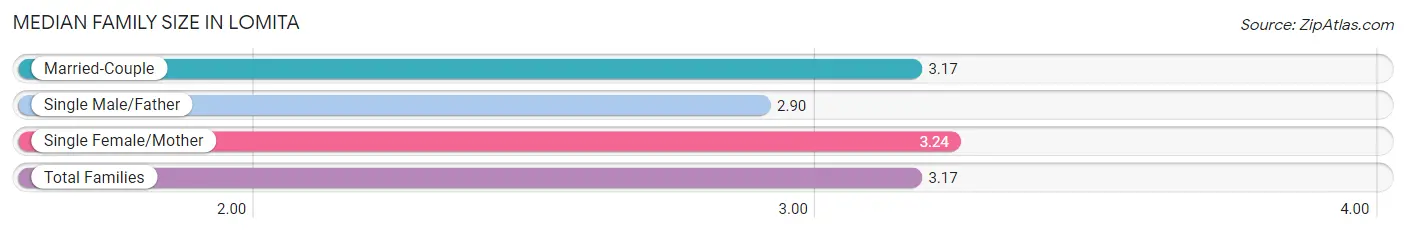
The median family size in Lomita is 3.17 persons per family, with single female/mother families (1,177 | 22.6%) accounting for the largest median family size of 3.24 persons per family. On the other hand, single male/father families (336 | 6.4%) represent the smallest median family size with 2.90 persons per family.
| Family Type | # Families | Family Size |
| Married-Couple | 3,707 (71.0%) | 3.17 |
| Single Male/Father | 336 (6.4%) | 2.90 |
| Single Female/Mother | 1,177 (22.6%) | 3.24 |
| Total Families | 5,220 (100.0%) | 3.17 |
Median Household Size in Lomita
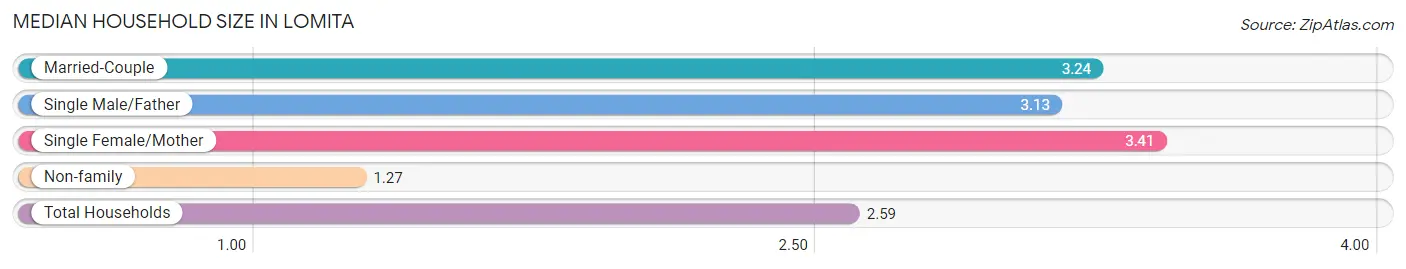
The median household size in Lomita is 2.59 persons per household, with single female/mother households (1,177 | 14.9%) accounting for the largest median household size of 3.41 persons per household. non-family households (2,670 | 33.8%) represent the smallest median household size with 1.27 persons per household.
| Household Type | # Households | Household Size |
| Married-Couple | 3,707 (47.0%) | 3.24 |
| Single Male/Father | 336 (4.3%) | 3.13 |
| Single Female/Mother | 1,177 (14.9%) | 3.41 |
| Non-family | 2,670 (33.8%) | 1.27 |
| Total Households | 7,890 (100.0%) | 2.59 |
Household Size by Marriage Status in Lomita
Out of a total of 7,890 households in Lomita, 5,220 (66.2%) are family households, while 2,670 (33.8%) are nonfamily households. The most numerous type of family households are 2-person households, comprising 2,210, and the most common type of nonfamily households are 1-person households, comprising 2,205.
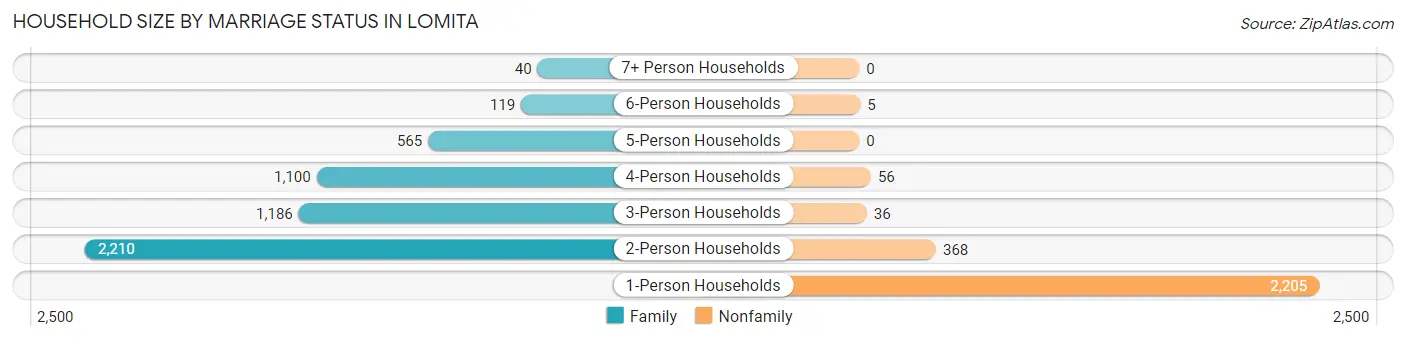
| Household Size | Family Households | Nonfamily Households |
| 1-Person Households | - | 2,205 (28.0%) |
| 2-Person Households | 2,210 (28.0%) | 368 (4.7%) |
| 3-Person Households | 1,186 (15.0%) | 36 (0.5%) |
| 4-Person Households | 1,100 (13.9%) | 56 (0.7%) |
| 5-Person Households | 565 (7.2%) | 0 (0.0%) |
| 6-Person Households | 119 (1.5%) | 5 (0.1%) |
| 7+ Person Households | 40 (0.5%) | 0 (0.0%) |
| Total | 5,220 (66.2%) | 2,670 (33.8%) |
Female Fertility in Lomita
Fertility by Age in Lomita
Average fertility rate in Lomita is 37.0 births per 1,000 women. Women in the age bracket of 20 to 34 years have the highest fertility rate with 74.0 births per 1,000 women. Women in the age bracket of 20 to 34 years acount for 87.2% of all women with births.
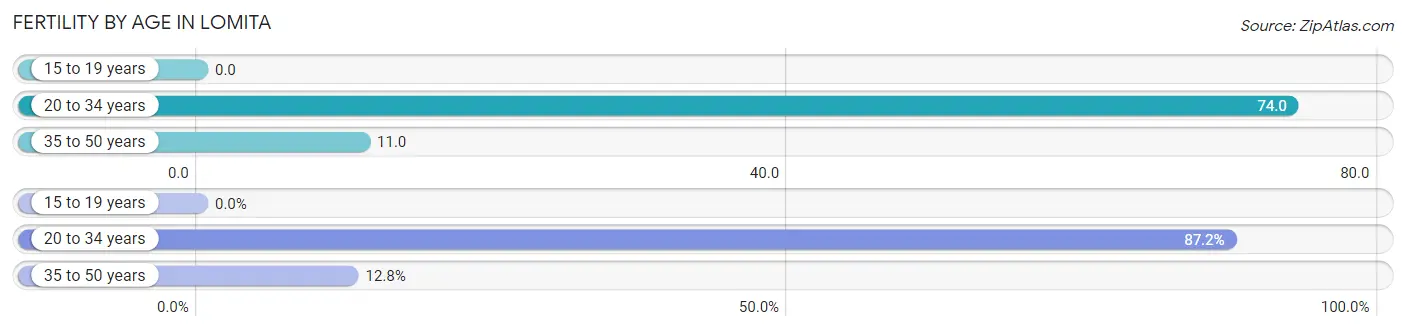
| Age Bracket | Women with Births | Births / 1,000 Women |
| 15 to 19 years | 0 (0.0%) | 0.0 |
| 20 to 34 years | 164 (87.2%) | 74.0 |
| 35 to 50 years | 24 (12.8%) | 11.0 |
| Total | 188 (100.0%) | 37.0 |
Fertility by Age by Marriage Status in Lomita
91.5% of women with births (188) in Lomita are married. The highest percentage of unmarried women with births falls into 20 to 34 years age bracket with 9.8% of them unmarried at the time of birth, while the lowest percentage of unmarried women with births belong to 35 to 50 years age bracket with 0.0% of them unmarried.
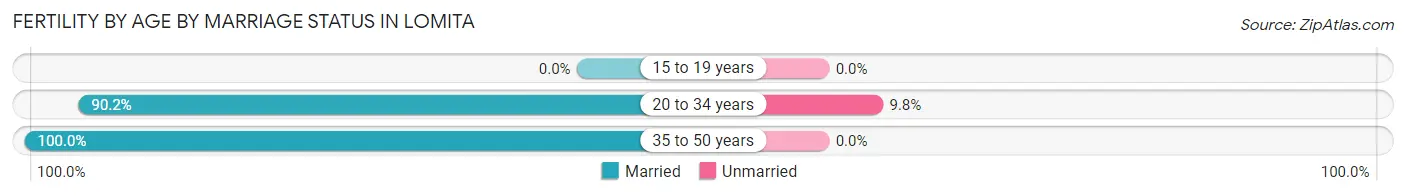
| Age Bracket | Married | Unmarried |
| 15 to 19 years | 0 (0.0%) | 0 (0.0%) |
| 20 to 34 years | 148 (90.2%) | 16 (9.8%) |
| 35 to 50 years | 24 (100.0%) | 0 (0.0%) |
| Total | 172 (91.5%) | 16 (8.5%) |
Fertility by Education in Lomita
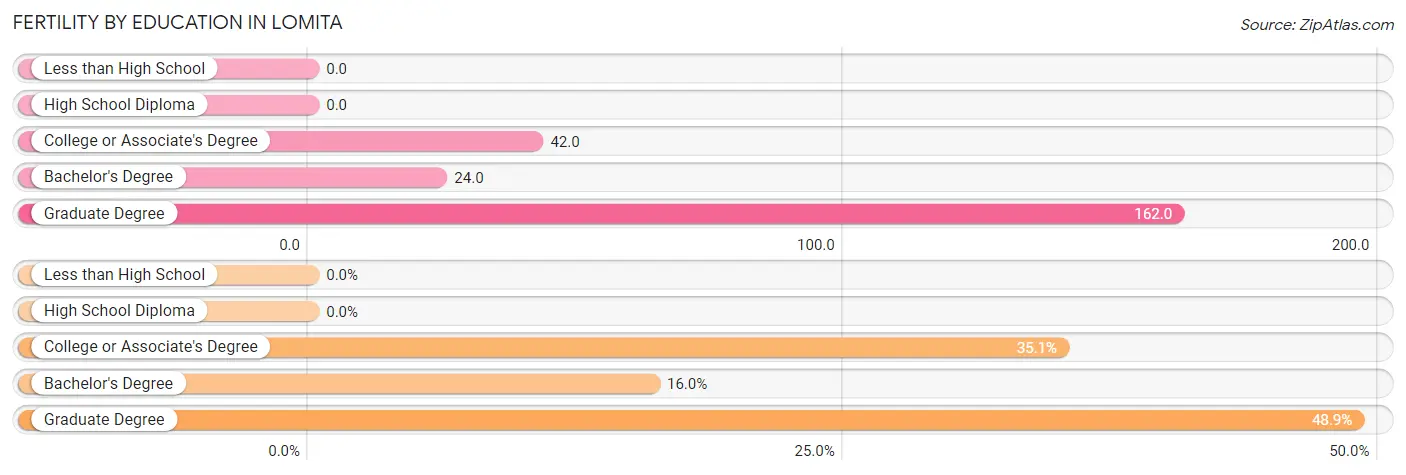
| Educational Attainment | Women with Births | Births / 1,000 Women |
| Less than High School | 0 (0.0%) | 0.0 |
| High School Diploma | 0 (0.0%) | 0.0 |
| College or Associate's Degree | 66 (35.1%) | 42.0 |
| Bachelor's Degree | 30 (16.0%) | 24.0 |
| Graduate Degree | 92 (48.9%) | 162.0 |
| Total | 188 (100.0%) | 37.0 |
Fertility by Education by Marriage Status in Lomita
8.5% of women with births in Lomita are unmarried. Women with the educational attainment of bachelor's degree are most likely to be married with 100.0% of them married at childbirth, while women with the educational attainment of college or associate's degree are least likely to be married with 24.2% of them unmarried at childbirth.
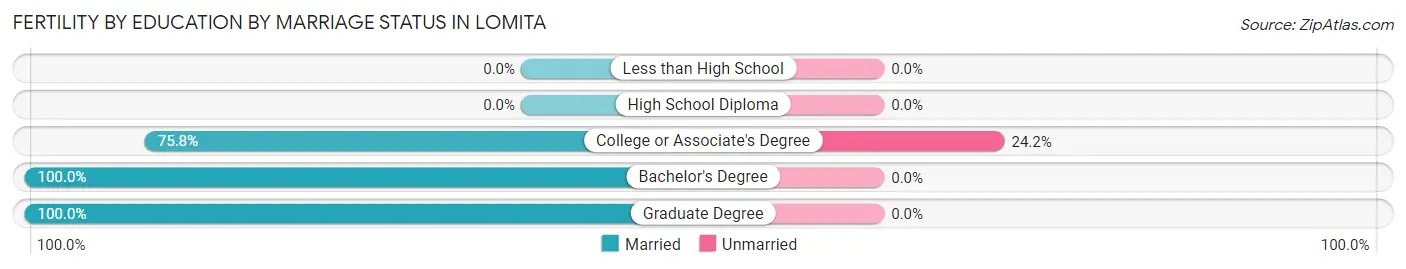
| Educational Attainment | Married | Unmarried |
| Less than High School | 0 (0.0%) | 0 (0.0%) |
| High School Diploma | 0 (0.0%) | 0 (0.0%) |
| College or Associate's Degree | 50 (75.8%) | 16 (24.2%) |
| Bachelor's Degree | 30 (100.0%) | 0 (0.0%) |
| Graduate Degree | 92 (100.0%) | 0 (0.0%) |
| Total | 172 (91.5%) | 16 (8.5%) |
Employment Characteristics in Lomita
Employment by Class of Employer in Lomita
Among the 10,599 employed individuals in Lomita, private company employees (6,712 | 63.3%), local government employees (1,073 | 10.1%), and self-employed (not incorporated) (1,058 | 10.0%) make up the most common classes of employment.
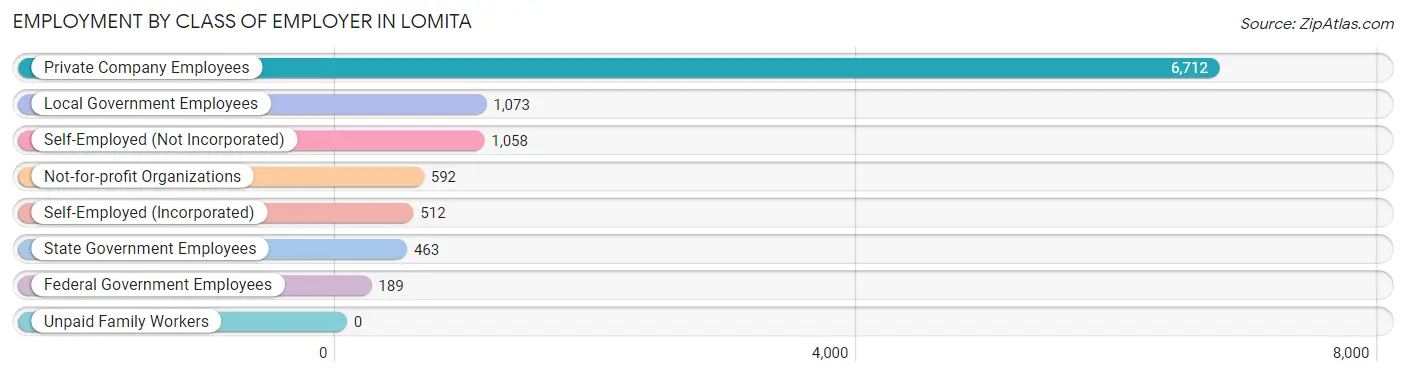
| Employer Class | # Employees | % Employees |
| Private Company Employees | 6,712 | 63.3% |
| Self-Employed (Incorporated) | 512 | 4.8% |
| Self-Employed (Not Incorporated) | 1,058 | 10.0% |
| Not-for-profit Organizations | 592 | 5.6% |
| Local Government Employees | 1,073 | 10.1% |
| State Government Employees | 463 | 4.4% |
| Federal Government Employees | 189 | 1.8% |
| Unpaid Family Workers | 0 | 0.0% |
| Total | 10,599 | 100.0% |
Employment Status by Age in Lomita
According to the labor force statistics for Lomita, out of the total population over 16 years of age (17,094), 67.2% or 11,487 individuals are in the labor force, with 3.4% or 391 of them unemployed. The age group with the highest labor force participation rate is 45 to 54 years, with 92.6% or 2,249 individuals in the labor force. Within the labor force, the 16 to 19 years age range has the highest percentage of unemployed individuals, with 19.5% or 44 of them being unemployed.
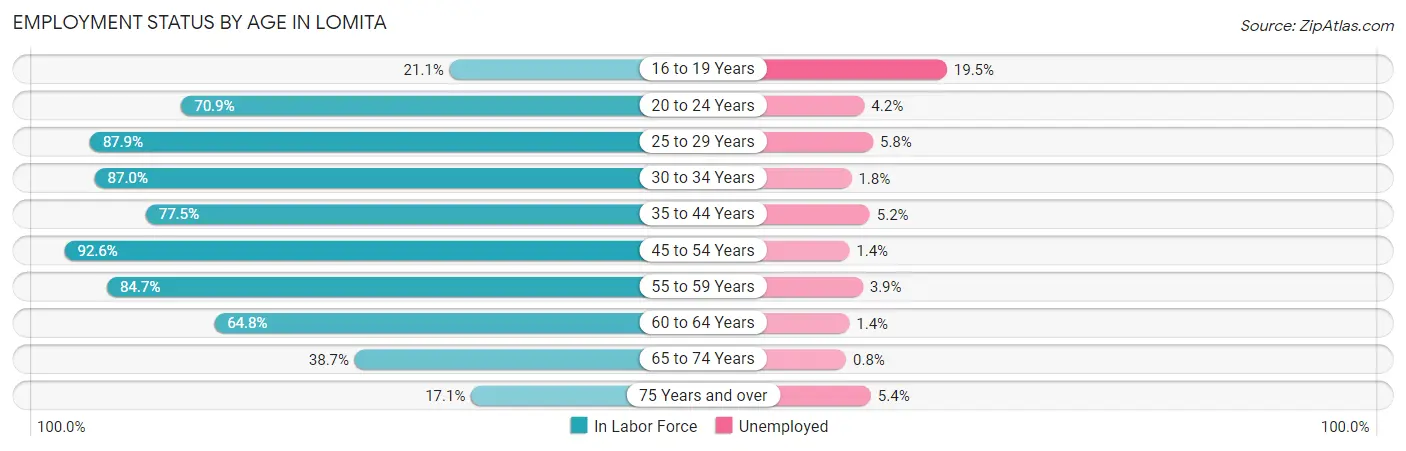
| Age Bracket | In Labor Force | Unemployed |
| 16 to 19 Years | 226 (21.1%) | 44 (19.5%) |
| 20 to 24 Years | 819 (70.9%) | 34 (4.2%) |
| 25 to 29 Years | 1,166 (87.9%) | 68 (5.8%) |
| 30 to 34 Years | 1,522 (87.0%) | 27 (1.8%) |
| 35 to 44 Years | 1,920 (77.5%) | 100 (5.2%) |
| 45 to 54 Years | 2,249 (92.6%) | 31 (1.4%) |
| 55 to 59 Years | 1,450 (84.7%) | 57 (3.9%) |
| 60 to 64 Years | 903 (64.8%) | 13 (1.4%) |
| 65 to 74 Years | 1,041 (38.7%) | 8 (0.8%) |
| 75 Years and over | 186 (17.1%) | 10 (5.4%) |
| Total | 11,487 (67.2%) | 391 (3.4%) |
Employment Status by Educational Attainment in Lomita
According to labor force statistics for Lomita, 83.1% of individuals (9,214) out of the total population between 25 and 64 years of age (11,088) are in the labor force, with 3.2% or 295 of them being unemployed. The group with the highest labor force participation rate are those with the educational attainment of college / associate degree, with 88.8% or 2,784 individuals in the labor force. Within the labor force, individuals with college / associate degree education have the highest percentage of unemployment, with 6.8% or 189 of them being unemployed.
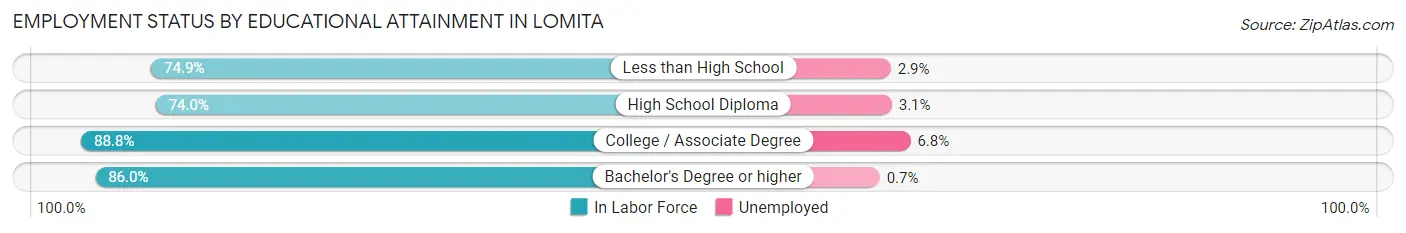
| Educational Attainment | In Labor Force | Unemployed |
| Less than High School | 930 (74.9%) | 36 (2.9%) |
| High School Diploma | 1,712 (74.0%) | 72 (3.1%) |
| College / Associate Degree | 2,784 (88.8%) | 213 (6.8%) |
| Bachelor's Degree or higher | 3,783 (86.0%) | 31 (0.7%) |
| Total | 9,214 (83.1%) | 355 (3.2%) |
Employment Occupations by Sex in Lomita
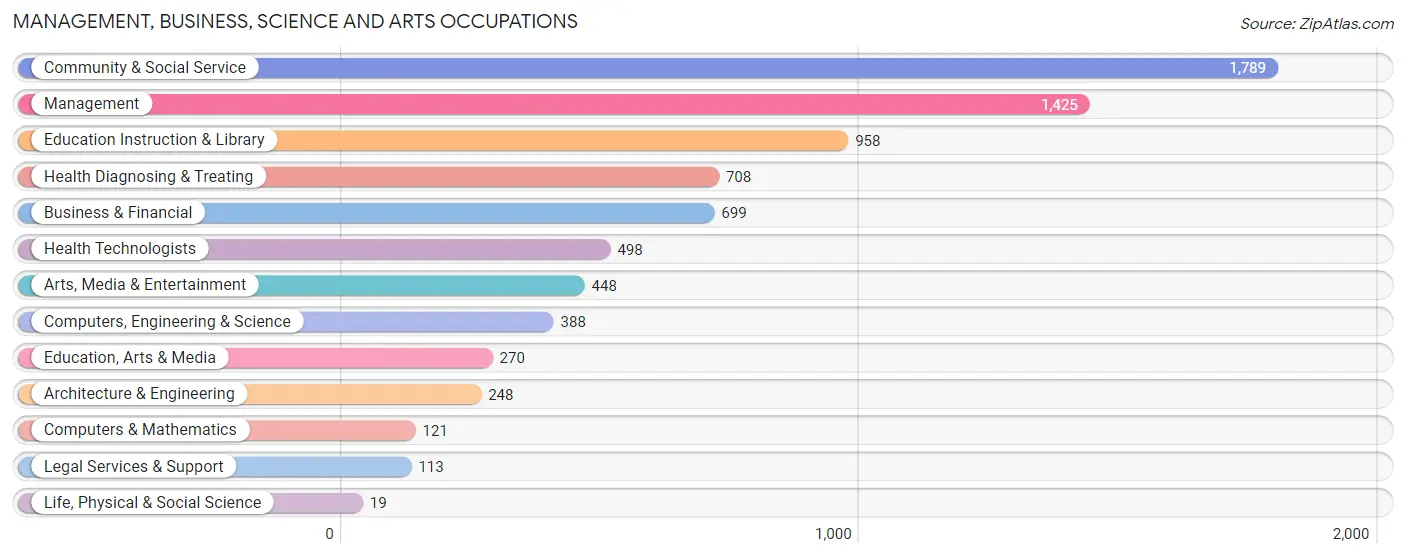
Management, Business, Science and Arts Occupations
The most common Management, Business, Science and Arts occupations in Lomita are Community & Social Service (1,789 | 16.1%), Management (1,425 | 12.9%), Education Instruction & Library (958 | 8.6%), Health Diagnosing & Treating (708 | 6.4%), and Business & Financial (699 | 6.3%).
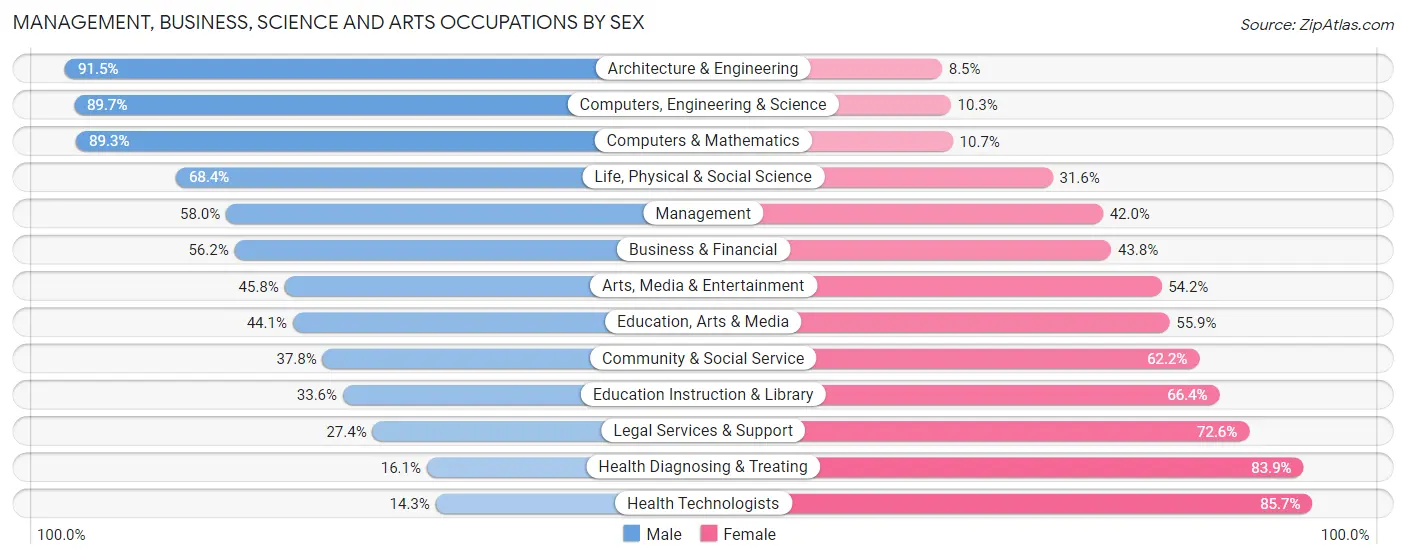
Management, Business, Science and Arts Occupations by Sex
Within the Management, Business, Science and Arts occupations in Lomita, the most male-oriented occupations are Architecture & Engineering (91.5%), Computers, Engineering & Science (89.7%), and Computers & Mathematics (89.3%), while the most female-oriented occupations are Health Technologists (85.7%), Health Diagnosing & Treating (83.9%), and Legal Services & Support (72.6%).
| Occupation | Male | Female |
| Management | 826 (58.0%) | 599 (42.0%) |
| Business & Financial | 393 (56.2%) | 306 (43.8%) |
| Computers, Engineering & Science | 348 (89.7%) | 40 (10.3%) |
| Computers & Mathematics | 108 (89.3%) | 13 (10.7%) |
| Architecture & Engineering | 227 (91.5%) | 21 (8.5%) |
| Life, Physical & Social Science | 13 (68.4%) | 6 (31.6%) |
| Community & Social Service | 677 (37.8%) | 1,112 (62.2%) |
| Education, Arts & Media | 119 (44.1%) | 151 (55.9%) |
| Legal Services & Support | 31 (27.4%) | 82 (72.6%) |
| Education Instruction & Library | 322 (33.6%) | 636 (66.4%) |
| Arts, Media & Entertainment | 205 (45.8%) | 243 (54.2%) |
| Health Diagnosing & Treating | 114 (16.1%) | 594 (83.9%) |
| Health Technologists | 71 (14.3%) | 427 (85.7%) |
| Total (Category) | 2,358 (47.1%) | 2,651 (52.9%) |
| Total (Overall) | 5,662 (51.0%) | 5,430 (48.9%) |
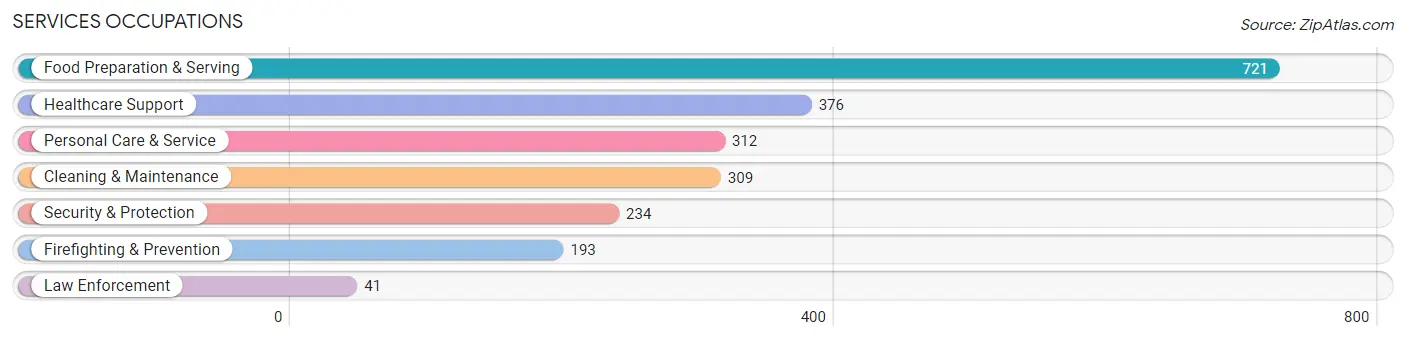
Services Occupations
The most common Services occupations in Lomita are Food Preparation & Serving (721 | 6.5%), Healthcare Support (376 | 3.4%), Personal Care & Service (312 | 2.8%), Cleaning & Maintenance (309 | 2.8%), and Security & Protection (234 | 2.1%).
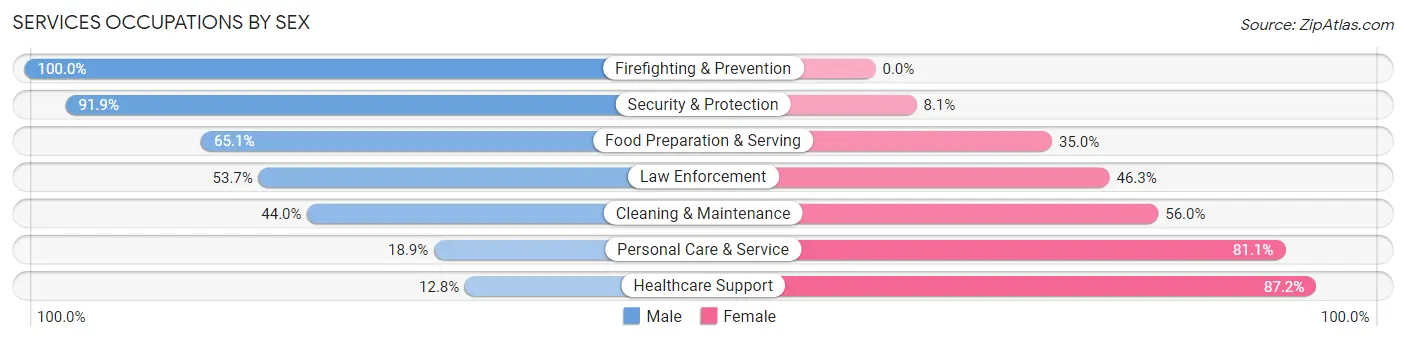
Services Occupations by Sex
Within the Services occupations in Lomita, the most male-oriented occupations are Firefighting & Prevention (100.0%), Security & Protection (91.9%), and Food Preparation & Serving (65.0%), while the most female-oriented occupations are Healthcare Support (87.2%), Personal Care & Service (81.1%), and Cleaning & Maintenance (56.0%).
| Occupation | Male | Female |
| Healthcare Support | 48 (12.8%) | 328 (87.2%) |
| Security & Protection | 215 (91.9%) | 19 (8.1%) |
| Firefighting & Prevention | 193 (100.0%) | 0 (0.0%) |
| Law Enforcement | 22 (53.7%) | 19 (46.3%) |
| Food Preparation & Serving | 469 (65.0%) | 252 (34.9%) |
| Cleaning & Maintenance | 136 (44.0%) | 173 (56.0%) |
| Personal Care & Service | 59 (18.9%) | 253 (81.1%) |
| Total (Category) | 927 (47.5%) | 1,025 (52.5%) |
| Total (Overall) | 5,662 (51.0%) | 5,430 (48.9%) |
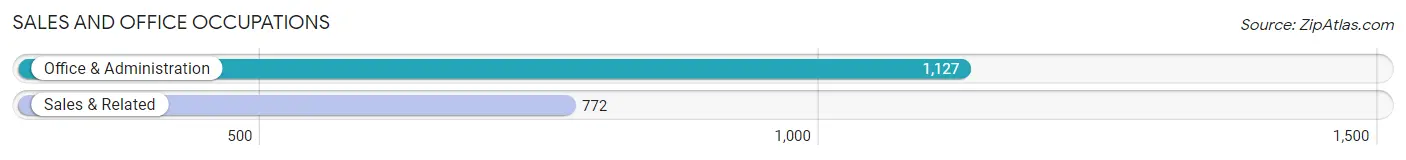
Sales and Office Occupations
The most common Sales and Office occupations in Lomita are Office & Administration (1,127 | 10.2%), and Sales & Related (772 | 7.0%).
Sales and Office Occupations by Sex
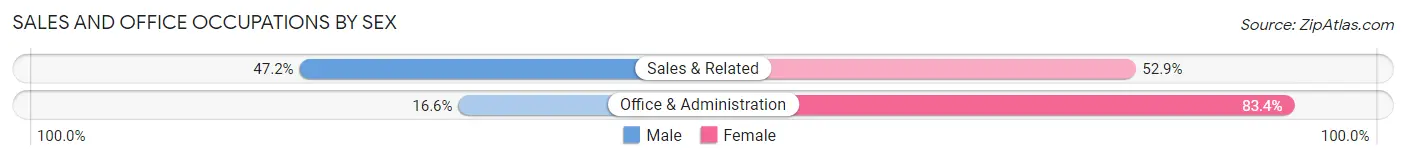
| Occupation | Male | Female |
| Sales & Related | 364 (47.1%) | 408 (52.8%) |
| Office & Administration | 187 (16.6%) | 940 (83.4%) |
| Total (Category) | 551 (29.0%) | 1,348 (71.0%) |
| Total (Overall) | 5,662 (51.0%) | 5,430 (48.9%) |
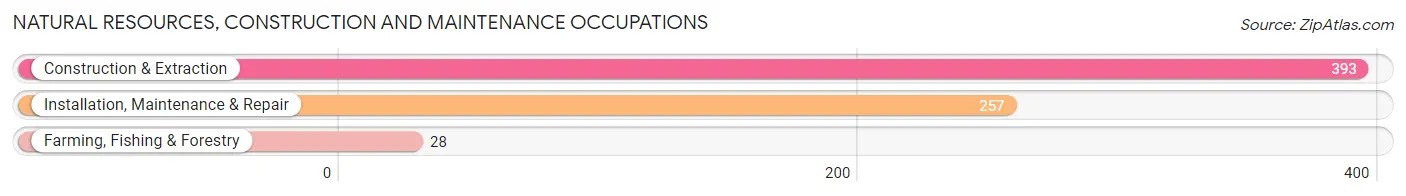
Natural Resources, Construction and Maintenance Occupations
The most common Natural Resources, Construction and Maintenance occupations in Lomita are Construction & Extraction (393 | 3.5%), Installation, Maintenance & Repair (257 | 2.3%), and Farming, Fishing & Forestry (28 | 0.3%).
Natural Resources, Construction and Maintenance Occupations by Sex
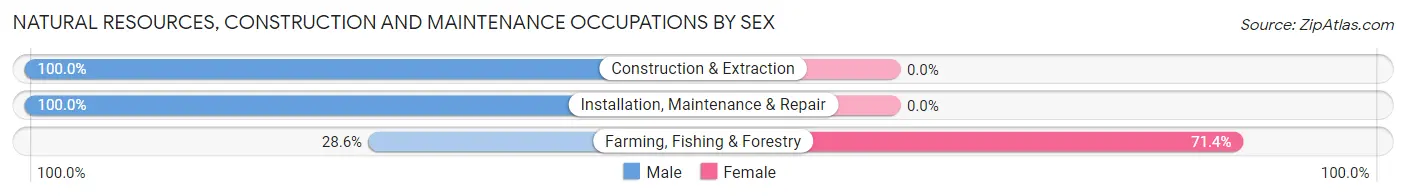
| Occupation | Male | Female |
| Farming, Fishing & Forestry | 8 (28.6%) | 20 (71.4%) |
| Construction & Extraction | 393 (100.0%) | 0 (0.0%) |
| Installation, Maintenance & Repair | 257 (100.0%) | 0 (0.0%) |
| Total (Category) | 658 (97.1%) | 20 (2.9%) |
| Total (Overall) | 5,662 (51.0%) | 5,430 (48.9%) |
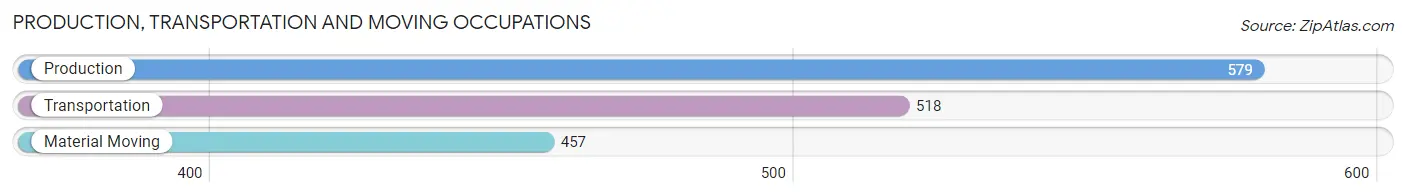
Production, Transportation and Moving Occupations
The most common Production, Transportation and Moving occupations in Lomita are Production (579 | 5.2%), Transportation (518 | 4.7%), and Material Moving (457 | 4.1%).
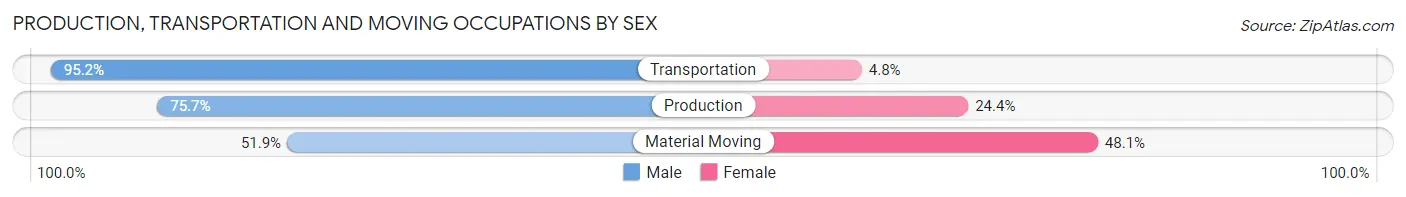
Production, Transportation and Moving Occupations by Sex
| Occupation | Male | Female |
| Production | 438 (75.6%) | 141 (24.3%) |
| Transportation | 493 (95.2%) | 25 (4.8%) |
| Material Moving | 237 (51.9%) | 220 (48.1%) |
| Total (Category) | 1,168 (75.2%) | 386 (24.8%) |
| Total (Overall) | 5,662 (51.0%) | 5,430 (48.9%) |
Employment Industries by Sex in Lomita
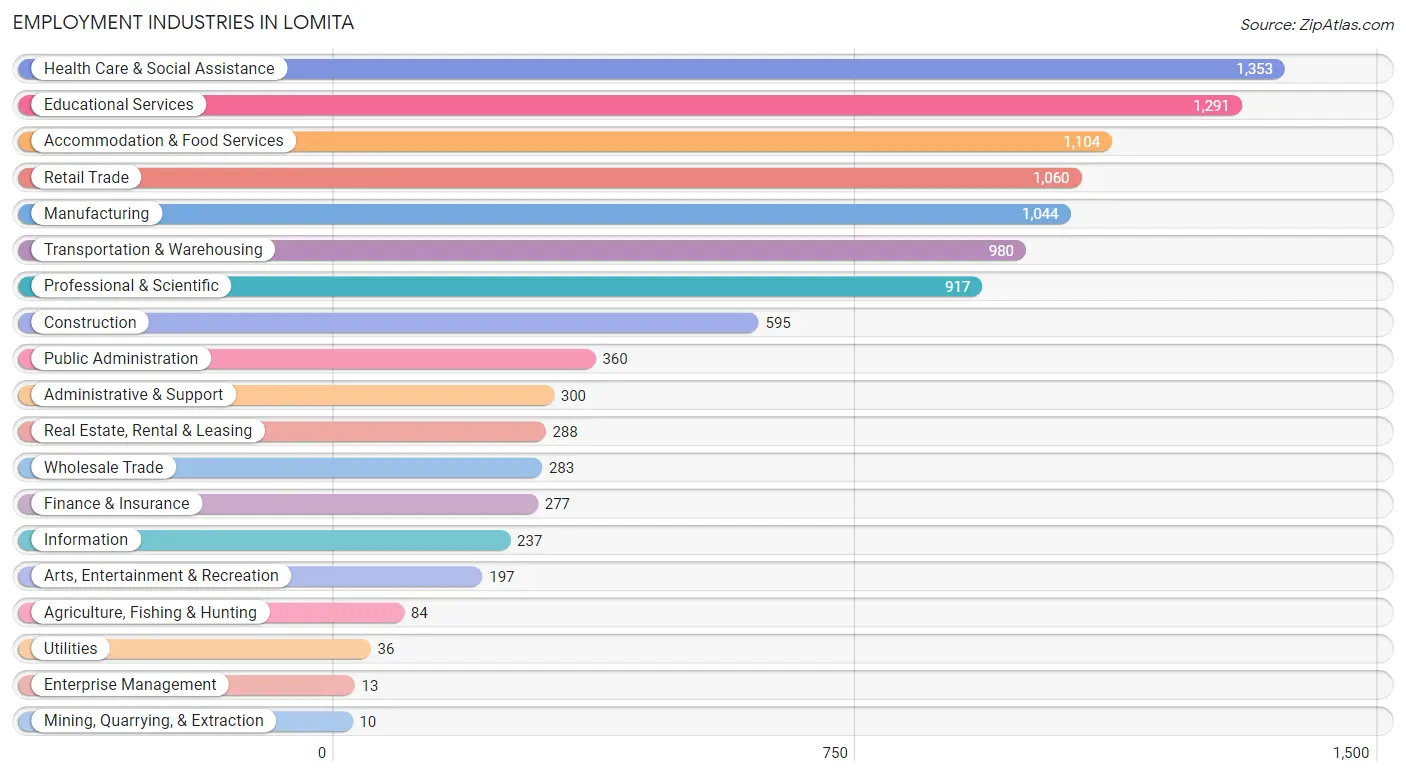
Employment Industries in Lomita
The major employment industries in Lomita include Health Care & Social Assistance (1,353 | 12.2%), Educational Services (1,291 | 11.6%), Accommodation & Food Services (1,104 | 10.0%), Retail Trade (1,060 | 9.6%), and Manufacturing (1,044 | 9.4%).
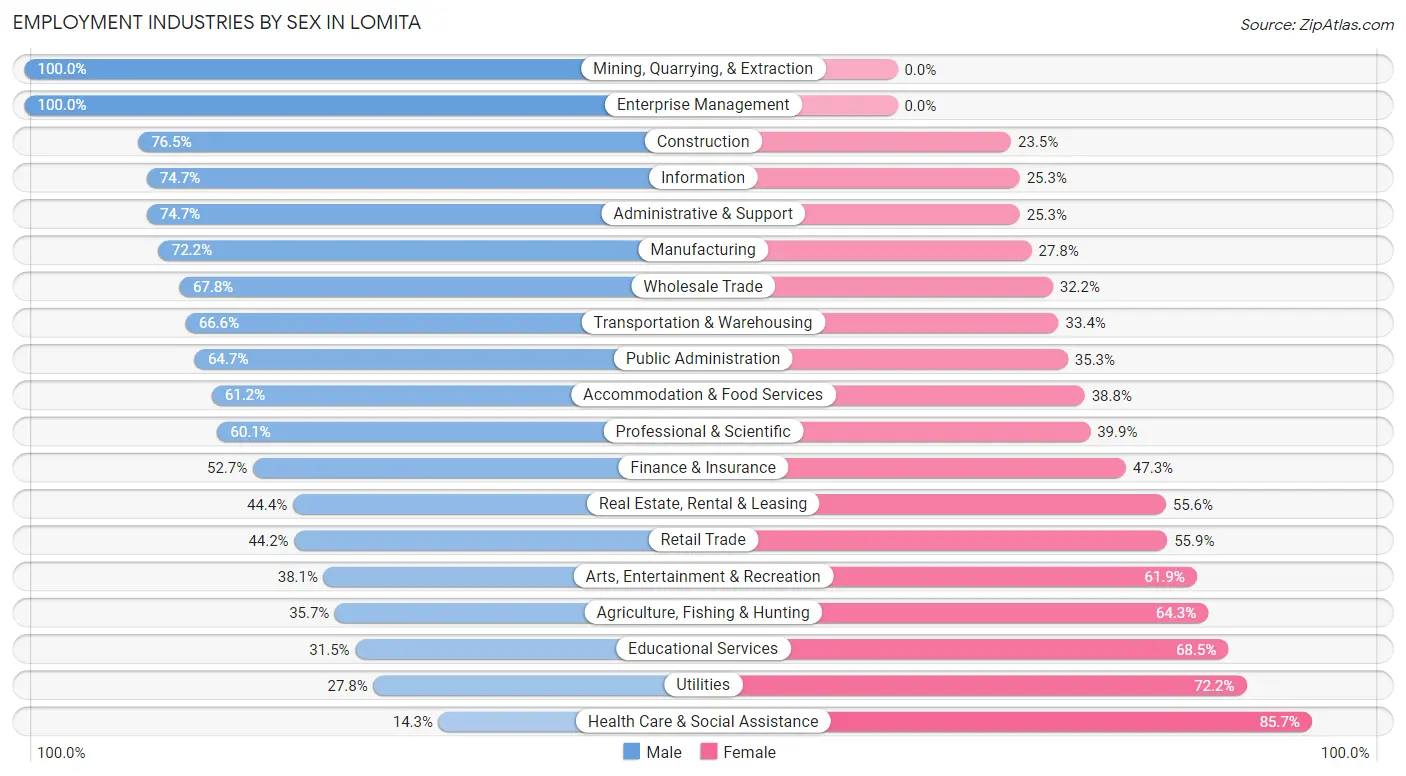
Employment Industries by Sex in Lomita
The Lomita industries that see more men than women are Mining, Quarrying, & Extraction (100.0%), Enterprise Management (100.0%), and Construction (76.5%), whereas the industries that tend to have a higher number of women are Health Care & Social Assistance (85.7%), Utilities (72.2%), and Educational Services (68.5%).
| Industry | Male | Female |
| Agriculture, Fishing & Hunting | 30 (35.7%) | 54 (64.3%) |
| Mining, Quarrying, & Extraction | 10 (100.0%) | 0 (0.0%) |
| Construction | 455 (76.5%) | 140 (23.5%) |
| Manufacturing | 754 (72.2%) | 290 (27.8%) |
| Wholesale Trade | 192 (67.8%) | 91 (32.2%) |
| Retail Trade | 468 (44.2%) | 592 (55.8%) |
| Transportation & Warehousing | 653 (66.6%) | 327 (33.4%) |
| Utilities | 10 (27.8%) | 26 (72.2%) |
| Information | 177 (74.7%) | 60 (25.3%) |
| Finance & Insurance | 146 (52.7%) | 131 (47.3%) |
| Real Estate, Rental & Leasing | 128 (44.4%) | 160 (55.6%) |
| Professional & Scientific | 551 (60.1%) | 366 (39.9%) |
| Enterprise Management | 13 (100.0%) | 0 (0.0%) |
| Administrative & Support | 224 (74.7%) | 76 (25.3%) |
| Educational Services | 407 (31.5%) | 884 (68.5%) |
| Health Care & Social Assistance | 193 (14.3%) | 1,160 (85.7%) |
| Arts, Entertainment & Recreation | 75 (38.1%) | 122 (61.9%) |
| Accommodation & Food Services | 676 (61.2%) | 428 (38.8%) |
| Public Administration | 233 (64.7%) | 127 (35.3%) |
| Total | 5,662 (51.0%) | 5,430 (48.9%) |
Education in Lomita
School Enrollment in Lomita
The most common levels of schooling among the 5,119 students in Lomita are college / undergraduate (1,478 | 28.9%), high school (1,075 | 21.0%), and elementary school (771 | 15.1%).
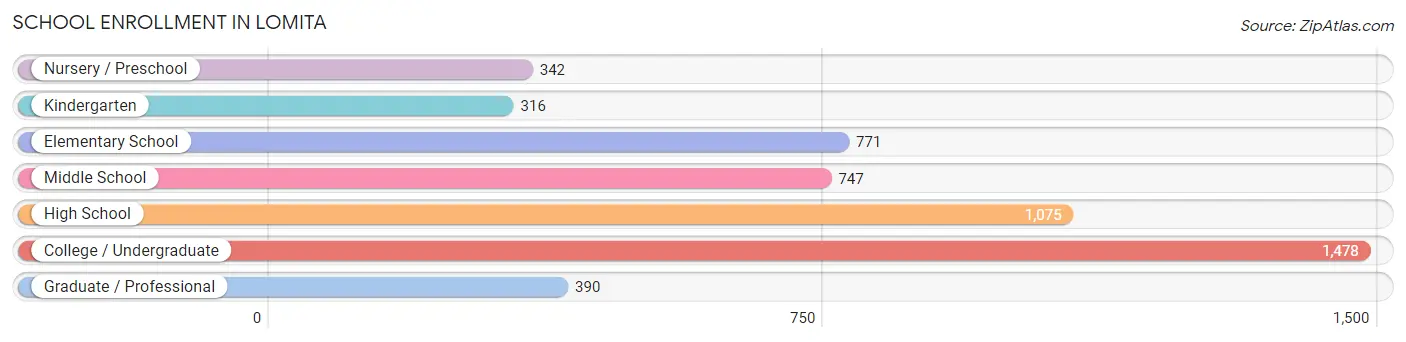
| School Level | # Students | % Students |
| Nursery / Preschool | 342 | 6.7% |
| Kindergarten | 316 | 6.2% |
| Elementary School | 771 | 15.1% |
| Middle School | 747 | 14.6% |
| High School | 1,075 | 21.0% |
| College / Undergraduate | 1,478 | 28.9% |
| Graduate / Professional | 390 | 7.6% |
| Total | 5,119 | 100.0% |
School Enrollment by Age by Funding Source in Lomita
Out of a total of 5,119 students who are enrolled in schools in Lomita, 1,080 (21.1%) attend a private institution, while the remaining 4,039 (78.9%) are enrolled in public schools. The age group of 3 to 4 year olds has the highest likelihood of being enrolled in private schools, with 105 (34.8% in the age bracket) enrolled. Conversely, the age group of 35 years and over has the lowest likelihood of being enrolled in a private school, with 261 (85.0% in the age bracket) attending a public institution.
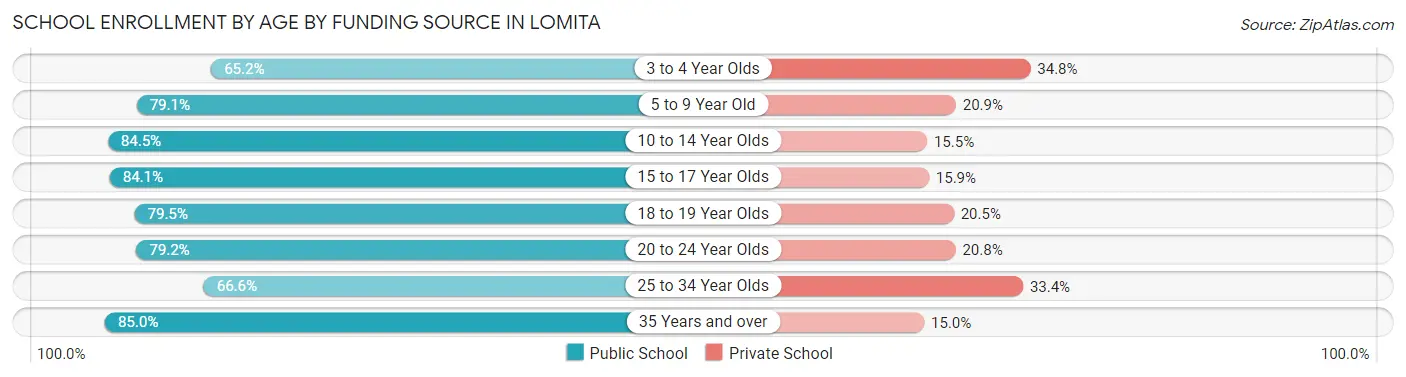
| Age Bracket | Public School | Private School |
| 3 to 4 Year Olds | 197 (65.2%) | 105 (34.8%) |
| 5 to 9 Year Old | 822 (79.1%) | 217 (20.9%) |
| 10 to 14 Year Olds | 746 (84.5%) | 137 (15.5%) |
| 15 to 17 Year Olds | 700 (84.1%) | 132 (15.9%) |
| 18 to 19 Year Olds | 384 (79.5%) | 99 (20.5%) |
| 20 to 24 Year Olds | 517 (79.2%) | 136 (20.8%) |
| 25 to 34 Year Olds | 413 (66.6%) | 207 (33.4%) |
| 35 Years and over | 261 (85.0%) | 46 (15.0%) |
| Total | 4,039 (78.9%) | 1,080 (21.1%) |
Educational Attainment by Field of Study in Lomita
Business (1,036 | 16.9%), social sciences (618 | 10.1%), visual & performing arts (613 | 10.0%), science & technology (486 | 7.9%), and engineering (471 | 7.7%) are the most common fields of study among 6,140 individuals in Lomita who have obtained a bachelor's degree or higher.
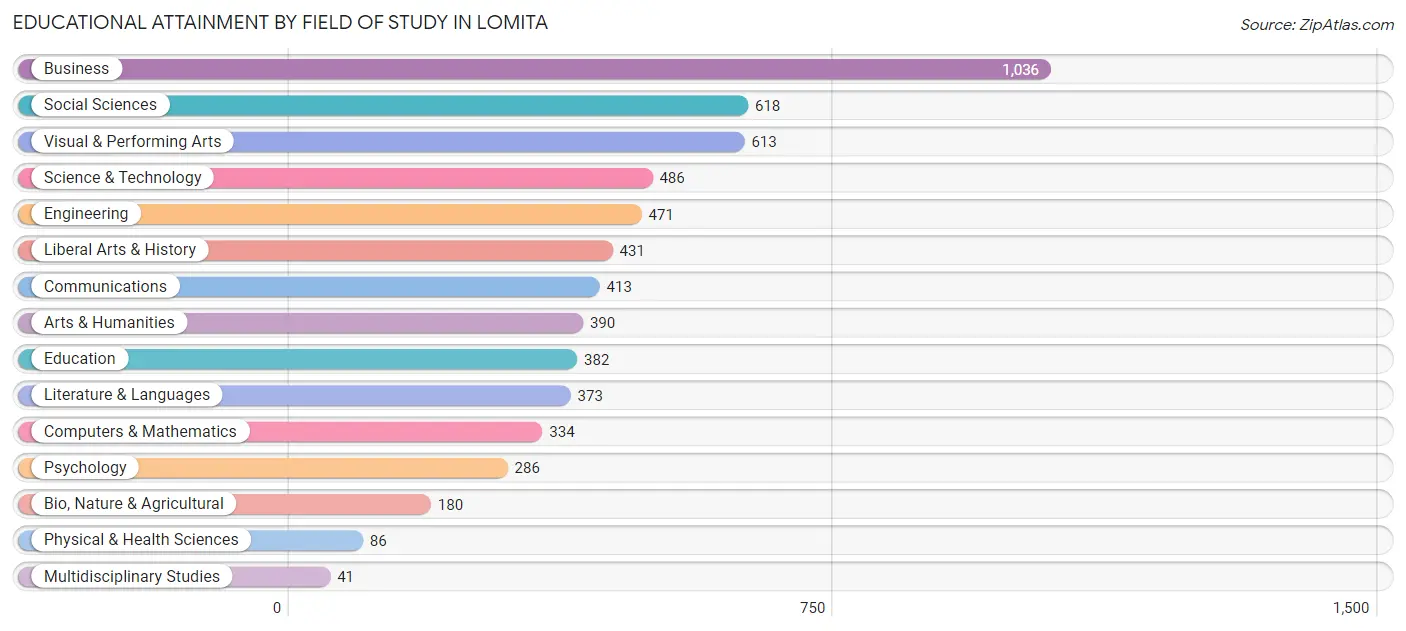
| Field of Study | # Graduates | % Graduates |
| Computers & Mathematics | 334 | 5.4% |
| Bio, Nature & Agricultural | 180 | 2.9% |
| Physical & Health Sciences | 86 | 1.4% |
| Psychology | 286 | 4.7% |
| Social Sciences | 618 | 10.1% |
| Engineering | 471 | 7.7% |
| Multidisciplinary Studies | 41 | 0.7% |
| Science & Technology | 486 | 7.9% |
| Business | 1,036 | 16.9% |
| Education | 382 | 6.2% |
| Literature & Languages | 373 | 6.1% |
| Liberal Arts & History | 431 | 7.0% |
| Visual & Performing Arts | 613 | 10.0% |
| Communications | 413 | 6.7% |
| Arts & Humanities | 390 | 6.4% |
| Total | 6,140 | 100.0% |
Transportation & Commute in Lomita
Vehicle Availability by Sex in Lomita
The most prevalent vehicle ownership categories in Lomita are males with 2 vehicles (2,420, accounting for 43.8%) and females with 2 vehicles (1,791, making up 47.7%).
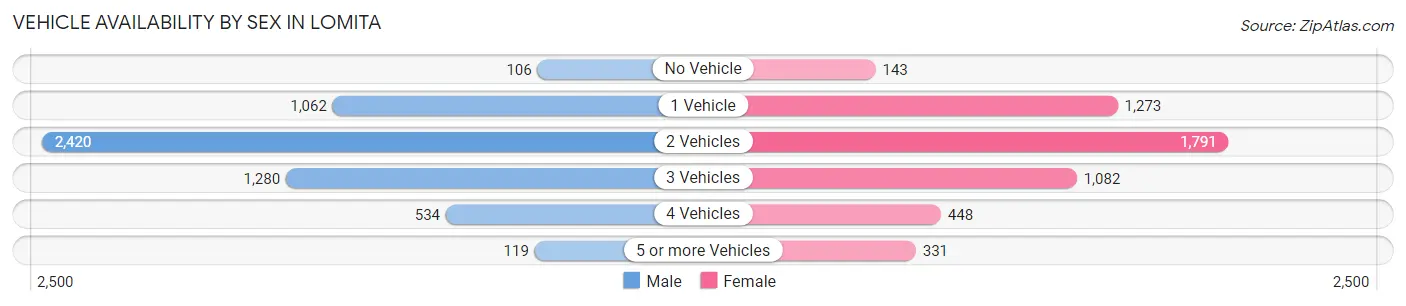
| Vehicles Available | Male | Female |
| No Vehicle | 106 (1.9%) | 143 (2.8%) |
| 1 Vehicle | 1,062 (19.2%) | 1,273 (25.1%) |
| 2 Vehicles | 2,420 (43.8%) | 1,791 (35.3%) |
| 3 Vehicles | 1,280 (23.2%) | 1,082 (21.3%) |
| 4 Vehicles | 534 (9.7%) | 448 (8.8%) |
| 5 or more Vehicles | 119 (2.2%) | 331 (6.5%) |
| Total | 5,521 (100.0%) | 5,068 (100.0%) |
Commute Time in Lomita
The most frequently occuring commute durations in Lomita are 20 to 24 minutes (1,633 commuters, 17.4%), 15 to 19 minutes (1,555 commuters, 16.6%), and 30 to 34 minutes (1,212 commuters, 12.9%).
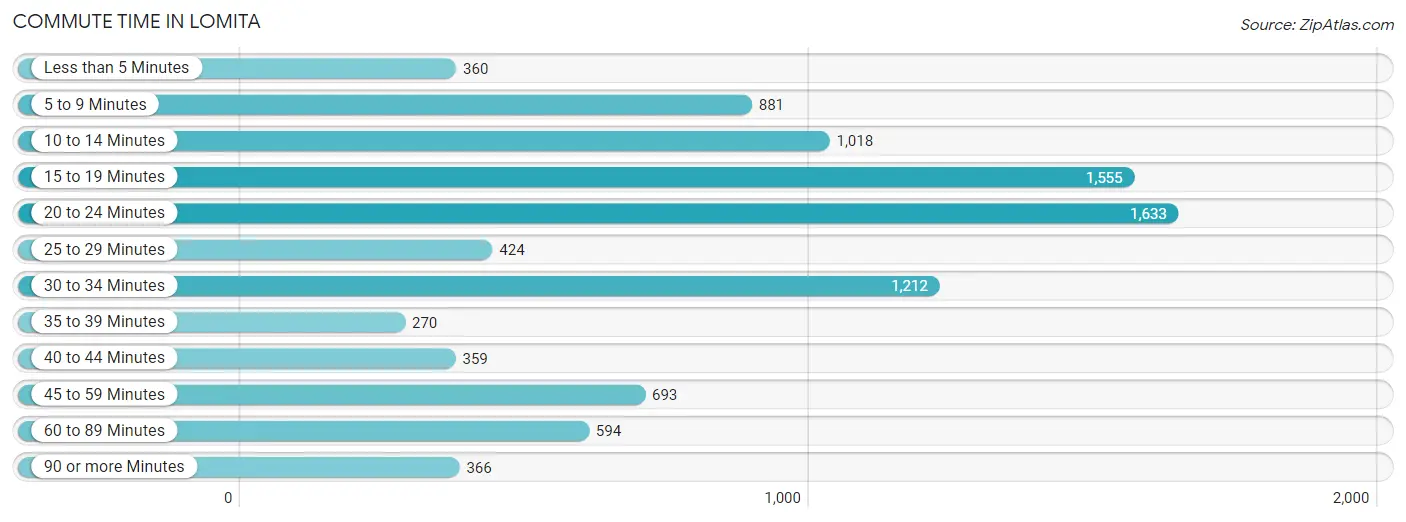
| Commute Time | # Commuters | % Commuters |
| Less than 5 Minutes | 360 | 3.8% |
| 5 to 9 Minutes | 881 | 9.4% |
| 10 to 14 Minutes | 1,018 | 10.9% |
| 15 to 19 Minutes | 1,555 | 16.6% |
| 20 to 24 Minutes | 1,633 | 17.4% |
| 25 to 29 Minutes | 424 | 4.5% |
| 30 to 34 Minutes | 1,212 | 12.9% |
| 35 to 39 Minutes | 270 | 2.9% |
| 40 to 44 Minutes | 359 | 3.8% |
| 45 to 59 Minutes | 693 | 7.4% |
| 60 to 89 Minutes | 594 | 6.3% |
| 90 or more Minutes | 366 | 3.9% |
Commute Time by Sex in Lomita
The most common commute times in Lomita are 20 to 24 minutes (846 commuters, 17.4%) for males and 20 to 24 minutes (787 commuters, 17.5%) for females.
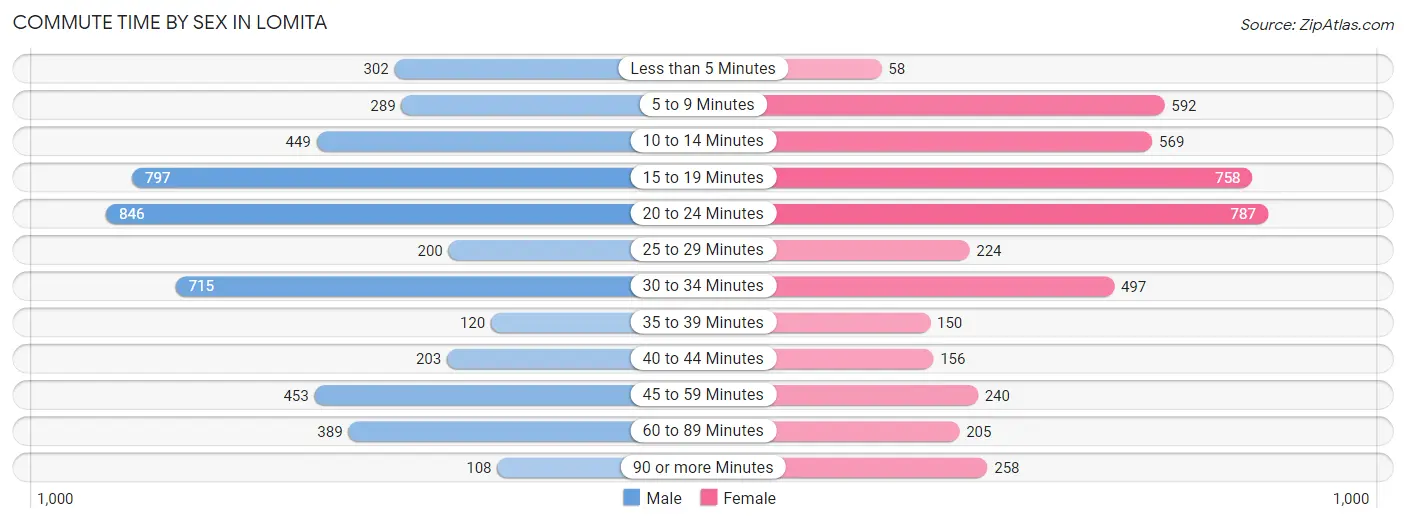
| Commute Time | Male | Female |
| Less than 5 Minutes | 302 (6.2%) | 58 (1.3%) |
| 5 to 9 Minutes | 289 (5.9%) | 592 (13.2%) |
| 10 to 14 Minutes | 449 (9.2%) | 569 (12.7%) |
| 15 to 19 Minutes | 797 (16.4%) | 758 (16.9%) |
| 20 to 24 Minutes | 846 (17.4%) | 787 (17.5%) |
| 25 to 29 Minutes | 200 (4.1%) | 224 (5.0%) |
| 30 to 34 Minutes | 715 (14.7%) | 497 (11.1%) |
| 35 to 39 Minutes | 120 (2.5%) | 150 (3.3%) |
| 40 to 44 Minutes | 203 (4.2%) | 156 (3.5%) |
| 45 to 59 Minutes | 453 (9.3%) | 240 (5.3%) |
| 60 to 89 Minutes | 389 (8.0%) | 205 (4.6%) |
| 90 or more Minutes | 108 (2.2%) | 258 (5.7%) |
Time of Departure to Work by Sex in Lomita
The most frequent times of departure to work in Lomita are 7:00 AM to 7:29 AM (866, 17.8%) for males and 7:30 AM to 7:59 AM (567, 12.6%) for females.
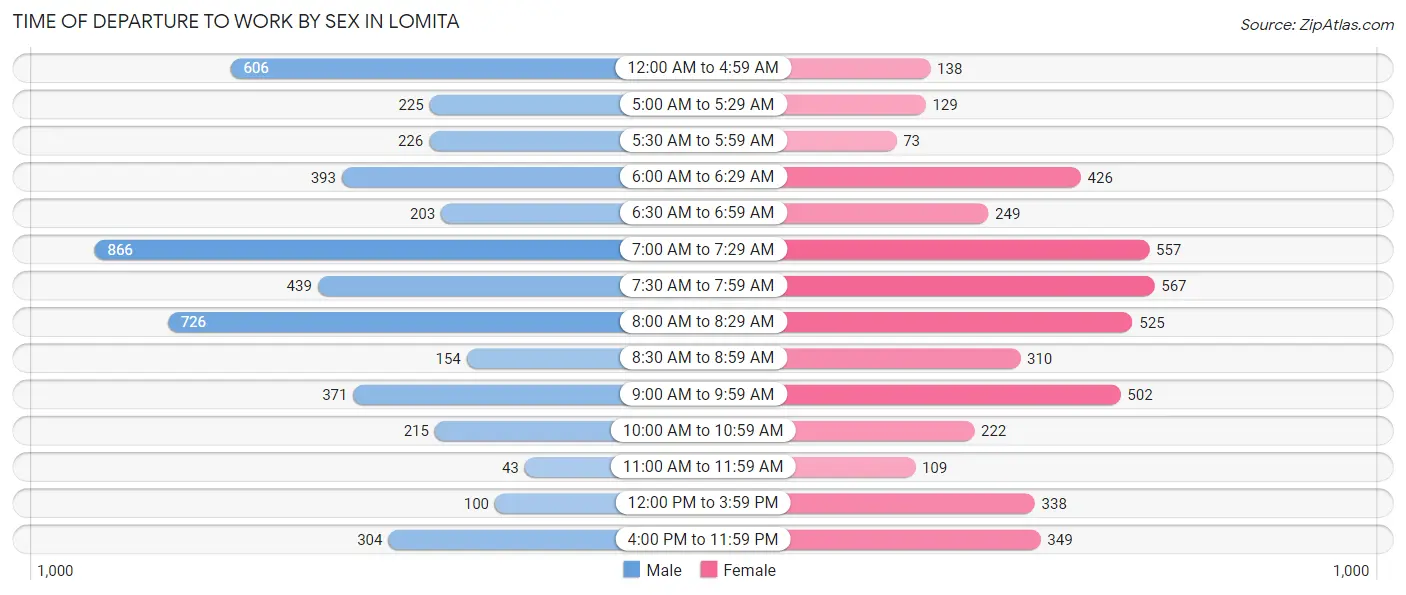
| Time of Departure | Male | Female |
| 12:00 AM to 4:59 AM | 606 (12.4%) | 138 (3.1%) |
| 5:00 AM to 5:29 AM | 225 (4.6%) | 129 (2.9%) |
| 5:30 AM to 5:59 AM | 226 (4.6%) | 73 (1.6%) |
| 6:00 AM to 6:29 AM | 393 (8.1%) | 426 (9.5%) |
| 6:30 AM to 6:59 AM | 203 (4.2%) | 249 (5.5%) |
| 7:00 AM to 7:29 AM | 866 (17.8%) | 557 (12.4%) |
| 7:30 AM to 7:59 AM | 439 (9.0%) | 567 (12.6%) |
| 8:00 AM to 8:29 AM | 726 (14.9%) | 525 (11.7%) |
| 8:30 AM to 8:59 AM | 154 (3.2%) | 310 (6.9%) |
| 9:00 AM to 9:59 AM | 371 (7.6%) | 502 (11.2%) |
| 10:00 AM to 10:59 AM | 215 (4.4%) | 222 (4.9%) |
| 11:00 AM to 11:59 AM | 43 (0.9%) | 109 (2.4%) |
| 12:00 PM to 3:59 PM | 100 (2.1%) | 338 (7.5%) |
| 4:00 PM to 11:59 PM | 304 (6.2%) | 349 (7.8%) |
| Total | 4,871 (100.0%) | 4,494 (100.0%) |
Housing Occupancy in Lomita
Occupancy by Ownership in Lomita
Of the total 7,890 dwellings in Lomita, owner-occupied units account for 3,637 (46.1%), while renter-occupied units make up 4,253 (53.9%).
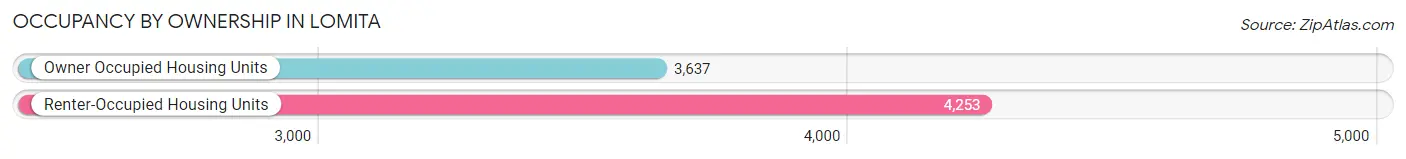
| Occupancy | # Housing Units | % Housing Units |
| Owner Occupied Housing Units | 3,637 | 46.1% |
| Renter-Occupied Housing Units | 4,253 | 53.9% |
| Total Occupied Housing Units | 7,890 | 100.0% |
Occupancy by Household Size in Lomita
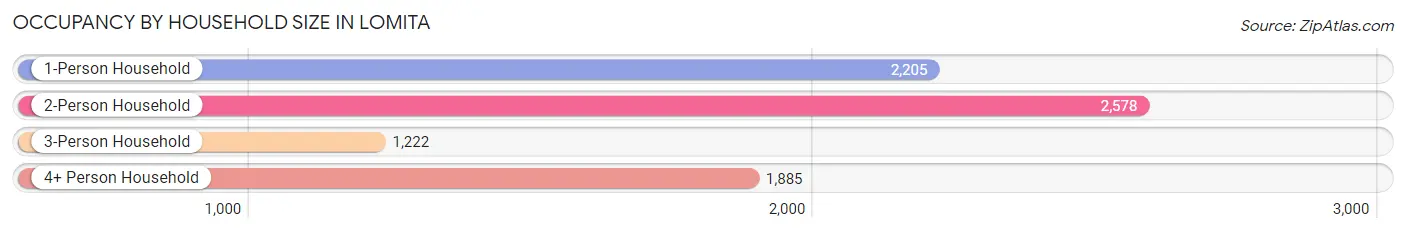
| Household Size | # Housing Units | % Housing Units |
| 1-Person Household | 2,205 | 28.0% |
| 2-Person Household | 2,578 | 32.7% |
| 3-Person Household | 1,222 | 15.5% |
| 4+ Person Household | 1,885 | 23.9% |
| Total Housing Units | 7,890 | 100.0% |
Occupancy by Ownership by Household Size in Lomita
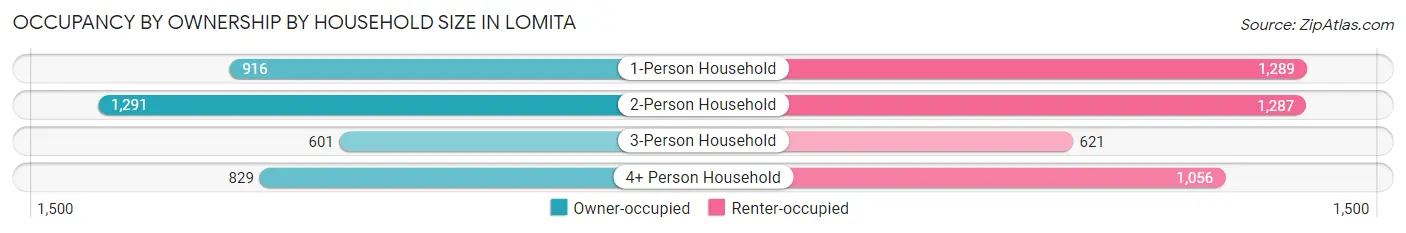
| Household Size | Owner-occupied | Renter-occupied |
| 1-Person Household | 916 (41.5%) | 1,289 (58.5%) |
| 2-Person Household | 1,291 (50.1%) | 1,287 (49.9%) |
| 3-Person Household | 601 (49.2%) | 621 (50.8%) |
| 4+ Person Household | 829 (44.0%) | 1,056 (56.0%) |
| Total Housing Units | 3,637 (46.1%) | 4,253 (53.9%) |
Occupancy by Educational Attainment in Lomita
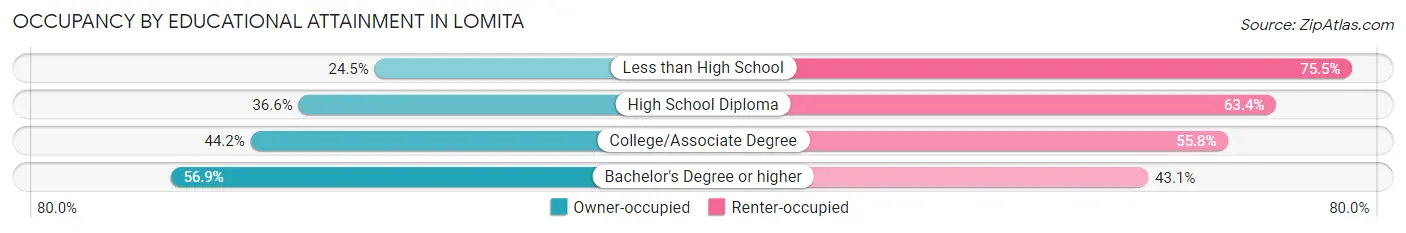
| Household Size | Owner-occupied | Renter-occupied |
| Less than High School | 245 (24.5%) | 756 (75.5%) |
| High School Diploma | 464 (36.6%) | 805 (63.4%) |
| College/Associate Degree | 930 (44.2%) | 1,176 (55.8%) |
| Bachelor's Degree or higher | 1,998 (56.9%) | 1,516 (43.1%) |
Occupancy by Age of Householder in Lomita
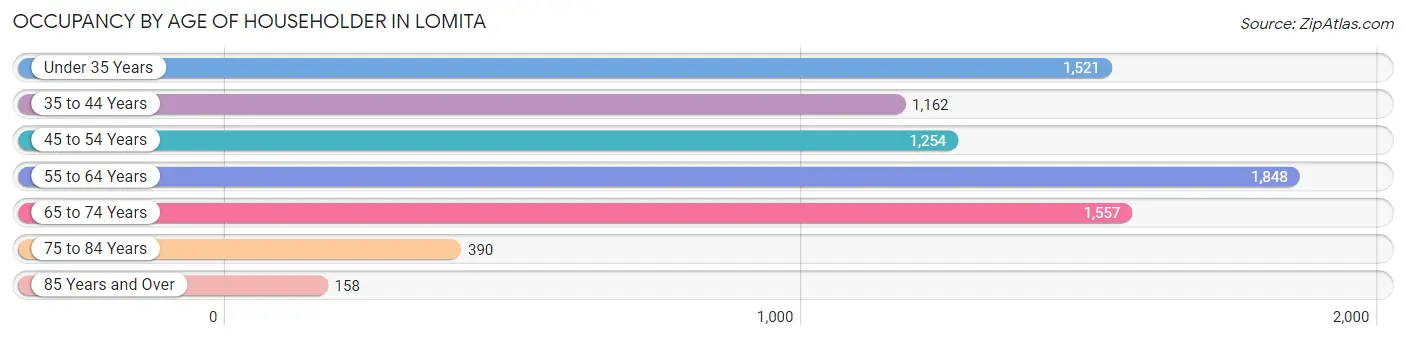
| Age Bracket | # Households | % Households |
| Under 35 Years | 1,521 | 19.3% |
| 35 to 44 Years | 1,162 | 14.7% |
| 45 to 54 Years | 1,254 | 15.9% |
| 55 to 64 Years | 1,848 | 23.4% |
| 65 to 74 Years | 1,557 | 19.7% |
| 75 to 84 Years | 390 | 4.9% |
| 85 Years and Over | 158 | 2.0% |
| Total | 7,890 | 100.0% |
Housing Finances in Lomita
Median Income by Occupancy in Lomita
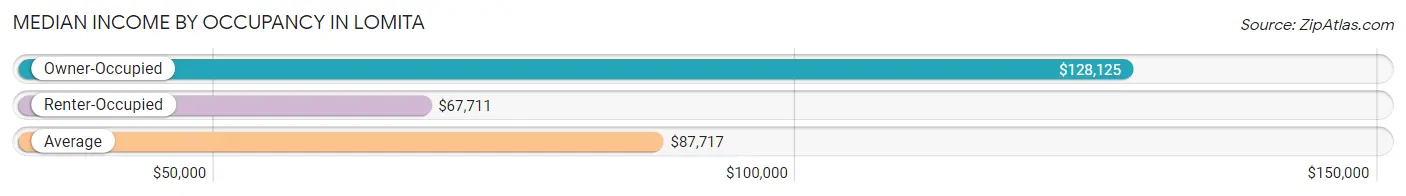
| Occupancy Type | # Households | Median Income |
| Owner-Occupied | 3,637 (46.1%) | $128,125 |
| Renter-Occupied | 4,253 (53.9%) | $67,711 |
| Average | 7,890 (100.0%) | $87,717 |
Occupancy by Householder Income Bracket in Lomita
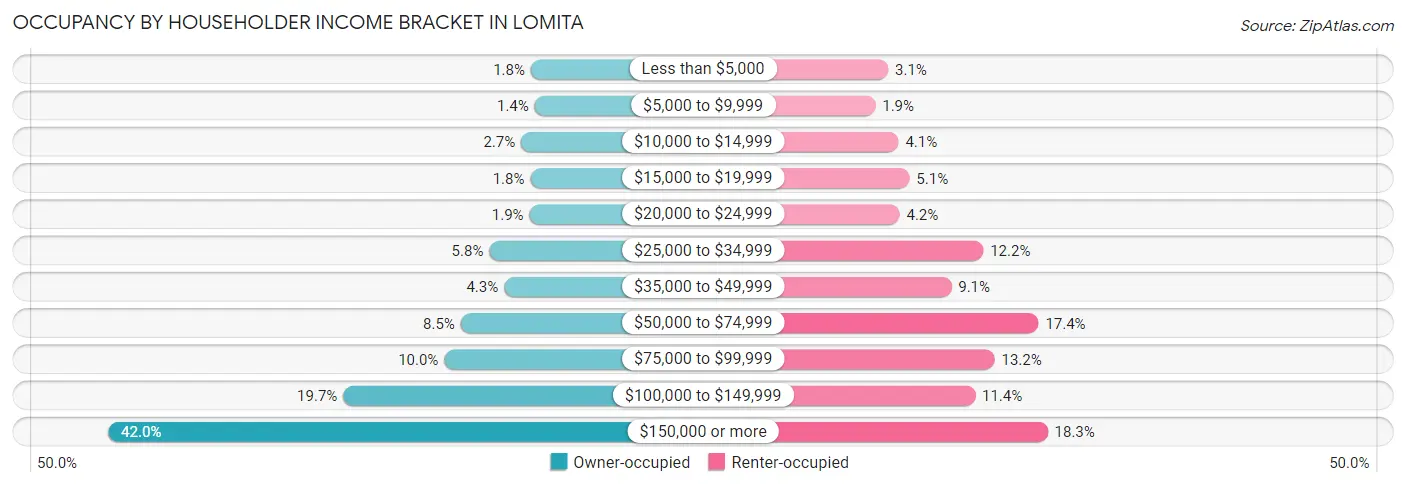
| Income Bracket | Owner-occupied | Renter-occupied |
| Less than $5,000 | 65 (1.8%) | 132 (3.1%) |
| $5,000 to $9,999 | 52 (1.4%) | 80 (1.9%) |
| $10,000 to $14,999 | 99 (2.7%) | 174 (4.1%) |
| $15,000 to $19,999 | 67 (1.8%) | 218 (5.1%) |
| $20,000 to $24,999 | 70 (1.9%) | 178 (4.2%) |
| $25,000 to $34,999 | 209 (5.8%) | 517 (12.2%) |
| $35,000 to $49,999 | 158 (4.3%) | 388 (9.1%) |
| $50,000 to $74,999 | 308 (8.5%) | 741 (17.4%) |
| $75,000 to $99,999 | 365 (10.0%) | 563 (13.2%) |
| $100,000 to $149,999 | 715 (19.7%) | 484 (11.4%) |
| $150,000 or more | 1,529 (42.0%) | 778 (18.3%) |
| Total | 3,637 (100.0%) | 4,253 (100.0%) |
Monthly Housing Cost Tiers in Lomita
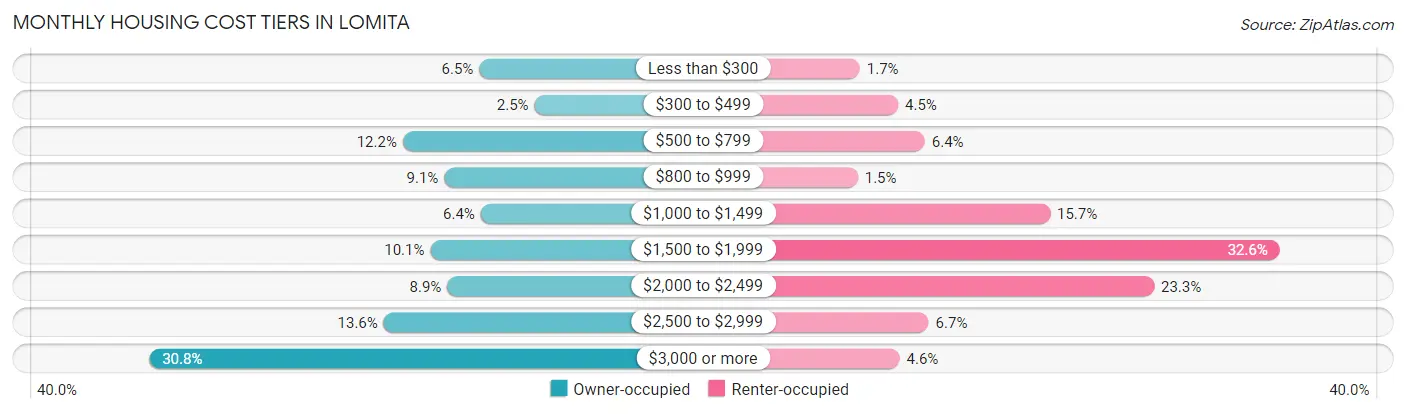
| Monthly Cost | Owner-occupied | Renter-occupied |
| Less than $300 | 237 (6.5%) | 70 (1.7%) |
| $300 to $499 | 89 (2.5%) | 190 (4.5%) |
| $500 to $799 | 442 (12.1%) | 274 (6.4%) |
| $800 to $999 | 331 (9.1%) | 64 (1.5%) |
| $1,000 to $1,499 | 233 (6.4%) | 666 (15.7%) |
| $1,500 to $1,999 | 368 (10.1%) | 1,385 (32.6%) |
| $2,000 to $2,499 | 323 (8.9%) | 992 (23.3%) |
| $2,500 to $2,999 | 493 (13.6%) | 286 (6.7%) |
| $3,000 or more | 1,121 (30.8%) | 195 (4.6%) |
| Total | 3,637 (100.0%) | 4,253 (100.0%) |
Physical Housing Characteristics in Lomita
Housing Structures in Lomita
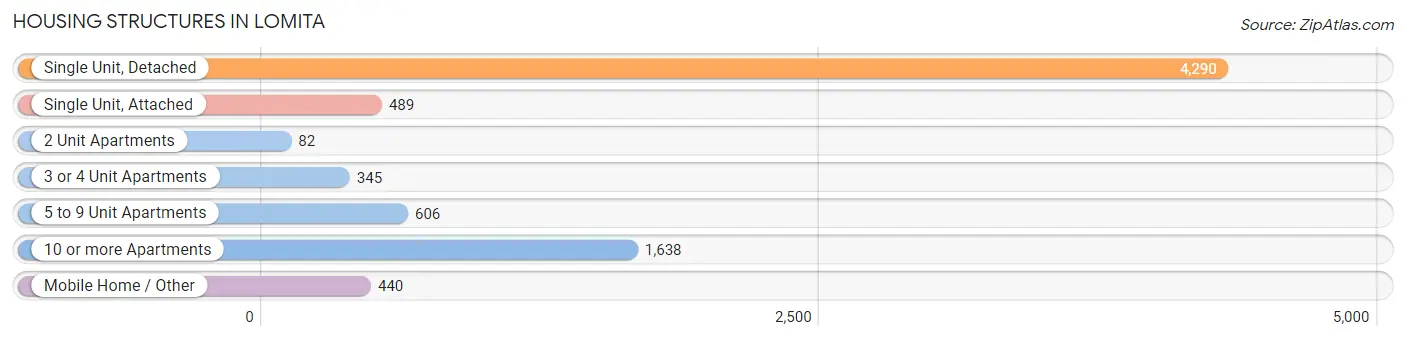
| Structure Type | # Housing Units | % Housing Units |
| Single Unit, Detached | 4,290 | 54.4% |
| Single Unit, Attached | 489 | 6.2% |
| 2 Unit Apartments | 82 | 1.0% |
| 3 or 4 Unit Apartments | 345 | 4.4% |
| 5 to 9 Unit Apartments | 606 | 7.7% |
| 10 or more Apartments | 1,638 | 20.8% |
| Mobile Home / Other | 440 | 5.6% |
| Total | 7,890 | 100.0% |
Housing Structures by Occupancy in Lomita
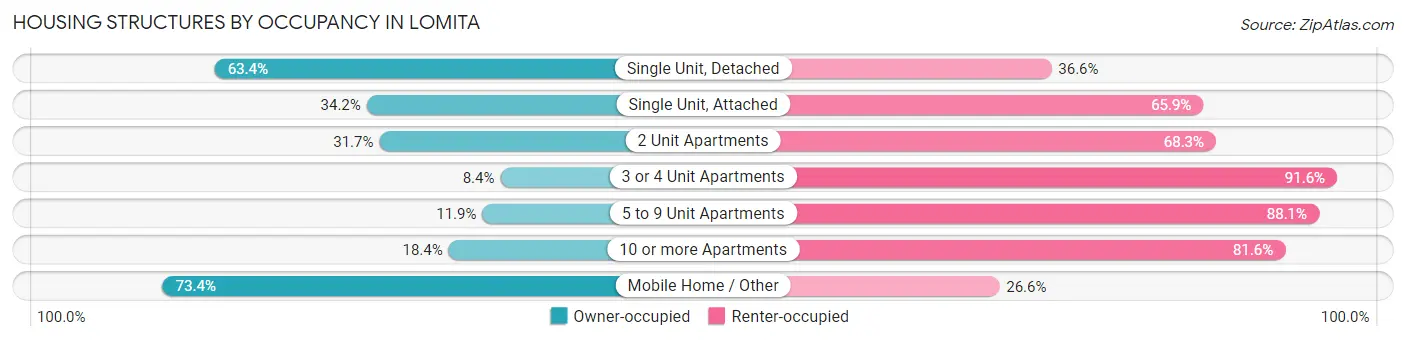
| Structure Type | Owner-occupied | Renter-occupied |
| Single Unit, Detached | 2,719 (63.4%) | 1,571 (36.6%) |
| Single Unit, Attached | 167 (34.2%) | 322 (65.8%) |
| 2 Unit Apartments | 26 (31.7%) | 56 (68.3%) |
| 3 or 4 Unit Apartments | 29 (8.4%) | 316 (91.6%) |
| 5 to 9 Unit Apartments | 72 (11.9%) | 534 (88.1%) |
| 10 or more Apartments | 301 (18.4%) | 1,337 (81.6%) |
| Mobile Home / Other | 323 (73.4%) | 117 (26.6%) |
| Total | 3,637 (46.1%) | 4,253 (53.9%) |
Housing Structures by Number of Rooms in Lomita
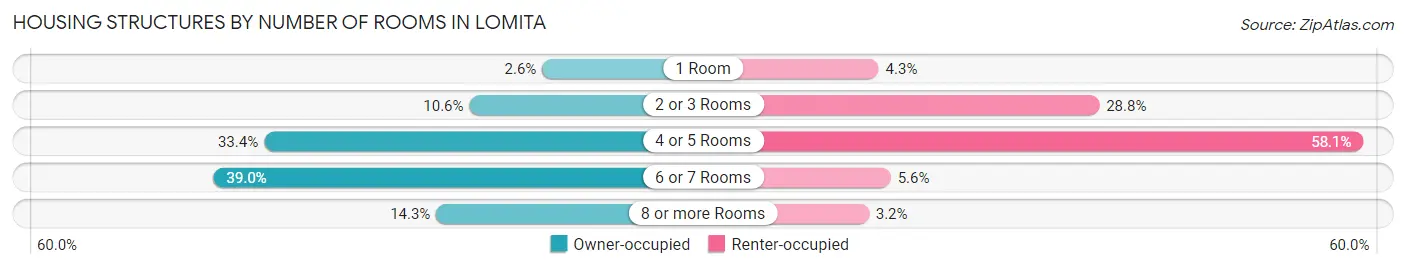
| Number of Rooms | Owner-occupied | Renter-occupied |
| 1 Room | 93 (2.6%) | 183 (4.3%) |
| 2 or 3 Rooms | 387 (10.6%) | 1,224 (28.8%) |
| 4 or 5 Rooms | 1,216 (33.4%) | 2,470 (58.1%) |
| 6 or 7 Rooms | 1,420 (39.0%) | 240 (5.6%) |
| 8 or more Rooms | 521 (14.3%) | 136 (3.2%) |
| Total | 3,637 (100.0%) | 4,253 (100.0%) |
Housing Structure by Heating Type in Lomita
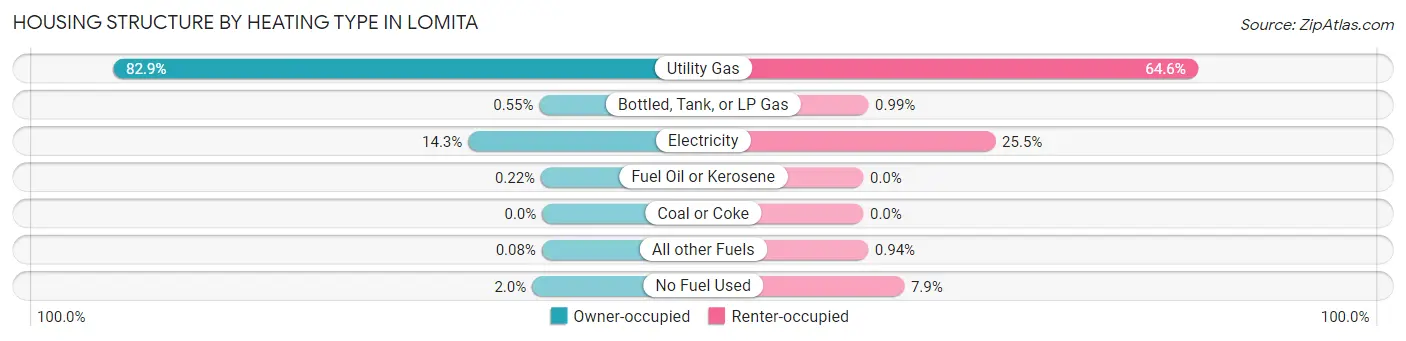
| Heating Type | Owner-occupied | Renter-occupied |
| Utility Gas | 3,015 (82.9%) | 2,749 (64.6%) |
| Bottled, Tank, or LP Gas | 20 (0.5%) | 42 (1.0%) |
| Electricity | 520 (14.3%) | 1,086 (25.5%) |
| Fuel Oil or Kerosene | 8 (0.2%) | 0 (0.0%) |
| Coal or Coke | 0 (0.0%) | 0 (0.0%) |
| All other Fuels | 3 (0.1%) | 40 (0.9%) |
| No Fuel Used | 71 (1.9%) | 336 (7.9%) |
| Total | 3,637 (100.0%) | 4,253 (100.0%) |
Household Vehicle Usage in Lomita
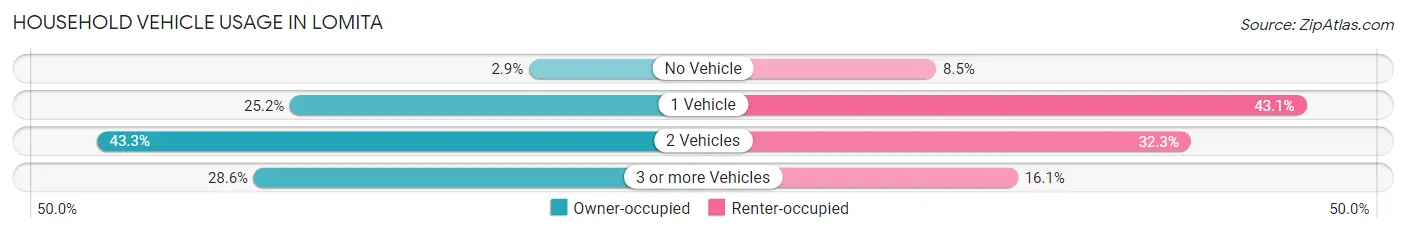
| Vehicles per Household | Owner-occupied | Renter-occupied |
| No Vehicle | 106 (2.9%) | 362 (8.5%) |
| 1 Vehicle | 917 (25.2%) | 1,832 (43.1%) |
| 2 Vehicles | 1,574 (43.3%) | 1,373 (32.3%) |
| 3 or more Vehicles | 1,040 (28.6%) | 686 (16.1%) |
| Total | 3,637 (100.0%) | 4,253 (100.0%) |
Real Estate & Mortgages in Lomita
Real Estate and Mortgage Overview in Lomita
| Characteristic | Without Mortgage | With Mortgage |
| Housing Units | 1,253 | 2,384 |
| Median Property Value | $632,400 | $767,000 |
| Median Household Income | $68,953 | $1,292 |
| Monthly Housing Costs | $715 | $1,121 |
| Real Estate Taxes | $4,080 | $67 |
Property Value by Mortgage Status in Lomita
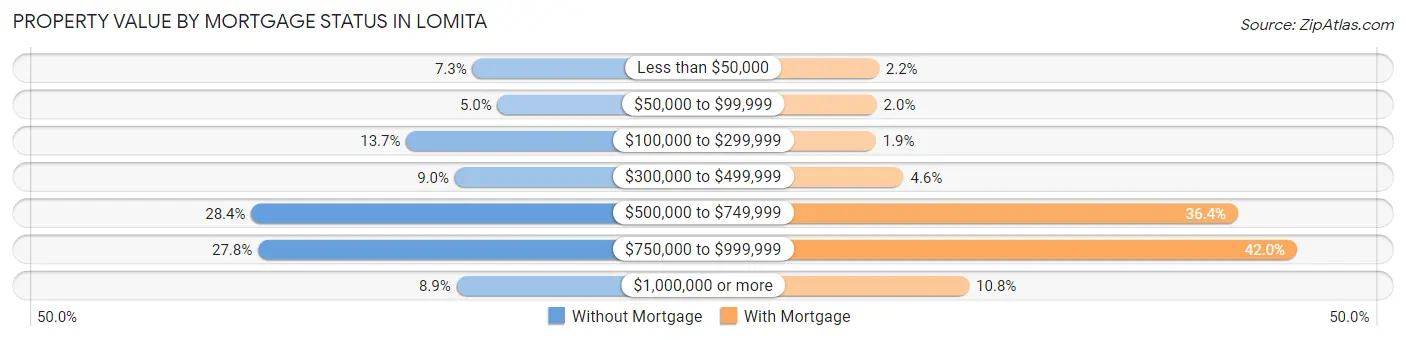
| Property Value | Without Mortgage | With Mortgage |
| Less than $50,000 | 92 (7.3%) | 53 (2.2%) |
| $50,000 to $99,999 | 62 (5.0%) | 48 (2.0%) |
| $100,000 to $299,999 | 171 (13.7%) | 46 (1.9%) |
| $300,000 to $499,999 | 113 (9.0%) | 109 (4.6%) |
| $500,000 to $749,999 | 356 (28.4%) | 868 (36.4%) |
| $750,000 to $999,999 | 348 (27.8%) | 1,002 (42.0%) |
| $1,000,000 or more | 111 (8.9%) | 258 (10.8%) |
| Total | 1,253 (100.0%) | 2,384 (100.0%) |
Household Income by Mortgage Status in Lomita
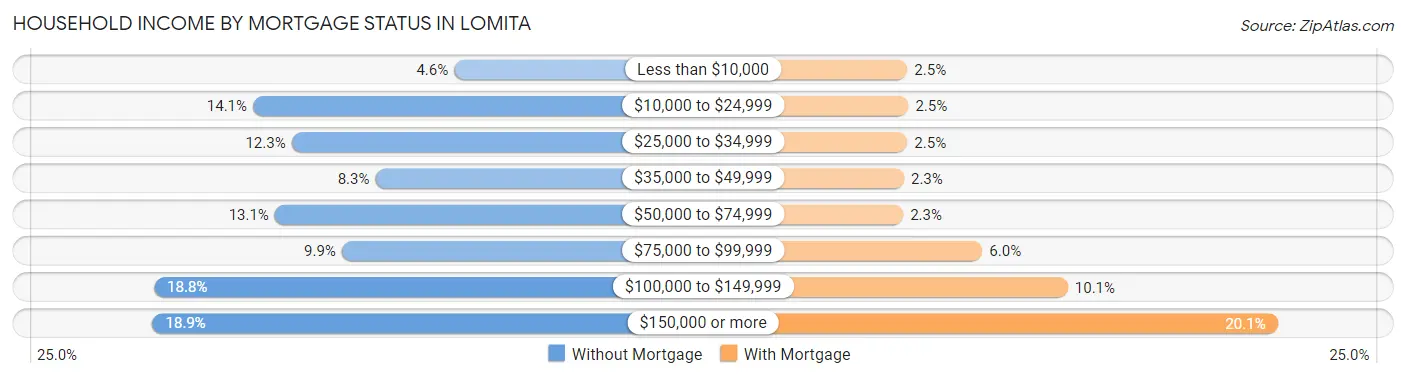
| Household Income | Without Mortgage | With Mortgage |
| Less than $10,000 | 57 (4.5%) | 59 (2.5%) |
| $10,000 to $24,999 | 177 (14.1%) | 60 (2.5%) |
| $25,000 to $34,999 | 154 (12.3%) | 59 (2.5%) |
| $35,000 to $49,999 | 104 (8.3%) | 55 (2.3%) |
| $50,000 to $74,999 | 164 (13.1%) | 54 (2.3%) |
| $75,000 to $99,999 | 124 (9.9%) | 144 (6.0%) |
| $100,000 to $149,999 | 236 (18.8%) | 241 (10.1%) |
| $150,000 or more | 237 (18.9%) | 479 (20.1%) |
| Total | 1,253 (100.0%) | 2,384 (100.0%) |
Property Value to Household Income Ratio in Lomita
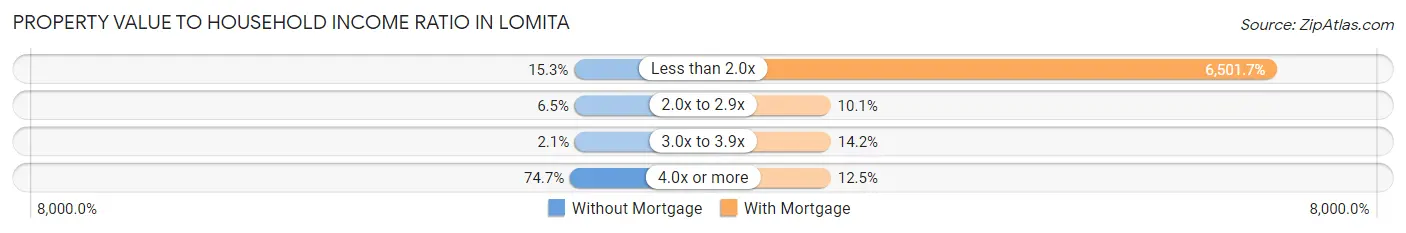
| Value-to-Income Ratio | Without Mortgage | With Mortgage |
| Less than 2.0x | 192 (15.3%) | 155,000 (6,501.7%) |
| 2.0x to 2.9x | 81 (6.5%) | 241 (10.1%) |
| 3.0x to 3.9x | 26 (2.1%) | 338 (14.2%) |
| 4.0x or more | 936 (74.7%) | 298 (12.5%) |
| Total | 1,253 (100.0%) | 2,384 (100.0%) |
Real Estate Taxes by Mortgage Status in Lomita
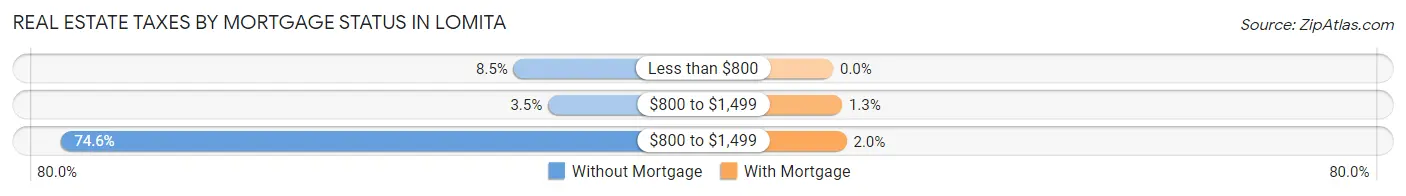
| Property Taxes | Without Mortgage | With Mortgage |
| Less than $800 | 107 (8.5%) | 0 (0.0%) |
| $800 to $1,499 | 44 (3.5%) | 31 (1.3%) |
| $800 to $1,499 | 935 (74.6%) | 47 (2.0%) |
| Total | 1,253 (100.0%) | 2,384 (100.0%) |
Health & Disability in Lomita
Health Insurance Coverage by Age in Lomita
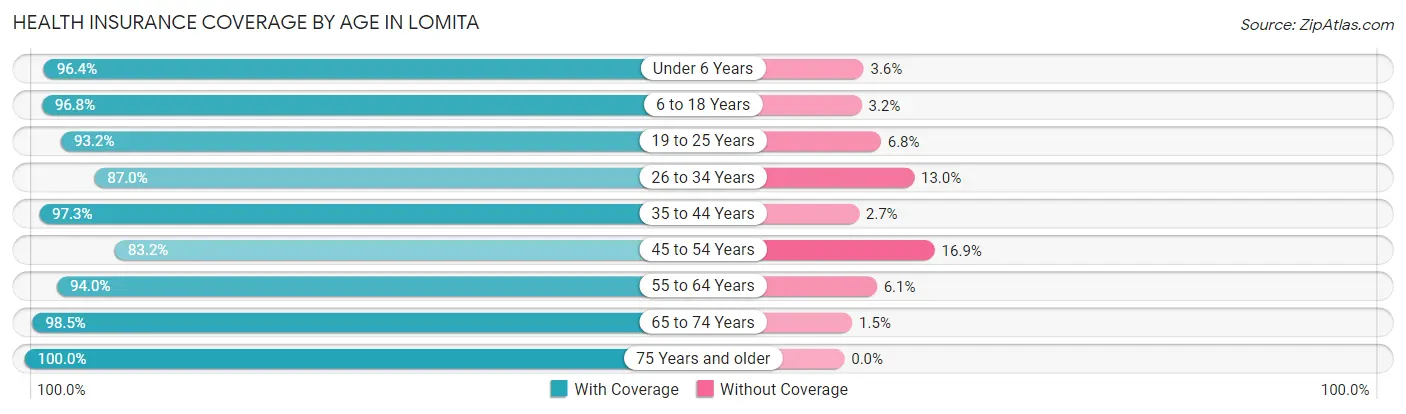
| Age Bracket | With Coverage | Without Coverage |
| Under 6 Years | 1,503 (96.4%) | 56 (3.6%) |
| 6 to 18 Years | 2,743 (96.8%) | 91 (3.2%) |
| 19 to 25 Years | 1,646 (93.2%) | 120 (6.8%) |
| 26 to 34 Years | 2,360 (87.0%) | 353 (13.0%) |
| 35 to 44 Years | 2,408 (97.3%) | 67 (2.7%) |
| 45 to 54 Years | 2,013 (83.2%) | 408 (16.9%) |
| 55 to 64 Years | 2,906 (94.0%) | 187 (6.0%) |
| 65 to 74 Years | 2,617 (98.5%) | 39 (1.5%) |
| 75 Years and older | 1,036 (100.0%) | 0 (0.0%) |
| Total | 19,232 (93.6%) | 1,321 (6.4%) |
Health Insurance Coverage by Citizenship Status in Lomita
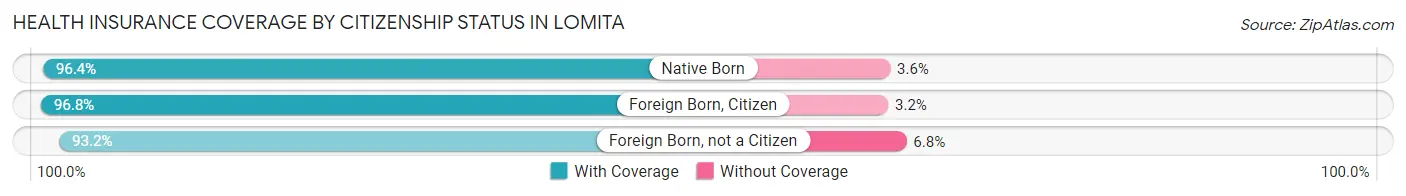
| Citizenship Status | With Coverage | Without Coverage |
| Native Born | 1,503 (96.4%) | 56 (3.6%) |
| Foreign Born, Citizen | 2,743 (96.8%) | 91 (3.2%) |
| Foreign Born, not a Citizen | 1,646 (93.2%) | 120 (6.8%) |
Health Insurance Coverage by Household Income in Lomita
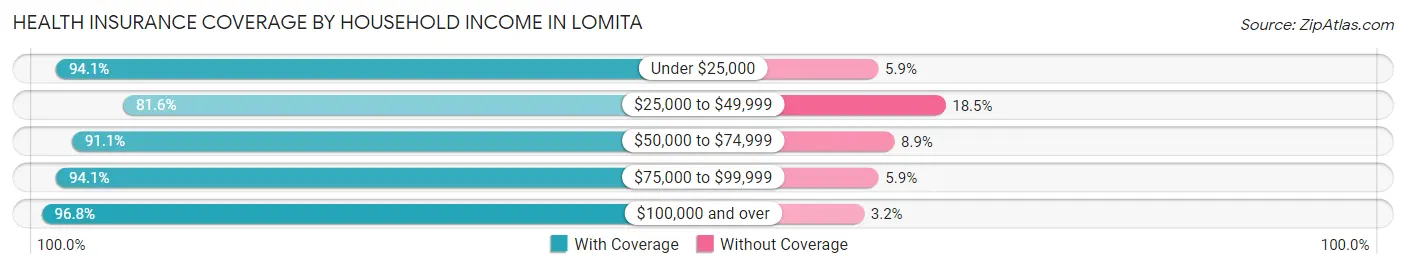
| Household Income | With Coverage | Without Coverage |
| Under $25,000 | 1,968 (94.1%) | 123 (5.9%) |
| $25,000 to $49,999 | 2,046 (81.6%) | 463 (18.4%) |
| $50,000 to $74,999 | 2,744 (91.1%) | 267 (8.9%) |
| $75,000 to $99,999 | 1,876 (94.1%) | 118 (5.9%) |
| $100,000 and over | 10,504 (96.8%) | 347 (3.2%) |
Public vs Private Health Insurance Coverage by Age in Lomita
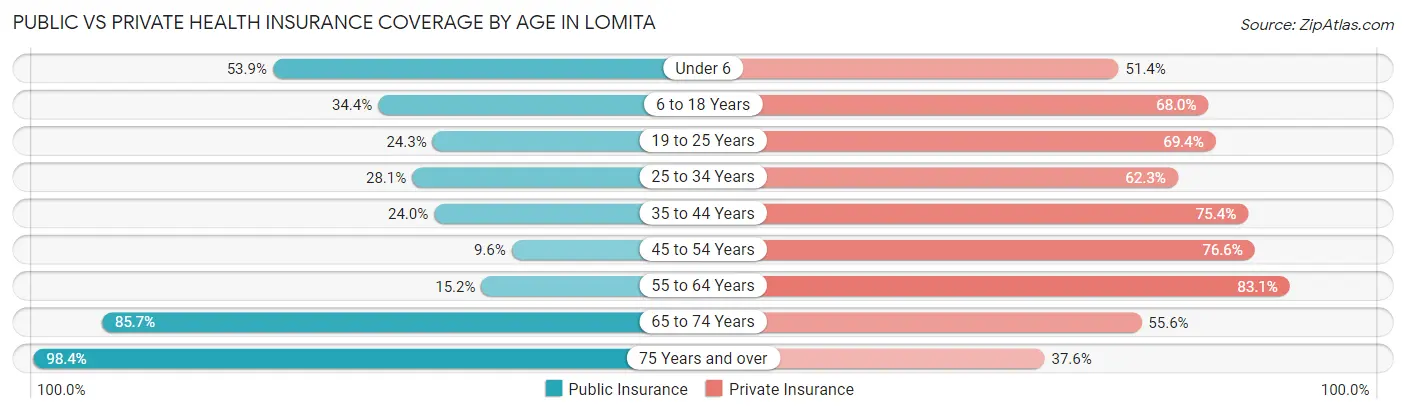
| Age Bracket | Public Insurance | Private Insurance |
| Under 6 | 841 (53.9%) | 801 (51.4%) |
| 6 to 18 Years | 975 (34.4%) | 1,928 (68.0%) |
| 19 to 25 Years | 429 (24.3%) | 1,225 (69.4%) |
| 25 to 34 Years | 762 (28.1%) | 1,691 (62.3%) |
| 35 to 44 Years | 594 (24.0%) | 1,866 (75.4%) |
| 45 to 54 Years | 233 (9.6%) | 1,855 (76.6%) |
| 55 to 64 Years | 471 (15.2%) | 2,571 (83.1%) |
| 65 to 74 Years | 2,275 (85.7%) | 1,477 (55.6%) |
| 75 Years and over | 1,019 (98.4%) | 390 (37.6%) |
| Total | 7,599 (37.0%) | 13,804 (67.2%) |
Disability Status by Sex by Age in Lomita
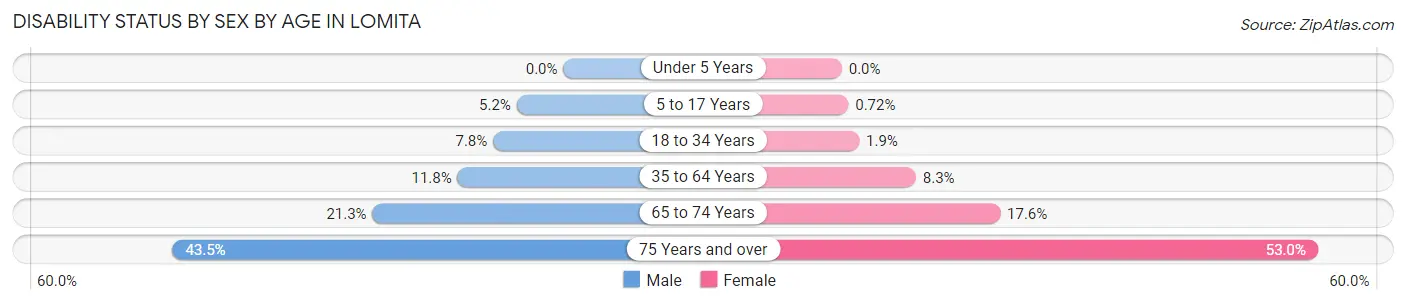
| Age Bracket | Male | Female |
| Under 5 Years | 0 (0.0%) | 0 (0.0%) |
| 5 to 17 Years | 81 (5.2%) | 9 (0.7%) |
| 18 to 34 Years | 182 (7.8%) | 46 (1.9%) |
| 35 to 64 Years | 466 (11.8%) | 333 (8.3%) |
| 65 to 74 Years | 256 (21.3%) | 256 (17.6%) |
| 75 Years and over | 212 (43.5%) | 291 (53.0%) |
Disability Class by Sex by Age in Lomita
Disability Class: Hearing Difficulty
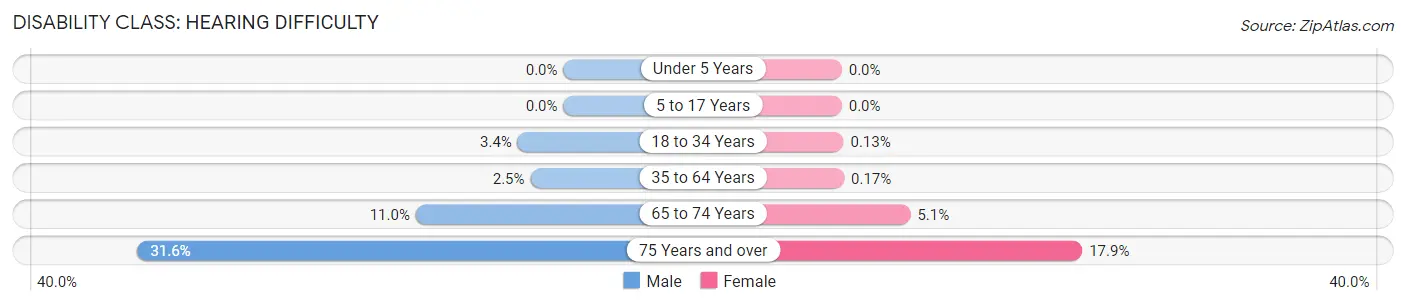
| Age Bracket | Male | Female |
| Under 5 Years | 0 (0.0%) | 0 (0.0%) |
| 5 to 17 Years | 0 (0.0%) | 0 (0.0%) |
| 18 to 34 Years | 79 (3.4%) | 3 (0.1%) |
| 35 to 64 Years | 97 (2.5%) | 7 (0.2%) |
| 65 to 74 Years | 132 (11.0%) | 74 (5.1%) |
| 75 Years and over | 154 (31.6%) | 98 (17.8%) |
Disability Class: Vision Difficulty
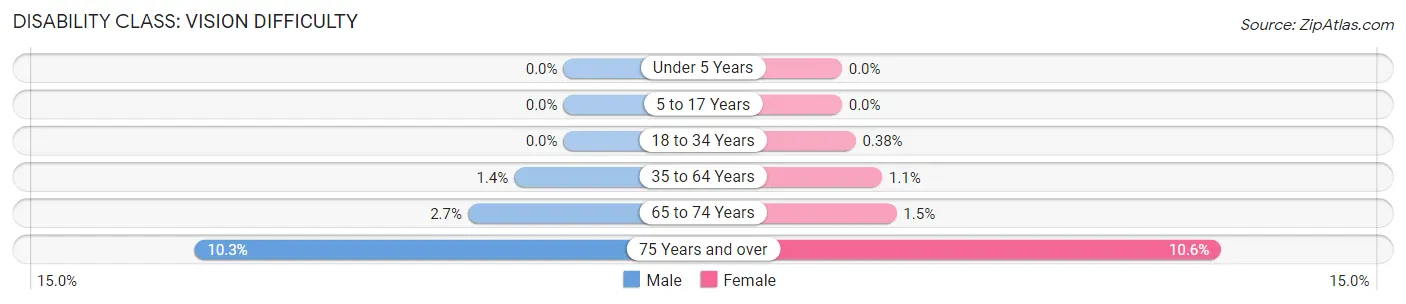
| Age Bracket | Male | Female |
| Under 5 Years | 0 (0.0%) | 0 (0.0%) |
| 5 to 17 Years | 0 (0.0%) | 0 (0.0%) |
| 18 to 34 Years | 0 (0.0%) | 9 (0.4%) |
| 35 to 64 Years | 54 (1.4%) | 45 (1.1%) |
| 65 to 74 Years | 32 (2.7%) | 22 (1.5%) |
| 75 Years and over | 50 (10.3%) | 58 (10.6%) |
Disability Class: Cognitive Difficulty
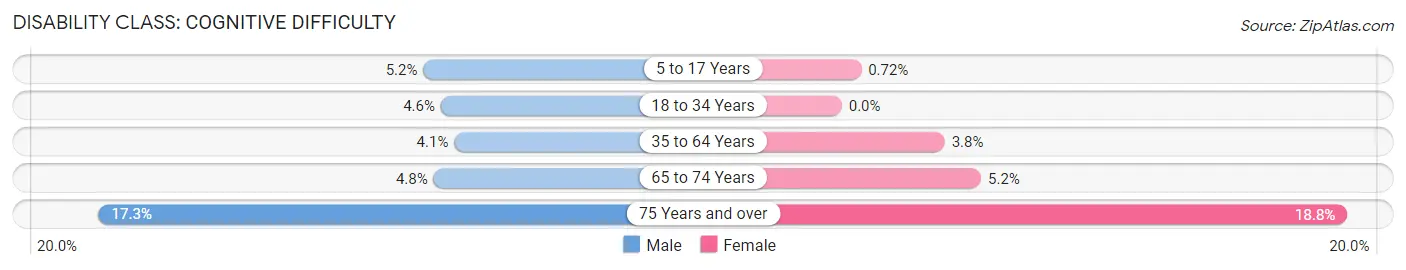
| Age Bracket | Male | Female |
| 5 to 17 Years | 81 (5.2%) | 9 (0.7%) |
| 18 to 34 Years | 106 (4.5%) | 0 (0.0%) |
| 35 to 64 Years | 160 (4.1%) | 154 (3.8%) |
| 65 to 74 Years | 58 (4.8%) | 75 (5.2%) |
| 75 Years and over | 84 (17.2%) | 103 (18.8%) |
Disability Class: Ambulatory Difficulty
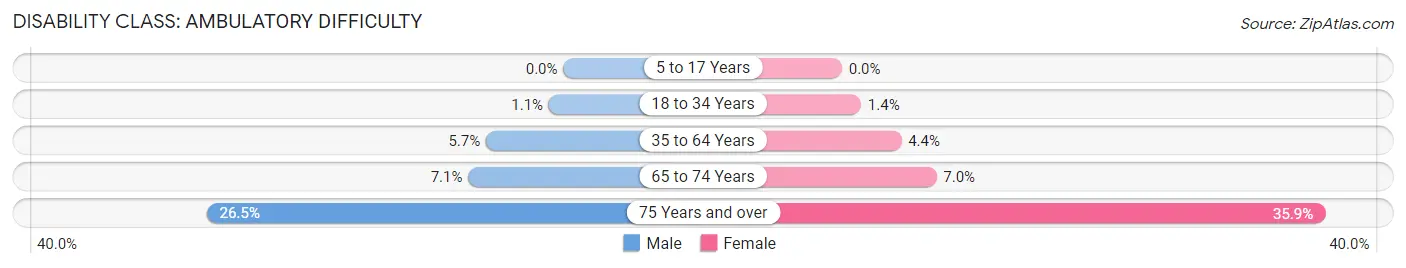
| Age Bracket | Male | Female |
| 5 to 17 Years | 0 (0.0%) | 0 (0.0%) |
| 18 to 34 Years | 25 (1.1%) | 34 (1.4%) |
| 35 to 64 Years | 227 (5.7%) | 178 (4.4%) |
| 65 to 74 Years | 85 (7.1%) | 102 (7.0%) |
| 75 Years and over | 129 (26.5%) | 197 (35.9%) |
Disability Class: Self-Care Difficulty
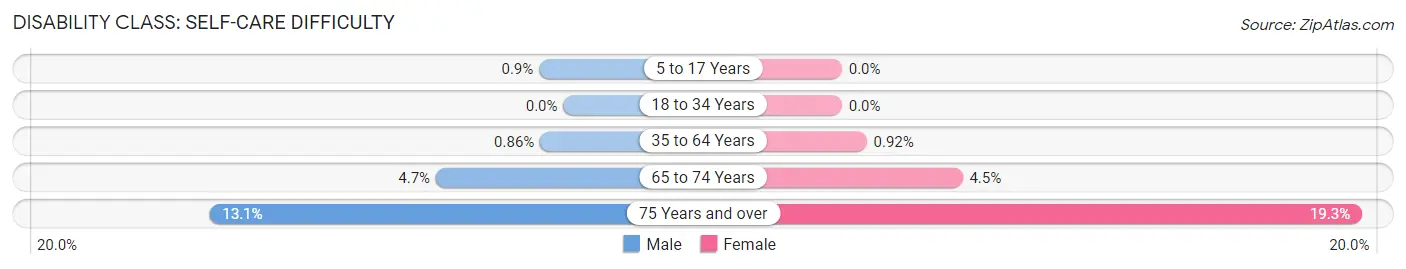
| Age Bracket | Male | Female |
| 5 to 17 Years | 14 (0.9%) | 0 (0.0%) |
| 18 to 34 Years | 0 (0.0%) | 0 (0.0%) |
| 35 to 64 Years | 34 (0.9%) | 37 (0.9%) |
| 65 to 74 Years | 57 (4.7%) | 65 (4.5%) |
| 75 Years and over | 64 (13.1%) | 106 (19.3%) |
Technology Access in Lomita
Computing Device Access in Lomita
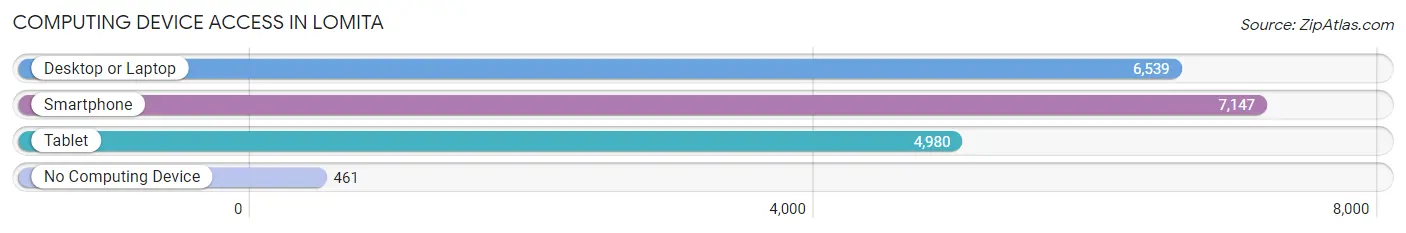
| Device Type | # Households | % Households |
| Desktop or Laptop | 6,539 | 82.9% |
| Smartphone | 7,147 | 90.6% |
| Tablet | 4,980 | 63.1% |
| No Computing Device | 461 | 5.8% |
| Total | 7,890 | 100.0% |
Internet Access in Lomita
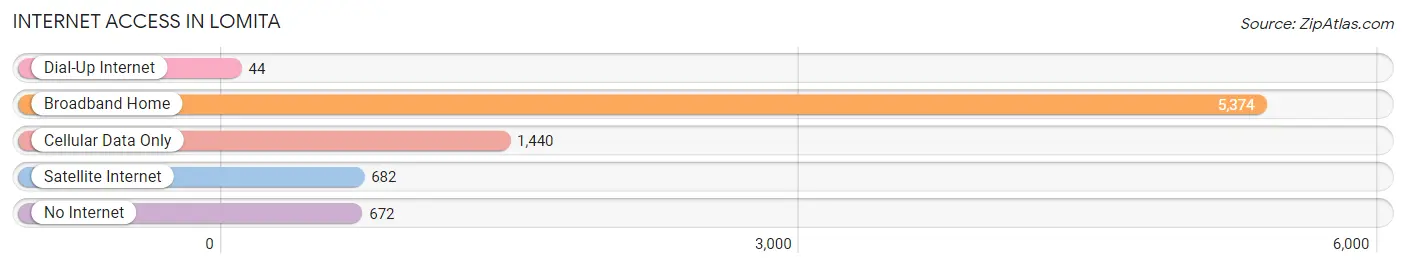
| Internet Type | # Households | % Households |
| Dial-Up Internet | 44 | 0.6% |
| Broadband Home | 5,374 | 68.1% |
| Cellular Data Only | 1,440 | 18.2% |
| Satellite Internet | 682 | 8.6% |
| No Internet | 672 | 8.5% |
| Total | 7,890 | 100.0% |
Lomita Summary
Lomita is a city located in the South Bay region of Los Angeles County, California. It is bordered by the cities of Torrance, Rolling Hills Estates, and Rancho Palos Verdes. The population of Lomita was 20,256 at the 2010 census.
History
The area that is now Lomita was originally part of the Rancho San Pedro land grant, which was granted to Juan Jose Dominguez by the Spanish Empire in 1784. The area was later part of the Bixby Ranch, which was owned by the Bixby family. In the early 1900s, the area was subdivided and sold to farmers and ranchers.
In 1923, the Lomita Railroad was built to connect the area to the rest of Los Angeles County. The railroad was later acquired by the Union Pacific Railroad and is still in operation today.
In the 1950s, the area began to experience rapid growth as the population of Los Angeles County increased. The city of Lomita was incorporated in 1964.
Geography
Lomita is located in the South Bay region of Los Angeles County. It is bordered by the cities of Torrance, Rolling Hills Estates, and Rancho Palos Verdes. The city covers an area of 5.2 square miles and has a population of 20,256.
The city is located on the Palos Verdes Peninsula, which is a hilly area with elevations ranging from sea level to over 1,000 feet. The highest point in the city is at the intersection of Narbonne Avenue and Lomita Boulevard, which is 1,096 feet above sea level.
The climate in Lomita is mild and temperate. The average high temperature in the summer is 78°F and the average low temperature in the winter is 48°F.
Economy
The economy of Lomita is largely based on the service industry. The city is home to a variety of restaurants, retail stores, and other businesses. The city also has a number of manufacturing and industrial businesses.
The largest employers in the city are the Los Angeles County Sheriff's Department, the Los Angeles Unified School District, and the Torrance Memorial Medical Center.
Demographics
As of the 2010 census, the population of Lomita was 20,256. The racial makeup of the city was 57.3% White, 11.2% African American, 0.7% Native American, 17.2% Asian, 0.3% Pacific Islander, 8.2% from other races, and 5.3% from two or more races. Hispanic or Latino of any race were 22.3% of the population.
The median household income in Lomita was $60,945 and the median family income was $68,845. The per capita income was $27,845. About 8.2% of the population was below the poverty line.
Conclusion
Lomita is a city located in the South Bay region of Los Angeles County, California. It is bordered by the cities of Torrance, Rolling Hills Estates, and Rancho Palos Verdes. The population of Lomita was 20,256 at the 2010 census. The economy of Lomita is largely based on the service industry and the largest employers in the city are the Los Angeles County Sheriff's Department, the Los Angeles Unified School District, and the Torrance Memorial Medical Center. The racial makeup of the city was 57.3% White, 11.2% African American, 0.7% Native American, 17.2% Asian, 0.3% Pacific Islander, 8.2% from other races, and 5.3% from two or more races. Hispanic or Latino of any race were 22.3% of the population. The median household income in Lomita was $60,945 and the median family income was $68,845. The per capita income was $27,845. About 8.2% of the population was below the poverty line.
Common Questions
What is Per Capita Income in Lomita?
Per Capita income in Lomita is $46,488.
What is the Median Family Income in Lomita?
Median Family Income in Lomita is $116,077.
What is the Median Household income in Lomita?
Median Household Income in Lomita is $87,717.
What is Income or Wage Gap in Lomita?
Income or Wage Gap in Lomita is 21.6%.
Women in Lomita earn 78.4 cents for every dollar earned by a man.
What is Family Income Deficit in Lomita?
Family Income Deficit in Lomita is $9,431.
Families that are below poverty line in Lomita earn $9,431 less on average than the poverty threshold level.
What is Inequality or Gini Index in Lomita?
Inequality or Gini Index in Lomita is 0.47.
What is the Total Population of Lomita?
Total Population of Lomita is 20,662.
What is the Total Male Population of Lomita?
Total Male Population of Lomita is 10,143.
What is the Total Female Population of Lomita?
Total Female Population of Lomita is 10,519.
What is the Ratio of Males per 100 Females in Lomita?
There are 96.43 Males per 100 Females in Lomita.
What is the Ratio of Females per 100 Males in Lomita?
There are 103.71 Females per 100 Males in Lomita.
What is the Median Population Age in Lomita?
Median Population Age in Lomita is 40.5 Years.
What is the Average Family Size in Lomita
Average Family Size in Lomita is 3.2 People.
What is the Average Household Size in Lomita
Average Household Size in Lomita is 2.6 People.
How Large is the Labor Force in Lomita?
There are 11,487 People in the Labor Forcein in Lomita.
What is the Percentage of People in the Labor Force in Lomita?
67.2% of People are in the Labor Force in Lomita.
What is the Unemployment Rate in Lomita?
Unemployment Rate in Lomita is 3.4%.