Cities with the Highest Percentage of Households With Three or more Vehicles in Georgia
RELATED REPORTS & OPTIONS
Households with 3 or more Cars
Georgia
Compare Cities
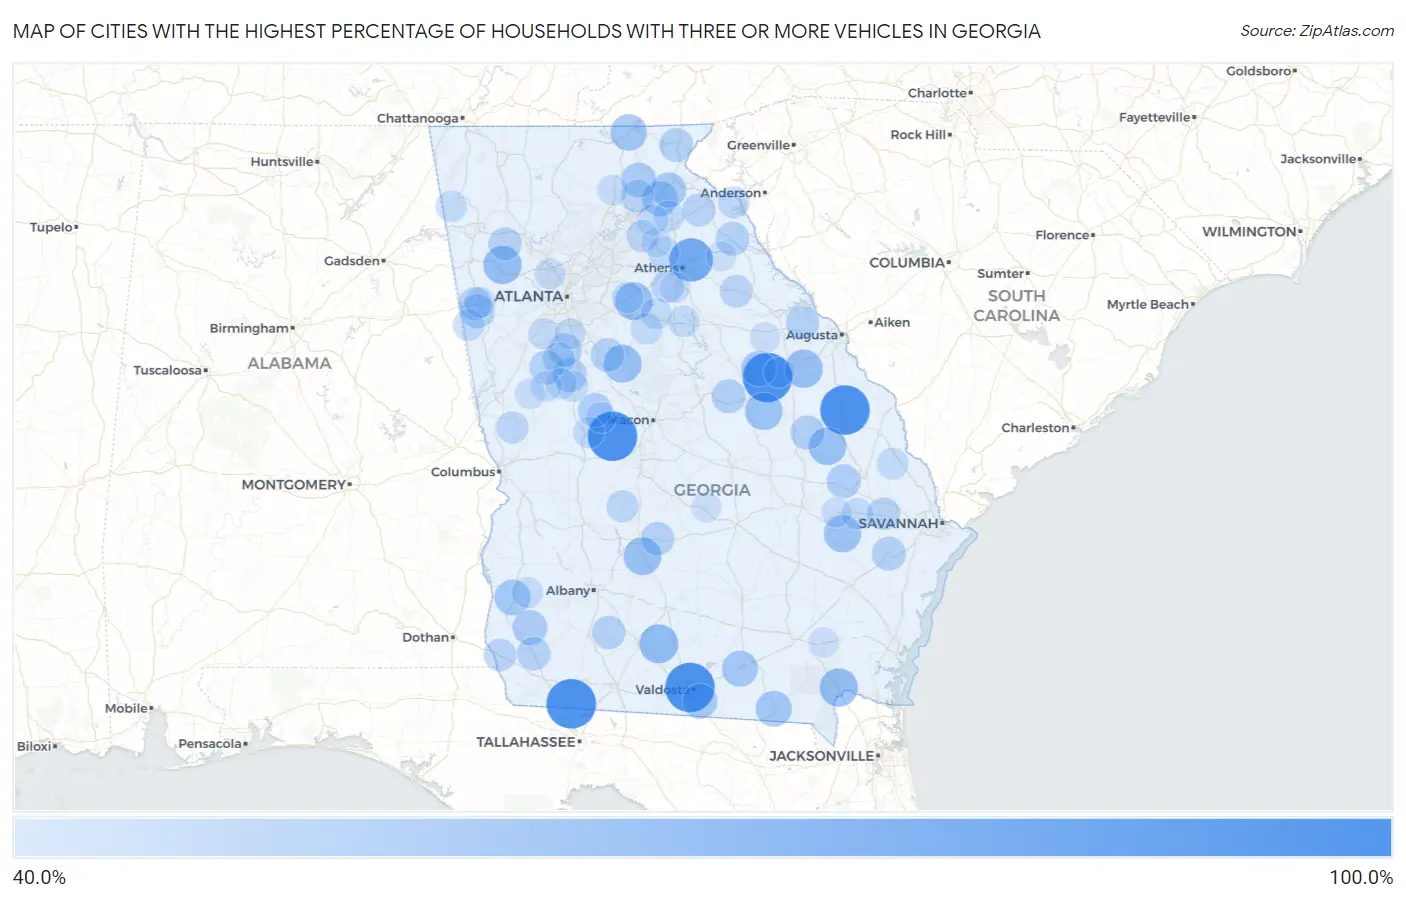
Map of Cities with the Highest Percentage of Households With Three or more Vehicles in Georgia
0.0%
100.0%
Cities with the Highest Percentage of Households With Three or more Vehicles in Georgia
| City | Housholds With 3+ Cars | vs State | vs National | |
| 1. | Remerton | 100.0% | 31.1%(+68.9)#1 | 29.0%(+71.0)#7 |
| 2. | Hortense | 100.0% | 31.1%(+68.9)#2 | 29.0%(+71.0)#32 |
| 3. | Knoxville | 100.0% | 31.1%(+68.9)#3 | 29.0%(+71.0)#142 |
| 4. | Perkins | 100.0% | 31.1%(+68.9)#4 | 29.0%(+71.0)#149 |
| 5. | Calvary | 100.0% | 31.1%(+68.9)#5 | 29.0%(+71.0)#179 |
| 6. | Cogdell | 100.0% | 31.1%(+68.9)#6 | 29.0%(+71.0)#296 |
| 7. | Edge Hill | 100.0% | 31.1%(+68.9)#7 | 29.0%(+71.0)#319 |
| 8. | Mershon | 100.0% | 31.1%(+68.9)#8 | 29.0%(+71.0)#329 |
| 9. | Hull | 81.8% | 31.1%(+50.7)#9 | 29.0%(+52.8)#546 |
| 10. | Antioch | 78.8% | 31.1%(+47.7)#10 | 29.0%(+49.8)#619 |
| 11. | Manor | 76.9% | 31.1%(+45.8)#11 | 29.0%(+47.9)#666 |
| 12. | Ellenton | 68.3% | 31.1%(+37.2)#12 | 29.0%(+39.3)#971 |
| 13. | Dixie | 67.9% | 31.1%(+36.8)#13 | 29.0%(+38.9)#997 |
| 14. | Braswell | 66.3% | 31.1%(+35.2)#14 | 29.0%(+37.3)#1,105 |
| 15. | Folkston | 66.1% | 31.1%(+35.0)#15 | 29.0%(+37.1)#1,115 |
| 16. | Matthews | 66.0% | 31.1%(+34.9)#16 | 29.0%(+37.0)#1,124 |
| 17. | Flovilla | 64.8% | 31.1%(+33.7)#17 | 29.0%(+35.8)#1,187 |
| 18. | Arabi | 64.7% | 31.1%(+33.6)#18 | 29.0%(+35.7)#1,193 |
| 19. | Jersey | 64.7% | 31.1%(+33.6)#19 | 29.0%(+35.7)#1,201 |
| 20. | Garfield | 64.4% | 31.1%(+33.3)#20 | 29.0%(+35.4)#1,223 |
| 21. | Riddleville | 63.9% | 31.1%(+32.8)#21 | 29.0%(+34.9)#1,260 |
| 22. | Cataula | 63.4% | 31.1%(+32.3)#22 | 29.0%(+34.4)#1,292 |
| 23. | Mendes | 63.2% | 31.1%(+32.1)#23 | 29.0%(+34.2)#1,308 |
| 24. | Axson | 62.2% | 31.1%(+31.1)#24 | 29.0%(+33.2)#1,398 |
| 25. | Young Harris | 60.9% | 31.1%(+29.8)#25 | 29.0%(+31.9)#1,527 |
| 26. | Fargo | 59.6% | 31.1%(+28.5)#26 | 29.0%(+30.6)#1,681 |
| 27. | Du Pont | 59.5% | 31.1%(+28.4)#27 | 29.0%(+30.5)#1,701 |
| 28. | Bluffton | 59.4% | 31.1%(+28.3)#28 | 29.0%(+30.4)#1,708 |
| 29. | Mitchell | 57.6% | 31.1%(+26.5)#29 | 29.0%(+28.6)#1,930 |
| 30. | Alto | 57.1% | 31.1%(+26.0)#30 | 29.0%(+28.1)#1,959 |
| 31. | Mount Airy | 56.9% | 31.1%(+25.8)#31 | 29.0%(+27.9)#2,012 |
| 32. | Dasher | 56.7% | 31.1%(+25.6)#32 | 29.0%(+27.7)#2,041 |
| 33. | Damascus | 56.3% | 31.1%(+25.2)#33 | 29.0%(+27.3)#2,090 |
| 34. | Cleveland | 56.1% | 31.1%(+25.0)#34 | 29.0%(+27.1)#2,120 |
| 35. | Gardi | 55.6% | 31.1%(+24.5)#35 | 29.0%(+26.6)#2,223 |
| 36. | Summertown | 54.0% | 31.1%(+22.9)#36 | 29.0%(+25.0)#2,474 |
| 37. | Yatesville | 53.8% | 31.1%(+22.7)#37 | 29.0%(+24.8)#2,492 |
| 38. | Pulaski | 53.7% | 31.1%(+22.6)#38 | 29.0%(+24.7)#2,523 |
| 39. | Deepstep | 53.7% | 31.1%(+22.6)#39 | 29.0%(+24.7)#2,530 |
| 40. | Williamson | 53.5% | 31.1%(+22.4)#40 | 29.0%(+24.5)#2,562 |
| 41. | Haralson | 53.5% | 31.1%(+22.4)#41 | 29.0%(+24.5)#2,572 |
| 42. | Flemington | 53.4% | 31.1%(+22.3)#42 | 29.0%(+24.4)#2,579 |
| 43. | Dewy Rose | 53.3% | 31.1%(+22.2)#43 | 29.0%(+24.3)#2,601 |
| 44. | Tiger | 53.1% | 31.1%(+22.0)#44 | 29.0%(+24.1)#2,649 |
| 45. | Jenkinsburg | 53.1% | 31.1%(+22.0)#45 | 29.0%(+24.1)#2,652 |
| 46. | Mount Zion | 52.9% | 31.1%(+21.8)#46 | 29.0%(+23.9)#2,683 |
| 47. | Rock Spring | 52.6% | 31.1%(+21.5)#47 | 29.0%(+23.6)#2,743 |
| 48. | Sale City | 52.4% | 31.1%(+21.3)#48 | 29.0%(+23.4)#2,805 |
| 49. | Boykin | 52.2% | 31.1%(+21.1)#49 | 29.0%(+23.2)#2,861 |
| 50. | Woolsey | 52.1% | 31.1%(+21.0)#50 | 29.0%(+23.1)#2,874 |
| 51. | Seville | 52.0% | 31.1%(+20.9)#51 | 29.0%(+23.0)#2,906 |
| 52. | Appling | 51.9% | 31.1%(+20.8)#52 | 29.0%(+22.9)#2,915 |
| 53. | Euharlee | 51.6% | 31.1%(+20.5)#53 | 29.0%(+22.6)#2,959 |
| 54. | Waco | 51.6% | 31.1%(+20.5)#54 | 29.0%(+22.6)#2,967 |
| 55. | Clermont | 50.9% | 31.1%(+19.8)#55 | 29.0%(+21.9)#3,087 |
| 56. | Carnesville | 50.8% | 31.1%(+19.7)#56 | 29.0%(+21.8)#3,108 |
| 57. | North High Shoals | 50.5% | 31.1%(+19.4)#57 | 29.0%(+21.5)#3,176 |
| 58. | Fairplay | 50.3% | 31.1%(+19.2)#58 | 29.0%(+21.3)#3,204 |
| 59. | Pembroke | 50.0% | 31.1%(+18.9)#59 | 29.0%(+21.0)#3,245 |
| 60. | Jakin | 50.0% | 31.1%(+18.9)#60 | 29.0%(+21.0)#3,297 |
| 61. | Rayle | 50.0% | 31.1%(+18.9)#61 | 29.0%(+21.0)#3,317 |
| 62. | Brooks | 49.0% | 31.1%(+17.9)#62 | 29.0%(+20.0)#3,617 |
| 63. | Hamilton | 48.9% | 31.1%(+17.8)#63 | 29.0%(+19.9)#3,635 |
| 64. | Talmo | 48.6% | 31.1%(+17.5)#64 | 29.0%(+19.6)#3,718 |
| 65. | Byromville | 48.4% | 31.1%(+17.3)#65 | 29.0%(+19.4)#3,784 |
| 66. | Reed Creek | 47.7% | 31.1%(+16.6)#66 | 29.0%(+18.7)#3,967 |
| 67. | Arcade | 47.6% | 31.1%(+16.5)#67 | 29.0%(+18.6)#4,001 |
| 68. | Eulonia | 47.6% | 31.1%(+16.5)#68 | 29.0%(+18.6)#4,006 |
| 69. | Bowdon | 47.1% | 31.1%(+16.0)#69 | 29.0%(+18.1)#4,132 |
| 70. | Newborn | 46.9% | 31.1%(+15.8)#70 | 29.0%(+17.9)#4,204 |
| 71. | Oliver | 46.9% | 31.1%(+15.8)#71 | 29.0%(+17.9)#4,211 |
| 72. | Daisy | 46.8% | 31.1%(+15.7)#72 | 29.0%(+17.8)#4,246 |
| 73. | Walnut Grove | 46.4% | 31.1%(+15.3)#73 | 29.0%(+17.4)#4,352 |
| 74. | Gillsville | 46.4% | 31.1%(+15.3)#74 | 29.0%(+17.4)#4,374 |
| 75. | Lyerly | 46.3% | 31.1%(+15.2)#75 | 29.0%(+17.3)#4,403 |
| 76. | Buckhead | 46.3% | 31.1%(+15.2)#76 | 29.0%(+17.3)#4,408 |
| 77. | Salem | 46.2% | 31.1%(+15.1)#77 | 29.0%(+17.2)#4,434 |
| 78. | Homer | 46.1% | 31.1%(+15.0)#78 | 29.0%(+17.1)#4,477 |
| 79. | Tyrone | 45.9% | 31.1%(+14.8)#79 | 29.0%(+16.9)#4,521 |
| 80. | Rutledge | 45.9% | 31.1%(+14.8)#80 | 29.0%(+16.9)#4,532 |
| 81. | Echols County Consolidated Government | 45.7% | 31.1%(+14.6)#81 | 29.0%(+16.7)#4,598 |
| 82. | Zebulon | 45.7% | 31.1%(+14.6)#82 | 29.0%(+16.7)#4,601 |
| 83. | Irondale | 45.2% | 31.1%(+14.1)#83 | 29.0%(+16.2)#4,768 |
| 84. | Edison | 45.1% | 31.1%(+14.0)#84 | 29.0%(+16.1)#4,816 |
| 85. | Bremen | 45.0% | 31.1%(+13.9)#85 | 29.0%(+16.0)#4,841 |
| 86. | Hilltop | 44.9% | 31.1%(+13.8)#86 | 29.0%(+15.9)#4,907 |
| 87. | Fair Oaks | 44.8% | 31.1%(+13.7)#87 | 29.0%(+15.8)#4,912 |
| 88. | Bishop | 44.5% | 31.1%(+13.4)#88 | 29.0%(+15.5)#5,026 |
| 89. | Culloden | 44.4% | 31.1%(+13.3)#89 | 29.0%(+15.4)#5,061 |
| 90. | Gay | 44.4% | 31.1%(+13.3)#90 | 29.0%(+15.4)#5,081 |
| 91. | Dahlonega | 44.3% | 31.1%(+13.2)#91 | 29.0%(+15.3)#5,098 |
| 92. | Avera | 44.2% | 31.1%(+13.1)#92 | 29.0%(+15.2)#5,161 |
| 93. | Camak | 44.0% | 31.1%(+12.9)#93 | 29.0%(+15.0)#5,231 |
| 94. | Greenville | 43.6% | 31.1%(+12.5)#94 | 29.0%(+14.6)#5,406 |
| 95. | Cusseta Chattahoochee County Unified Government | 43.5% | 31.1%(+12.4)#95 | 29.0%(+14.5)#5,425 |
| 96. | Manassas | 43.5% | 31.1%(+12.4)#96 | 29.0%(+14.5)#5,463 |
| 97. | Hoboken | 43.3% | 31.1%(+12.2)#97 | 29.0%(+14.3)#5,525 |
| 98. | Carlton | 43.0% | 31.1%(+11.9)#98 | 29.0%(+14.0)#5,648 |
| 99. | Jefferson | 42.9% | 31.1%(+11.8)#99 | 29.0%(+13.9)#5,654 |
| 100. | Eastman | 42.7% | 31.1%(+11.6)#100 | 29.0%(+13.7)#5,752 |
Common Questions
What are the Top 10 Cities with the Highest Percentage of Households With Three or more Vehicles in Georgia?
Top 10 Cities with the Highest Percentage of Households With Three or more Vehicles in Georgia are:
What city has the Highest Percentage of Households With Three or more Vehicles in Georgia?
Remerton has the Highest Percentage of Households With Three or more Vehicles in Georgia with 100.0%.
What is the Percentage of Households With Three or more Vehicles in the State of Georgia?
Percentage of Households With Three or more Vehicles in Georgia is 31.1%.
What is the Percentage of Households With Three or more Vehicles in the United States?
Percentage of Households With Three or more Vehicles in the United States is 29.0%.