Cities with the Highest Percentage of Households With Three or more Vehicles in Vermont
RELATED REPORTS & OPTIONS
Households with 3 or more Cars
Vermont
Compare Cities
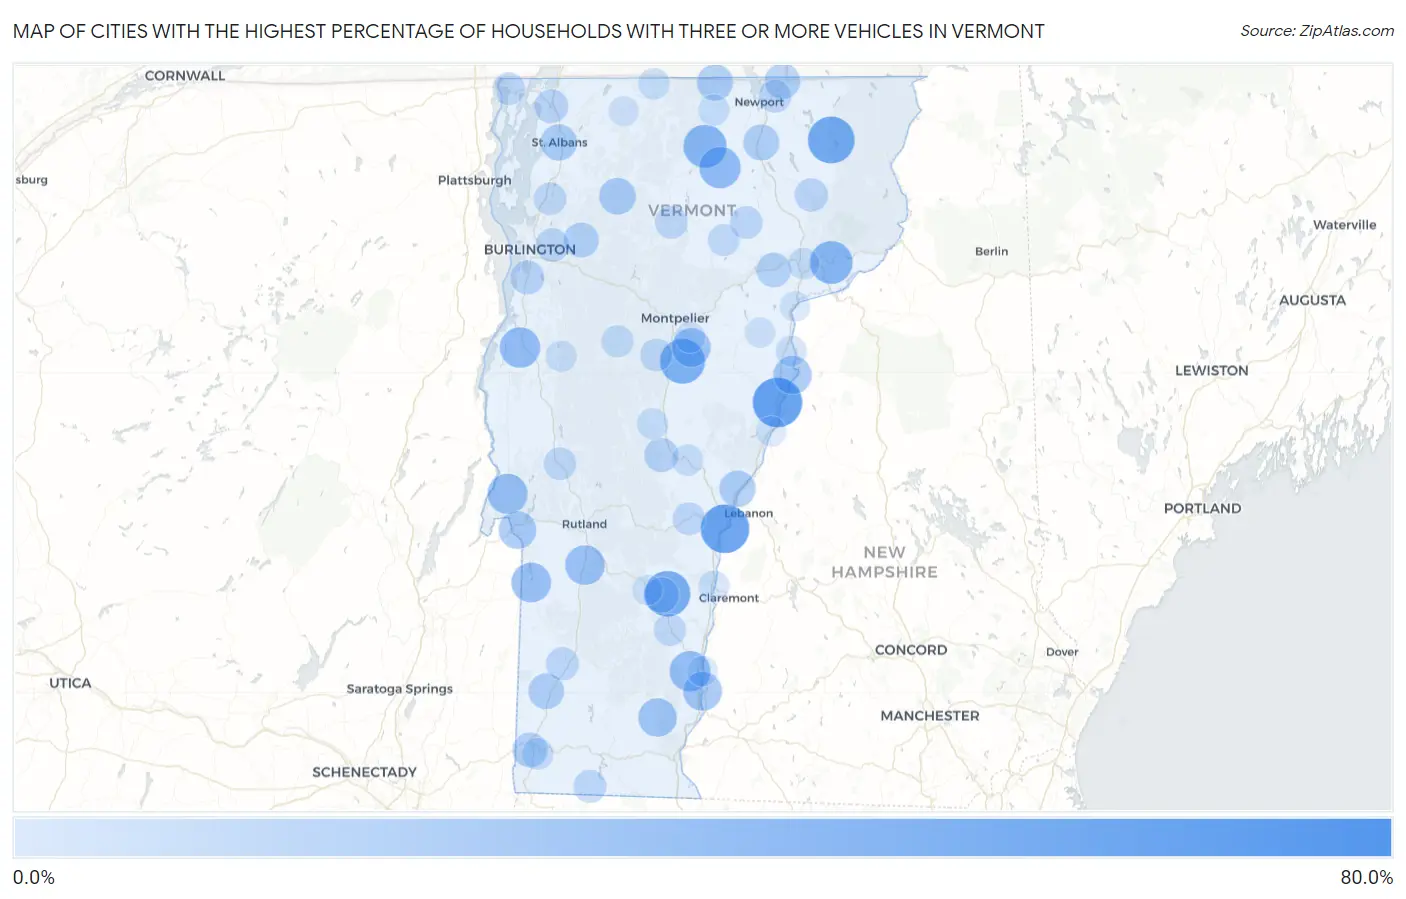
Map of Cities with the Highest Percentage of Households With Three or more Vehicles in Vermont
0.0%
80.0%
Cities with the Highest Percentage of Households With Three or more Vehicles in Vermont
| City | Housholds With 3+ Cars | vs State | vs National | |
| 1. | Waterbury Center | 61.3% | 22.3%(+39.0)#1 | 29.0%(+32.3)#1,484 |
| 2. | Middletown Springs | 56.1% | 22.3%(+33.8)#2 | 29.0%(+27.1)#2,139 |
| 3. | Lyndon Center | 55.9% | 22.3%(+33.6)#3 | 29.0%(+26.9)#2,171 |
| 4. | Bradford | 53.0% | 22.3%(+30.7)#4 | 29.0%(+24.0)#2,664 |
| 5. | North Hartland | 51.1% | 22.3%(+28.8)#5 | 29.0%(+22.1)#3,061 |
| 6. | Hanksville | 50.0% | 22.3%(+27.7)#6 | 29.0%(+21.0)#3,392 |
| 7. | Island Pond | 47.6% | 22.3%(+25.3)#7 | 29.0%(+18.6)#4,004 |
| 8. | Bolton | 46.2% | 22.3%(+23.9)#8 | 29.0%(+17.2)#4,458 |
| 9. | Cavendish | 45.5% | 22.3%(+23.2)#9 | 29.0%(+16.5)#4,698 |
| 10. | Williamstown | 44.0% | 22.3%(+21.7)#10 | 29.0%(+15.0)#5,218 |
| 11. | Weston | 43.8% | 22.3%(+21.5)#11 | 29.0%(+14.8)#5,345 |
| 12. | Bakersfield | 43.7% | 22.3%(+21.4)#12 | 29.0%(+14.7)#5,374 |
| 13. | Pownal Center | 41.1% | 22.3%(+18.8)#13 | 29.0%(+12.1)#6,556 |
| 14. | Grafton | 40.7% | 22.3%(+18.4)#14 | 29.0%(+11.7)#6,750 |
| 15. | Lowell | 40.3% | 22.3%(+18.0)#15 | 29.0%(+11.3)#6,958 |
| 16. | Concord | 39.6% | 22.3%(+17.3)#16 | 29.0%(+10.6)#7,360 |
| 17. | Hartford | 39.2% | 22.3%(+16.9)#17 | 29.0%(+10.2)#7,585 |
| 18. | Harmonyville | 38.7% | 22.3%(+16.4)#18 | 29.0%(+9.70)#7,903 |
| 19. | West Charlotte | 37.0% | 22.3%(+14.7)#19 | 29.0%(+8.00)#8,933 |
| 20. | Albany | 36.9% | 22.3%(+14.6)#20 | 29.0%(+7.90)#8,993 |
| 21. | Saxtons River | 35.4% | 22.3%(+13.1)#21 | 29.0%(+6.40)#9,974 |
| 22. | Vergennes | 35.1% | 22.3%(+12.8)#22 | 29.0%(+6.10)#10,147 |
| 23. | Benson | 34.4% | 22.3%(+12.1)#23 | 29.0%(+5.40)#10,738 |
| 24. | Wells | 33.6% | 22.3%(+11.3)#24 | 29.0%(+4.60)#11,429 |
| 25. | Wallingford | 33.5% | 22.3%(+11.2)#25 | 29.0%(+4.50)#11,482 |
| 26. | Stamford | 33.2% | 22.3%(+10.9)#26 | 29.0%(+4.20)#11,797 |
| 27. | Lincoln | 32.9% | 22.3%(+10.6)#27 | 29.0%(+3.90)#11,985 |
| 28. | South Barre | 31.9% | 22.3%(+9.60)#28 | 29.0%(+2.90)#12,794 |
| 29. | Westminster | 31.8% | 22.3%(+9.50)#29 | 29.0%(+2.80)#12,895 |
| 30. | Newfane | 31.3% | 22.3%(+9.00)#30 | 29.0%(+2.30)#13,372 |
| 31. | Westford | 30.9% | 22.3%(+8.60)#31 | 29.0%(+1.90)#13,722 |
| 32. | Newbury | 30.8% | 22.3%(+8.50)#32 | 29.0%(+1.80)#13,787 |
| 33. | Huntington Center | 30.0% | 22.3%(+7.70)#33 | 29.0%(+1.00)#14,554 |
| 34. | Fair Haven | 29.6% | 22.3%(+7.30)#34 | 29.0%(+0.600)#14,894 |
| 35. | North Pownal | 28.0% | 22.3%(+5.70)#35 | 29.0%(-1.000)#16,461 |
| 36. | South Lincoln | 27.9% | 22.3%(+5.60)#36 | 29.0%(-1.10)#16,571 |
| 37. | North Hyde Park | 27.8% | 22.3%(+5.50)#37 | 29.0%(-1.20)#16,648 |
| 38. | Jeffersonville | 27.5% | 22.3%(+5.20)#38 | 29.0%(-1.50)#16,932 |
| 39. | Wolcott | 27.4% | 22.3%(+5.10)#39 | 29.0%(-1.60)#17,065 |
| 40. | Underhill Flats | 27.3% | 22.3%(+5.00)#40 | 29.0%(-1.70)#17,139 |
| 41. | St Albans | 27.0% | 22.3%(+4.70)#41 | 29.0%(-2.00)#17,364 |
| 42. | Norwich | 27.0% | 22.3%(+4.70)#42 | 29.0%(-2.00)#17,399 |
| 43. | North Troy | 26.8% | 22.3%(+4.50)#43 | 29.0%(-2.20)#17,592 |
| 44. | Orleans | 26.5% | 22.3%(+4.20)#44 | 29.0%(-2.50)#17,864 |
| 45. | Sheffield | 26.4% | 22.3%(+4.10)#45 | 29.0%(-2.60)#17,992 |
| 46. | Arlington | 26.0% | 22.3%(+3.70)#46 | 29.0%(-3.00)#18,345 |
| 47. | Derby Line | 25.7% | 22.3%(+3.40)#47 | 29.0%(-3.30)#18,645 |
| 48. | Proctorsville | 25.0% | 22.3%(+2.70)#48 | 29.0%(-4.00)#19,289 |
| 49. | Underhill Center | 25.0% | 22.3%(+2.70)#49 | 29.0%(-4.00)#19,364 |
| 50. | St. George | 24.7% | 22.3%(+2.40)#50 | 29.0%(-4.30)#19,627 |
| 51. | Jericho | 24.5% | 22.3%(+2.20)#51 | 29.0%(-4.50)#19,797 |
| 52. | Old Bennington | 24.3% | 22.3%(+2.00)#52 | 29.0%(-4.70)#20,029 |
| 53. | Highgate Center | 24.1% | 22.3%(+1.80)#53 | 29.0%(-4.90)#20,216 |
| 54. | Danville | 23.9% | 22.3%(+1.60)#54 | 29.0%(-5.10)#20,407 |
| 55. | Huntington | 23.8% | 22.3%(+1.50)#55 | 29.0%(-5.20)#20,488 |
| 56. | Bethel | 23.3% | 22.3%(+1.00)#56 | 29.0%(-5.70)#20,947 |
| 57. | Gilman | 23.3% | 22.3%(+1.00)#57 | 29.0%(-5.70)#20,966 |
| 58. | West Dummerston | 23.1% | 22.3%(+0.800)#58 | 29.0%(-5.90)#21,145 |
| 59. | Londonderry | 22.9% | 22.3%(+0.600)#59 | 29.0%(-6.10)#21,313 |
| 60. | Shelburne | 22.6% | 22.3%(+0.300)#60 | 29.0%(-6.40)#21,510 |
| 61. | Swanton | 22.6% | 22.3%(+0.300)#61 | 29.0%(-6.40)#21,526 |
| 62. | Essex Junction | 21.9% | 22.3%(-0.400)#62 | 29.0%(-7.10)#22,106 |
| 63. | Danby | 21.5% | 22.3%(-0.800)#63 | 29.0%(-7.50)#22,511 |
| 64. | West Burke | 21.3% | 22.3%(-1.00)#64 | 29.0%(-7.70)#22,693 |
| 65. | Manchester | 21.0% | 22.3%(-1.30)#65 | 29.0%(-8.00)#22,892 |
| 66. | New Haven | 21.0% | 22.3%(-1.30)#66 | 29.0%(-8.00)#22,906 |
| 67. | Readsboro | 20.5% | 22.3%(-1.80)#67 | 29.0%(-8.50)#23,281 |
| 68. | Morrisville | 20.4% | 22.3%(-1.90)#68 | 29.0%(-8.60)#23,321 |
| 69. | Woodstock | 20.4% | 22.3%(-1.90)#69 | 29.0%(-8.60)#23,334 |
| 70. | Derby Center | 20.4% | 22.3%(-1.90)#70 | 29.0%(-8.60)#23,338 |
| 71. | Northfield | 20.3% | 22.3%(-2.00)#71 | 29.0%(-8.70)#23,396 |
| 72. | Greensboro Bend | 20.3% | 22.3%(-2.00)#72 | 29.0%(-8.70)#23,436 |
| 73. | Milton | 20.2% | 22.3%(-2.10)#73 | 29.0%(-8.80)#23,482 |
| 74. | Brandon | 20.0% | 22.3%(-2.30)#74 | 29.0%(-9.00)#23,637 |
| 75. | Alburgh | 20.0% | 22.3%(-2.30)#75 | 29.0%(-9.00)#23,668 |
| 76. | Waitsfield | 19.3% | 22.3%(-3.00)#76 | 29.0%(-9.70)#24,259 |
| 77. | Chester | 19.2% | 22.3%(-3.10)#77 | 29.0%(-9.80)#24,309 |
| 78. | Hardwick | 19.0% | 22.3%(-3.30)#78 | 29.0%(-10.00)#24,450 |
| 79. | West Pawlet | 19.0% | 22.3%(-3.30)#79 | 29.0%(-10.00)#24,469 |
| 80. | Killington | 18.7% | 22.3%(-3.60)#80 | 29.0%(-10.3)#24,680 |
| 81. | Bennington | 18.4% | 22.3%(-3.90)#81 | 29.0%(-10.6)#24,844 |
| 82. | South Hero | 18.2% | 22.3%(-4.10)#82 | 29.0%(-10.8)#25,010 |
| 83. | South Royalton | 18.0% | 22.3%(-4.30)#83 | 29.0%(-11.0)#25,147 |
| 84. | Richford | 17.9% | 22.3%(-4.40)#84 | 29.0%(-11.1)#25,195 |
| 85. | St Johnsbury | 17.8% | 22.3%(-4.50)#85 | 29.0%(-11.2)#25,247 |
| 86. | Randolph | 17.6% | 22.3%(-4.70)#86 | 29.0%(-11.4)#25,377 |
| 87. | Troy | 17.6% | 22.3%(-4.70)#87 | 29.0%(-11.4)#25,420 |
| 88. | Ascutney | 17.3% | 22.3%(-5.00)#88 | 29.0%(-11.7)#25,600 |
| 89. | Bristol | 17.0% | 22.3%(-5.30)#89 | 29.0%(-12.0)#25,772 |
| 90. | Wells River | 16.9% | 22.3%(-5.40)#90 | 29.0%(-12.1)#25,849 |
| 91. | South Londonderry | 16.7% | 22.3%(-5.60)#91 | 29.0%(-12.3)#25,959 |
| 92. | Barre | 16.4% | 22.3%(-5.90)#92 | 29.0%(-12.6)#26,114 |
| 93. | Proctor | 16.3% | 22.3%(-6.00)#93 | 29.0%(-12.7)#26,182 |
| 94. | Chittenden | 16.3% | 22.3%(-6.00)#94 | 29.0%(-12.7)#26,205 |
| 95. | Bellows Falls | 15.9% | 22.3%(-6.40)#95 | 29.0%(-13.1)#26,397 |
| 96. | Barnet | 15.8% | 22.3%(-6.50)#96 | 29.0%(-13.2)#26,474 |
| 97. | Fairlee | 15.8% | 22.3%(-6.50)#97 | 29.0%(-13.2)#26,476 |
| 98. | Ludlow | 15.7% | 22.3%(-6.60)#98 | 29.0%(-13.3)#26,515 |
| 99. | Groton | 15.6% | 22.3%(-6.70)#99 | 29.0%(-13.4)#26,578 |
| 100. | Enosburg Falls | 15.5% | 22.3%(-6.80)#100 | 29.0%(-13.5)#26,623 |
1
2Common Questions
What are the Top 10 Cities with the Highest Percentage of Households With Three or more Vehicles in Vermont?
Top 10 Cities with the Highest Percentage of Households With Three or more Vehicles in Vermont are:
#1
53.0%
#2
51.1%
#3
47.6%
#4
45.5%
#5
44.0%
#6
40.3%
#7
39.6%
#8
36.9%
#9
35.4%
#10
35.1%
What city has the Highest Percentage of Households With Three or more Vehicles in Vermont?
Bradford has the Highest Percentage of Households With Three or more Vehicles in Vermont with 53.0%.
What is the Percentage of Households With Three or more Vehicles in the State of Vermont?
Percentage of Households With Three or more Vehicles in Vermont is 22.3%.
What is the Percentage of Households With Three or more Vehicles in the United States?
Percentage of Households With Three or more Vehicles in the United States is 29.0%.