Cities with the Highest Percentage of Households With Three or more Vehicles in Wisconsin
RELATED REPORTS & OPTIONS
Households with 3 or more Cars
Wisconsin
Compare Cities
Map of Cities with the Highest Percentage of Households With Three or more Vehicles in Wisconsin
0.0%
100.0%
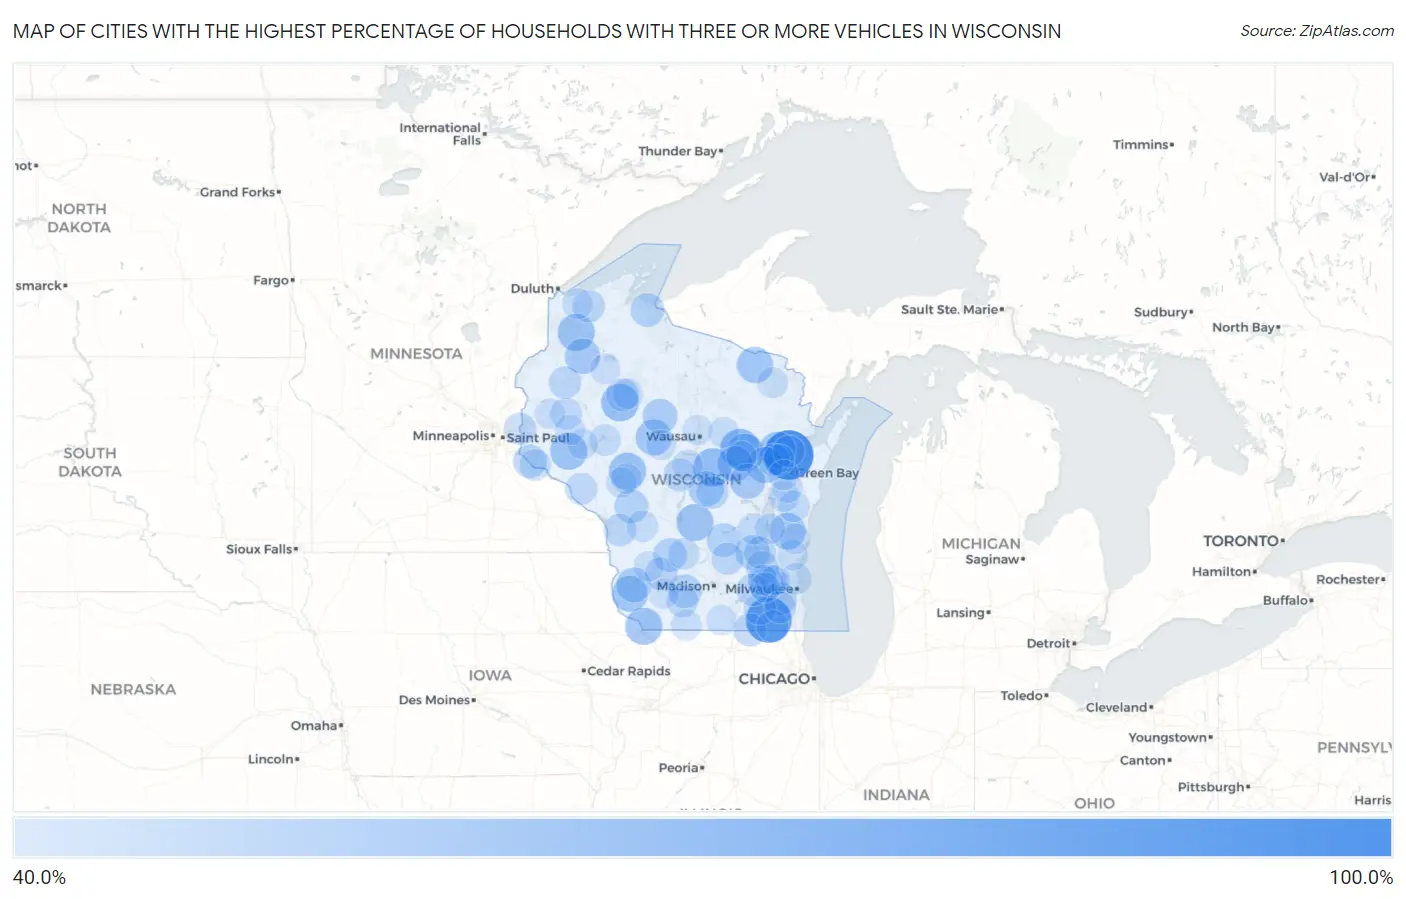
Cities with the Highest Percentage of Households With Three or more Vehicles in Wisconsin
| City | Housholds With 3+ Cars | vs State | vs National | |
| 1. | Sobieski | 100.0% | 28.0% (+72.0)#1 | 29.0% (+71.0)#50 |
| 2. | Springfield | 88.2% | 28.0% (+60.2)#2 | 29.0% (+59.2)#438 |
| 3. | Big Foot Prairie | 78.6% | 28.0% (+50.6)#3 | 29.0% (+49.6)#625 |
| 4. | Tilleda | 70.0% | 28.0% (+42.0)#4 | 29.0% (+41.0)#897 |
| 5. | Polonia | 66.8% | 28.0% (+38.8)#5 | 29.0% (+37.8)#1,047 |
| 6. | Leopolis | 64.7% | 28.0% (+36.7)#6 | 29.0% (+35.7)#1,208 |
| 7. | Conrath | 64.3% | 28.0% (+36.3)#7 | 29.0% (+35.3)#1,233 |
| 8. | Humbird | 62.9% | 28.0% (+34.9)#8 | 29.0% (+33.9)#1,332 |
| 9. | Sandy Hook | 62.5% | 28.0% (+34.5)#9 | 29.0% (+33.5)#1,352 |
| 10. | Downsville | 62.3% | 28.0% (+34.3)#10 | 29.0% (+33.3)#1,384 |
| 11. | Grand Marsh | 62.2% | 28.0% (+34.2)#11 | 29.0% (+33.2)#1,400 |
| 12. | Gordon | 62.2% | 28.0% (+34.2)#12 | 29.0% (+33.2)#1,402 |
| 13. | Green Valley | 61.1% | 28.0% (+33.1)#13 | 29.0% (+32.1)#1,513 |
| 14. | Greenbush | 60.8% | 28.0% (+32.8)#14 | 29.0% (+31.8)#1,543 |
| 15. | Navarino | 60.0% | 28.0% (+32.0)#15 | 29.0% (+31.0)#1,619 |
| 16. | Long Lake | 60.0% | 28.0% (+32.0)#16 | 29.0% (+31.0)#1,640 |
| 17. | Curtiss | 59.5% | 28.0% (+31.5)#17 | 29.0% (+30.5)#1,699 |
| 18. | Mount Hope | 59.3% | 28.0% (+31.3)#18 | 29.0% (+30.3)#1,718 |
| 19. | New Munster | 58.6% | 28.0% (+30.6)#19 | 29.0% (+29.6)#1,804 |
| 20. | Big Falls | 58.0% | 28.0% (+30.0)#20 | 29.0% (+29.0)#1,882 |
| 21. | Brothertown | 57.7% | 28.0% (+29.7)#21 | 29.0% (+28.7)#1,913 |
| 22. | Springbrook | 57.6% | 28.0% (+29.6)#22 | 29.0% (+28.6)#1,932 |
| 23. | Northport | 57.2% | 28.0% (+29.2)#23 | 29.0% (+28.2)#1,955 |
| 24. | Bancroft | 56.9% | 28.0% (+28.9)#24 | 29.0% (+27.9)#2,014 |
| 25. | Woodman | 56.1% | 28.0% (+28.1)#25 | 29.0% (+27.1)#2,137 |
| 26. | Whittlesey | 55.6% | 28.0% (+27.6)#26 | 29.0% (+26.6)#2,215 |
| 27. | Bayfront | 55.1% | 28.0% (+27.1)#27 | 29.0% (+26.1)#2,296 |
| 28. | Oconomowoc Lake | 54.7% | 28.0% (+26.7)#28 | 29.0% (+25.7)#2,357 |
| 29. | Burnett | 54.6% | 28.0% (+26.6)#29 | 29.0% (+25.6)#2,364 |
| 30. | Shopiere | 54.5% | 28.0% (+26.5)#30 | 29.0% (+25.5)#2,379 |
| 31. | Cataract | 52.9% | 28.0% (+24.9)#31 | 29.0% (+23.9)#2,696 |
| 32. | Birch Hill | 52.8% | 28.0% (+24.8)#32 | 29.0% (+23.8)#2,721 |
| 33. | Lime Ridge | 52.8% | 28.0% (+24.8)#33 | 29.0% (+23.8)#2,724 |
| 34. | Dalton | 52.7% | 28.0% (+24.7)#34 | 29.0% (+23.7)#2,738 |
| 35. | Barneveld | 52.5% | 28.0% (+24.5)#35 | 29.0% (+23.5)#2,770 |
| 36. | Diamond Bluff | 51.9% | 28.0% (+23.9)#36 | 29.0% (+22.9)#2,920 |
| 37. | Big Bend | 50.4% | 28.0% (+22.4)#37 | 29.0% (+21.4)#3,188 |
| 38. | Vesper | 50.2% | 28.0% (+22.2)#38 | 29.0% (+21.2)#3,230 |
| 39. | Neosho | 50.0% | 28.0% (+22.0)#39 | 29.0% (+21.0)#3,259 |
| 40. | Mindoro | 50.0% | 28.0% (+22.0)#40 | 29.0% (+21.0)#3,273 |
| 41. | Gotham | 50.0% | 28.0% (+22.0)#41 | 29.0% (+21.0)#3,311 |
| 42. | Tony | 50.0% | 28.0% (+22.0)#42 | 29.0% (+21.0)#3,331 |
| 43. | Easton | 50.0% | 28.0% (+22.0)#43 | 29.0% (+21.0)#3,375 |
| 44. | Sharon | 49.9% | 28.0% (+21.9)#44 | 29.0% (+20.9)#3,434 |
| 45. | Angelica | 49.0% | 28.0% (+21.0)#45 | 29.0% (+20.0)#3,626 |
| 46. | Lauderdale Lakes | 48.8% | 28.0% (+20.8)#46 | 29.0% (+19.8)#3,665 |
| 47. | St Joseph | 48.8% | 28.0% (+20.8)#47 | 29.0% (+19.8)#3,670 |
| 48. | Brule | 48.6% | 28.0% (+20.6)#48 | 29.0% (+19.6)#3,722 |
| 49. | Barronett | 48.6% | 28.0% (+20.6)#49 | 29.0% (+19.6)#3,729 |
| 50. | Helenville | 48.5% | 28.0% (+20.5)#50 | 29.0% (+19.5)#3,758 |
| 51. | Doylestown | 48.3% | 28.0% (+20.3)#51 | 29.0% (+19.3)#3,820 |
| 52. | Chenequa | 48.2% | 28.0% (+20.2)#52 | 29.0% (+19.2)#3,834 |
| 53. | Almond | 48.1% | 28.0% (+20.1)#53 | 29.0% (+19.1)#3,860 |
| 54. | Bloomfield | 47.8% | 28.0% (+19.8)#54 | 29.0% (+18.8)#3,932 |
| 55. | Kekoskee | 47.8% | 28.0% (+19.8)#55 | 29.0% (+18.8)#3,939 |
| 56. | Houlton | 47.7% | 28.0% (+19.7)#56 | 29.0% (+18.7)#3,997 |
| 57. | Hollandale | 47.3% | 28.0% (+19.3)#57 | 29.0% (+18.3)#4,089 |
| 58. | Waumandee | 47.2% | 28.0% (+19.2)#58 | 29.0% (+18.2)#4,118 |
| 59. | Prairie Farm | 47.0% | 28.0% (+19.0)#59 | 29.0% (+18.0)#4,186 |
| 60. | Abrams | 47.0% | 28.0% (+19.0)#60 | 29.0% (+18.0)#4,190 |
| 61. | Tichigan | 46.9% | 28.0% (+18.9)#61 | 29.0% (+17.9)#4,192 |
| 62. | Jolmaville | 46.7% | 28.0% (+18.7)#62 | 29.0% (+17.7)#4,282 |
| 63. | Lake Wissota | 46.1% | 28.0% (+18.1)#63 | 29.0% (+17.1)#4,473 |
| 64. | Pulaski | 46.0% | 28.0% (+18.0)#64 | 29.0% (+17.0)#4,493 |
| 65. | Hager City | 46.0% | 28.0% (+18.0)#65 | 29.0% (+17.0)#4,518 |
| 66. | Rosendale | 45.9% | 28.0% (+17.9)#66 | 29.0% (+16.9)#4,533 |
| 67. | Rock Springs | 45.8% | 28.0% (+17.8)#67 | 29.0% (+16.8)#4,577 |
| 68. | Collins | 45.7% | 28.0% (+17.7)#68 | 29.0% (+16.7)#4,616 |
| 69. | Norwalk | 45.4% | 28.0% (+17.4)#69 | 29.0% (+16.4)#4,730 |
| 70. | Forest Junction | 45.2% | 28.0% (+17.2)#70 | 29.0% (+16.2)#4,789 |
| 71. | River Hills | 44.8% | 28.0% (+16.8)#71 | 29.0% (+15.8)#4,918 |
| 72. | South Wayne | 44.5% | 28.0% (+16.5)#72 | 29.0% (+15.5)#5,028 |
| 73. | Goodman | 44.4% | 28.0% (+16.4)#73 | 29.0% (+15.4)#5,071 |
| 74. | Milladore | 44.3% | 28.0% (+16.3)#74 | 29.0% (+15.3)#5,115 |
| 75. | Aniwa | 44.3% | 28.0% (+16.3)#75 | 29.0% (+15.3)#5,120 |
| 76. | Waubeka | 44.0% | 28.0% (+16.0)#76 | 29.0% (+15.0)#5,227 |
| 77. | Poplar | 43.9% | 28.0% (+15.9)#77 | 29.0% (+14.9)#5,275 |
| 78. | Raymond | 43.8% | 28.0% (+15.8)#78 | 29.0% (+14.8)#5,301 |
| 79. | Lyons | 43.8% | 28.0% (+15.8)#79 | 29.0% (+14.8)#5,310 |
| 80. | Elk Mound | 43.6% | 28.0% (+15.6)#80 | 29.0% (+14.6)#5,405 |
| 81. | Waldo | 43.6% | 28.0% (+15.6)#81 | 29.0% (+14.6)#5,414 |
| 82. | Clear Lake | 43.5% | 28.0% (+15.5)#82 | 29.0% (+14.5)#5,435 |
| 83. | Hixton | 43.5% | 28.0% (+15.5)#83 | 29.0% (+14.5)#5,446 |
| 84. | Merton | 43.4% | 28.0% (+15.4)#84 | 29.0% (+14.4)#5,475 |
| 85. | Taycheedah | 43.3% | 28.0% (+15.3)#85 | 29.0% (+14.3)#5,531 |
| 86. | Orfordville | 43.1% | 28.0% (+15.1)#86 | 29.0% (+14.1)#5,595 |
| 87. | Alma Center | 43.1% | 28.0% (+15.1)#87 | 29.0% (+14.1)#5,611 |
| 88. | Wheeler | 43.1% | 28.0% (+15.1)#88 | 29.0% (+14.1)#5,617 |
| 89. | North Lake | 43.1% | 28.0% (+15.1)#89 | 29.0% (+14.1)#5,619 |
| 90. | Couderay | 43.1% | 28.0% (+15.1)#90 | 29.0% (+14.1)#5,624 |
| 91. | Greenleaf | 43.0% | 28.0% (+15.0)#91 | 29.0% (+14.0)#5,645 |
| 92. | Boaz | 42.9% | 28.0% (+14.9)#92 | 29.0% (+13.9)#5,694 |
| 93. | Glen Flora | 42.9% | 28.0% (+14.9)#93 | 29.0% (+13.9)#5,704 |
| 94. | Hobart | 42.8% | 28.0% (+14.8)#94 | 29.0% (+13.8)#5,732 |
| 95. | Unity | 42.7% | 28.0% (+14.7)#95 | 29.0% (+13.7)#5,773 |
| 96. | Caroline | 42.7% | 28.0% (+14.7)#96 | 29.0% (+13.7)#5,774 |
| 97. | Lac La Belle | 42.7% | 28.0% (+14.7)#97 | 29.0% (+13.7)#5,778 |
| 98. | Summit | 42.5% | 28.0% (+14.5)#98 | 29.0% (+13.5)#5,837 |
| 99. | Edmund | 42.4% | 28.0% (+14.4)#99 | 29.0% (+13.4)#5,914 |
| 100. | Maine | 42.2% | 28.0% (+14.2)#100 | 29.0% (+13.2)#5,980 |
Common Questions
What are the Top 10 Cities with the Highest Percentage of Households With Three or more Vehicles in Wisconsin?
Top 10 Cities with the Highest Percentage of Households With Three or more Vehicles in Wisconsin are:
#1
100.0%
#2
88.2%
#3
70.0%
#4
66.8%
#5
64.7%
#6
64.3%
#7
62.9%
#8
62.5%
#9
62.3%
#10
62.2%
What city has the Highest Percentage of Households With Three or more Vehicles in Wisconsin?
Sobieski has the Highest Percentage of Households With Three or more Vehicles in Wisconsin with 100.0%.
What is the Percentage of Households With Three or more Vehicles in the State of Wisconsin?
Percentage of Households With Three or more Vehicles in Wisconsin is 28.0%.
What is the Percentage of Households With Three or more Vehicles in the United States?
Percentage of Households With Three or more Vehicles in the United States is 29.0%.