Laton, CA Map & Demographics
Laton Map
Laton Overview
$24,443
PER CAPITA INCOME
$72,656
AVG FAMILY INCOME
$69,145
AVG HOUSEHOLD INCOME
56.1%
WAGE / INCOME GAP [ % ]
43.9¢/ $1
WAGE / INCOME GAP [ $ ]
0.35
INEQUALITY / GINI INDEX
1,301
TOTAL POPULATION
707
MALE POPULATION
594
FEMALE POPULATION
119.02
MALES / 100 FEMALES
84.02
FEMALES / 100 MALES
31.3
MEDIAN AGE
3.9
AVG FAMILY SIZE
3.3
AVG HOUSEHOLD SIZE
595
LABOR FORCE [ PEOPLE ]
64.9%
PERCENT IN LABOR FORCE
8.1%
UNEMPLOYMENT RATE
Laton Zip Codes
Laton Area Codes
Income in Laton
Income Overview in Laton
Per Capita Income in Laton is $24,443, while median incomes of families and households are $72,656 and $69,145 respectively.
| Characteristic | Number | Measure |
| Per Capita Income | 1,301 | $24,443 |
| Median Family Income | 317 | $72,656 |
| Mean Family Income | 317 | $73,028 |
| Median Household Income | 398 | $69,145 |
| Mean Household Income | 398 | $77,228 |
| Income Deficit | 317 | $0 |
| Wage / Income Gap (%) | 1,301 | 56.13% |
| Wage / Income Gap ($) | 1,301 | 43.87¢ per $1 |
| Gini / Inequality Index | 1,301 | 0.35 |
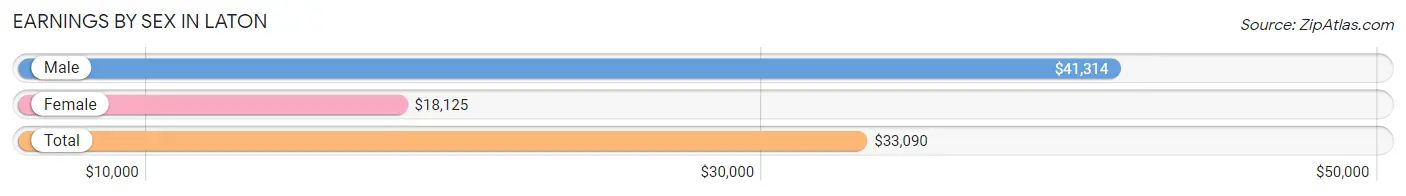
Earnings by Sex in Laton
Average Earnings in Laton are $33,090, $41,314 for men and $18,125 for women, a difference of 56.1%.
| Sex | Number | Average Earnings |
| Male | 319 (53.4%) | $41,314 |
| Female | 278 (46.6%) | $18,125 |
| Total | 597 (100.0%) | $33,090 |
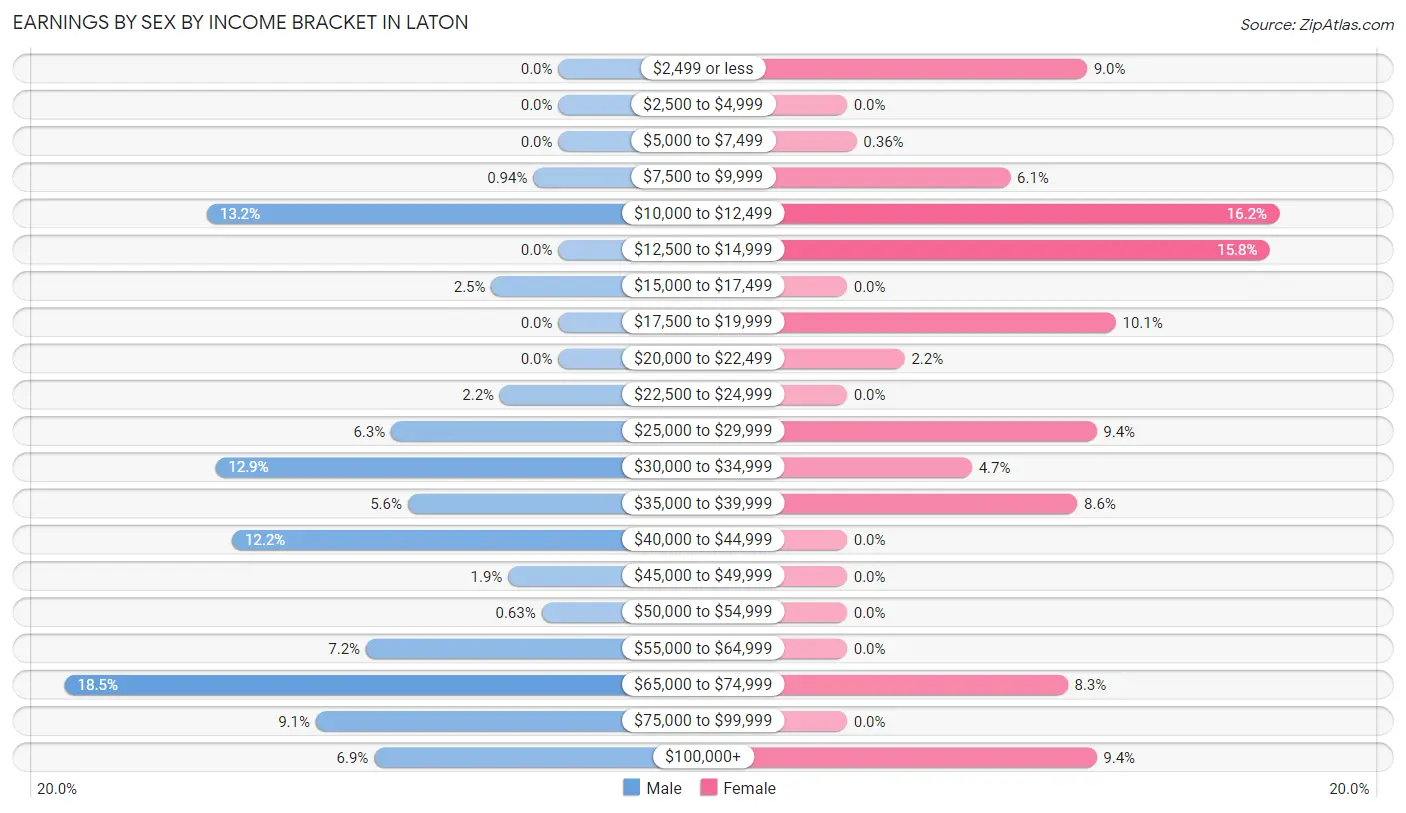
Earnings by Sex by Income Bracket in Laton
The most common earnings brackets in Laton are $65,000 to $74,999 for men (59 | 18.5%) and $10,000 to $12,499 for women (45 | 16.2%).
| Income | Male | Female |
| $2,499 or less | 0 (0.0%) | 25 (9.0%) |
| $2,500 to $4,999 | 0 (0.0%) | 0 (0.0%) |
| $5,000 to $7,499 | 0 (0.0%) | 1 (0.4%) |
| $7,500 to $9,999 | 3 (0.9%) | 17 (6.1%) |
| $10,000 to $12,499 | 42 (13.2%) | 45 (16.2%) |
| $12,500 to $14,999 | 0 (0.0%) | 44 (15.8%) |
| $15,000 to $17,499 | 8 (2.5%) | 0 (0.0%) |
| $17,500 to $19,999 | 0 (0.0%) | 28 (10.1%) |
| $20,000 to $22,499 | 0 (0.0%) | 6 (2.2%) |
| $22,500 to $24,999 | 7 (2.2%) | 0 (0.0%) |
| $25,000 to $29,999 | 20 (6.3%) | 26 (9.3%) |
| $30,000 to $34,999 | 41 (12.9%) | 13 (4.7%) |
| $35,000 to $39,999 | 18 (5.6%) | 24 (8.6%) |
| $40,000 to $44,999 | 39 (12.2%) | 0 (0.0%) |
| $45,000 to $49,999 | 6 (1.9%) | 0 (0.0%) |
| $50,000 to $54,999 | 2 (0.6%) | 0 (0.0%) |
| $55,000 to $64,999 | 23 (7.2%) | 0 (0.0%) |
| $65,000 to $74,999 | 59 (18.5%) | 23 (8.3%) |
| $75,000 to $99,999 | 29 (9.1%) | 0 (0.0%) |
| $100,000+ | 22 (6.9%) | 26 (9.3%) |
| Total | 319 (100.0%) | 278 (100.0%) |
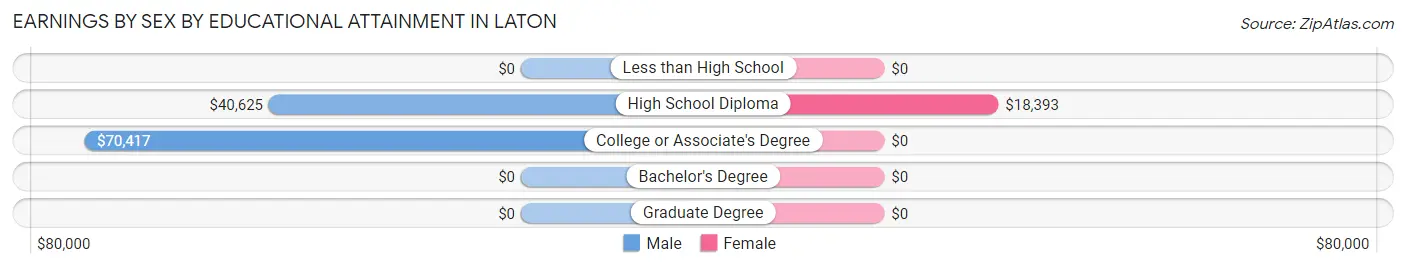
Earnings by Sex by Educational Attainment in Laton
Average earnings in Laton are $41,571 for men and $18,705 for women, a difference of 55.0%. Men with an educational attainment of college or associate's degree enjoy the highest average annual earnings of $70,417, while those with high school diploma education earn the least with $40,625. Women with an educational attainment of high school diploma earn the most with the average annual earnings of $18,393, while those with high school diploma education have the smallest earnings of $18,393.
| Educational Attainment | Male Income | Female Income |
| Less than High School | - | - |
| High School Diploma | $40,625 | $18,393 |
| College or Associate's Degree | $70,417 | $0 |
| Bachelor's Degree | - | - |
| Graduate Degree | - | - |
| Total | $41,571 | $18,705 |
Family Income in Laton
Family Income Brackets in Laton
According to the Laton family income data, there are 98 families falling into the $50,000 to $74,999 income range, which is the most common income bracket and makes up 30.9% of all families.
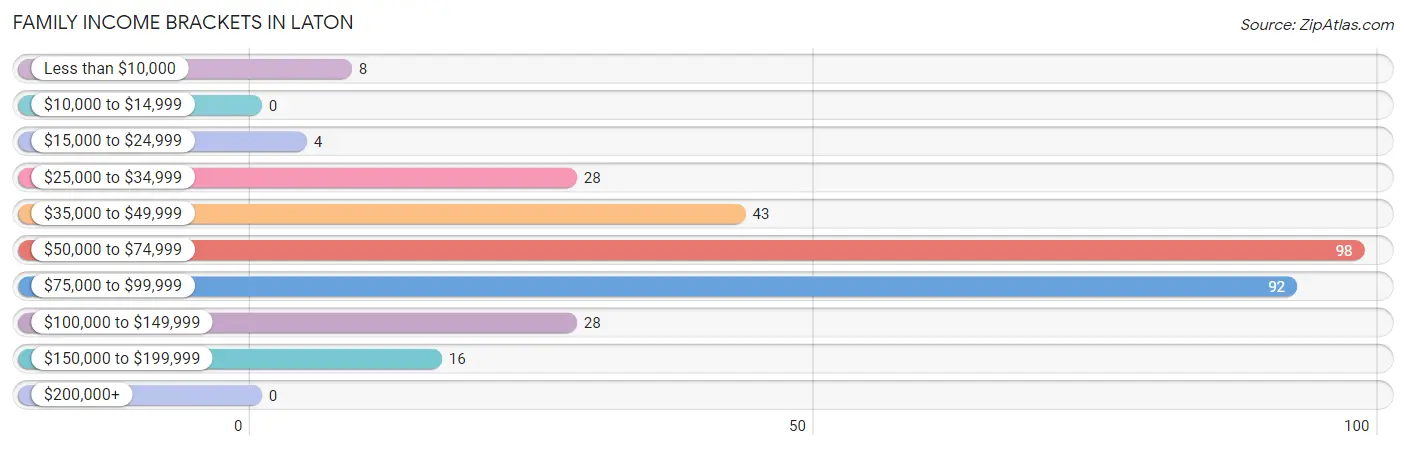
| Income Bracket | # Families | % Families |
| Less than $10,000 | 8 | 2.5% |
| $10,000 to $14,999 | 0 | 0.0% |
| $15,000 to $24,999 | 4 | 1.3% |
| $25,000 to $34,999 | 28 | 8.8% |
| $35,000 to $49,999 | 43 | 13.6% |
| $50,000 to $74,999 | 98 | 30.9% |
| $75,000 to $99,999 | 92 | 29.0% |
| $100,000 to $149,999 | 28 | 8.8% |
| $150,000 to $199,999 | 16 | 5.0% |
| $200,000+ | 0 | 0.0% |
Family Income by Famaliy Size in Laton
4-person families (128 | 40.4%) account for the highest median family income in Laton with $67,763 per family, while 4-person families (128 | 40.4%) have the highest median income of $16,941 per family member.
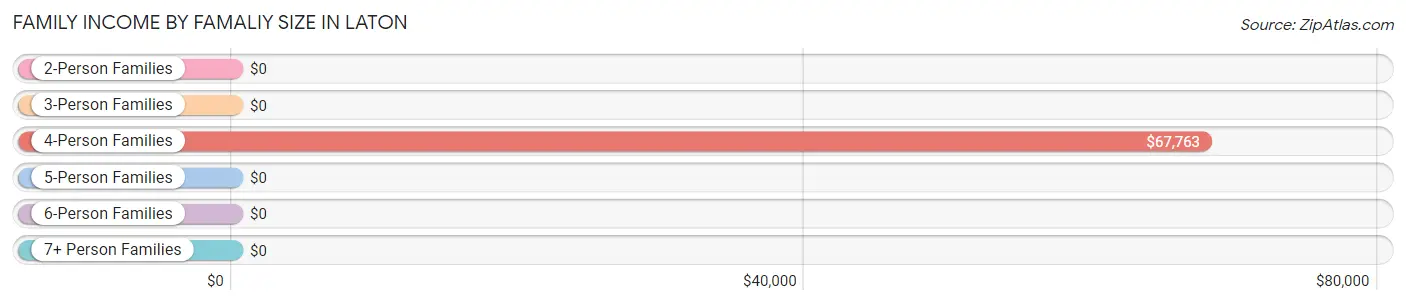
| Income Bracket | # Families | Median Income |
| 2-Person Families | 97 (30.6%) | $0 |
| 3-Person Families | 30 (9.5%) | $0 |
| 4-Person Families | 128 (40.4%) | $67,763 |
| 5-Person Families | 37 (11.7%) | $0 |
| 6-Person Families | 18 (5.7%) | $0 |
| 7+ Person Families | 7 (2.2%) | $0 |
| Total | 317 (100.0%) | $72,656 |
Family Income by Number of Earners in Laton
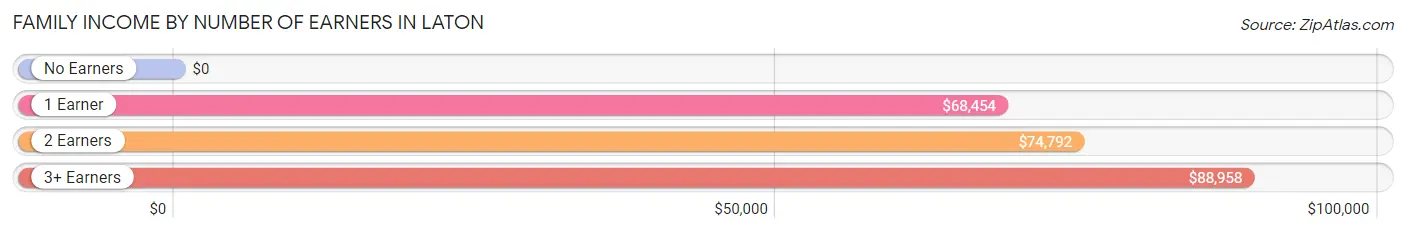
| Number of Earners | # Families | Median Income |
| No Earners | 15 (4.7%) | $0 |
| 1 Earner | 145 (45.7%) | $68,454 |
| 2 Earners | 96 (30.3%) | $74,792 |
| 3+ Earners | 61 (19.2%) | $88,958 |
| Total | 317 (100.0%) | $72,656 |
Household Income in Laton
Household Income Brackets in Laton
With 98 households falling in the category, the $50,000 to $74,999 income range is the most frequent in Laton, accounting for 24.6% of all households.
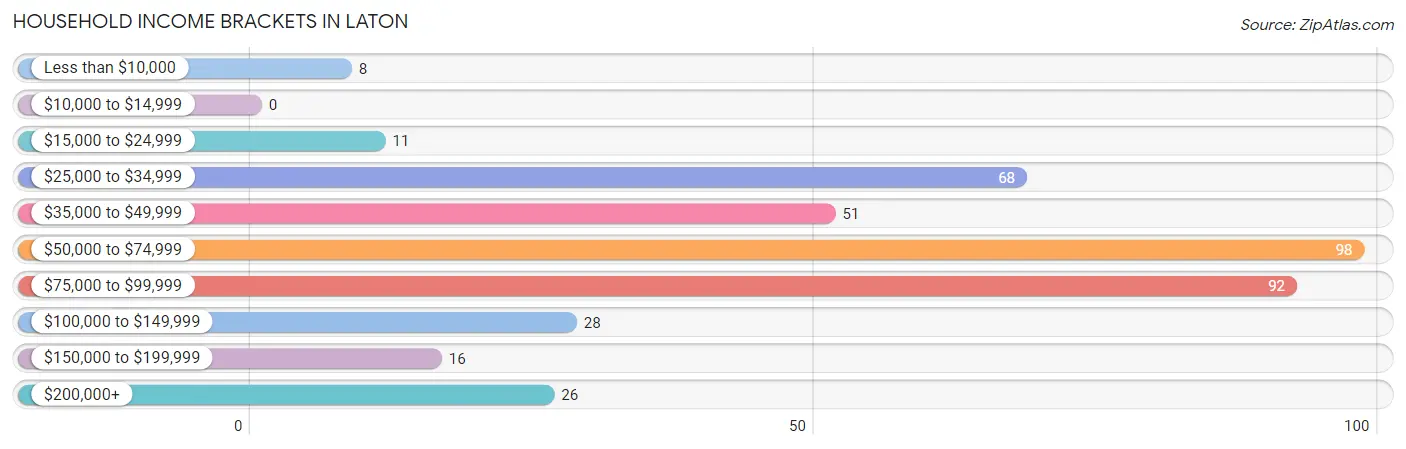
| Income Bracket | # Households | % Households |
| Less than $10,000 | 8 | 2.0% |
| $10,000 to $14,999 | 0 | 0.0% |
| $15,000 to $24,999 | 11 | 2.8% |
| $25,000 to $34,999 | 68 | 17.1% |
| $35,000 to $49,999 | 51 | 12.8% |
| $50,000 to $74,999 | 98 | 24.6% |
| $75,000 to $99,999 | 92 | 23.1% |
| $100,000 to $149,999 | 28 | 7.0% |
| $150,000 to $199,999 | 16 | 4.0% |
| $200,000+ | 26 | 6.5% |
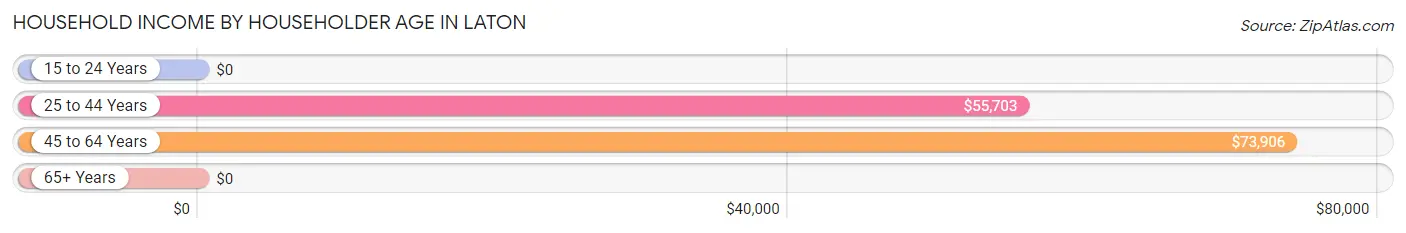
Household Income by Householder Age in Laton
The median household income in Laton is $69,145, with the highest median household income of $73,906 found in the 45 to 64 years age bracket for the primary householder. A total of 233 households (58.5%) fall into this category. Meanwhile, the 15 to 24 years age bracket for the primary householder has the lowest median household income of $0, with 7 households (1.8%) in this group.
| Income Bracket | # Households | Median Income |
| 15 to 24 Years | 7 (1.8%) | $0 |
| 25 to 44 Years | 87 (21.9%) | $55,703 |
| 45 to 64 Years | 233 (58.5%) | $73,906 |
| 65+ Years | 71 (17.8%) | $0 |
| Total | 398 (100.0%) | $69,145 |
Poverty in Laton
Income Below Poverty by Sex and Age in Laton
With 8.9% poverty level for males and 3.9% for females among the residents of Laton, 6 to 11 year old males and 5 year old females are the most vulnerable to poverty, with 37 males (52.1%) and 8 females (100.0%) in their respective age groups living below the poverty level.
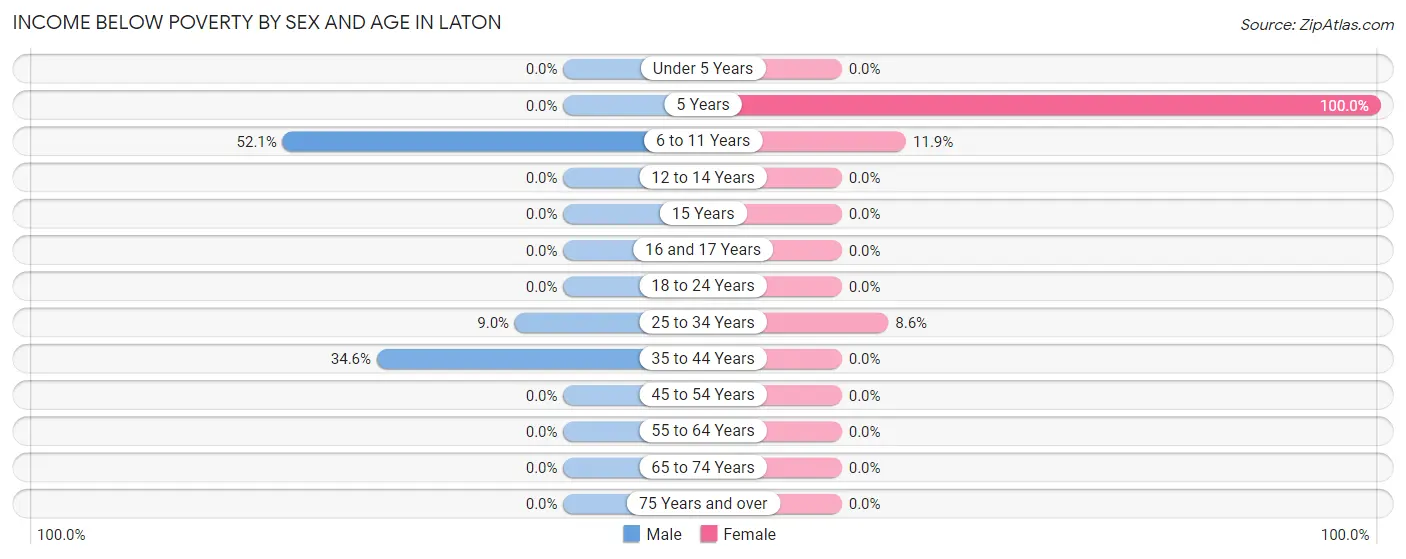
| Age Bracket | Male | Female |
| Under 5 Years | 0 (0.0%) | 0 (0.0%) |
| 5 Years | 0 (0.0%) | 8 (100.0%) |
| 6 to 11 Years | 37 (52.1%) | 8 (11.9%) |
| 12 to 14 Years | 0 (0.0%) | 0 (0.0%) |
| 15 Years | 0 (0.0%) | 0 (0.0%) |
| 16 and 17 Years | 0 (0.0%) | 0 (0.0%) |
| 18 to 24 Years | 0 (0.0%) | 0 (0.0%) |
| 25 to 34 Years | 8 (9.0%) | 7 (8.6%) |
| 35 to 44 Years | 18 (34.6%) | 0 (0.0%) |
| 45 to 54 Years | 0 (0.0%) | 0 (0.0%) |
| 55 to 64 Years | 0 (0.0%) | 0 (0.0%) |
| 65 to 74 Years | 0 (0.0%) | 0 (0.0%) |
| 75 Years and over | 0 (0.0%) | 0 (0.0%) |
| Total | 63 (8.9%) | 23 (3.9%) |
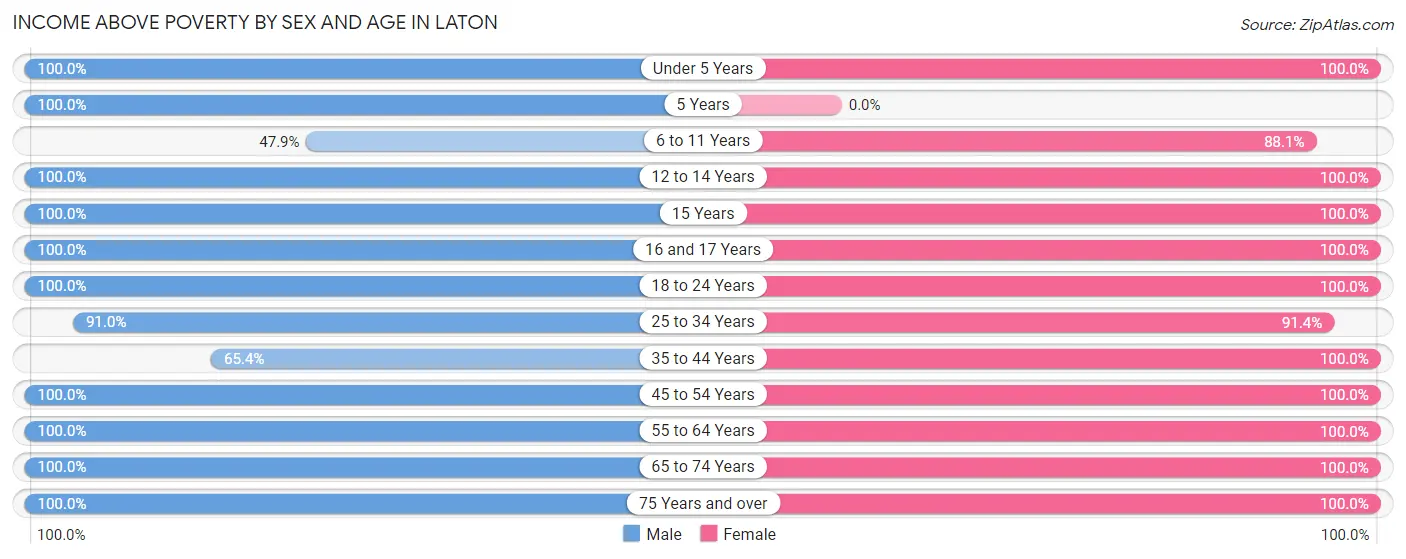
Income Above Poverty by Sex and Age in Laton
According to the poverty statistics in Laton, males aged under 5 years and females aged under 5 years are the age groups that are most secure financially, with 100.0% of males and 100.0% of females in these age groups living above the poverty line.
| Age Bracket | Male | Female |
| Under 5 Years | 40 (100.0%) | 18 (100.0%) |
| 5 Years | 21 (100.0%) | 0 (0.0%) |
| 6 to 11 Years | 34 (47.9%) | 59 (88.1%) |
| 12 to 14 Years | 35 (100.0%) | 27 (100.0%) |
| 15 Years | 77 (100.0%) | 20 (100.0%) |
| 16 and 17 Years | 56 (100.0%) | 7 (100.0%) |
| 18 to 24 Years | 22 (100.0%) | 81 (100.0%) |
| 25 to 34 Years | 81 (91.0%) | 74 (91.4%) |
| 35 to 44 Years | 34 (65.4%) | 44 (100.0%) |
| 45 to 54 Years | 78 (100.0%) | 77 (100.0%) |
| 55 to 64 Years | 119 (100.0%) | 126 (100.0%) |
| 65 to 74 Years | 8 (100.0%) | 13 (100.0%) |
| 75 Years and over | 39 (100.0%) | 25 (100.0%) |
| Total | 644 (91.1%) | 571 (96.1%) |
Income Below Poverty Among Married-Couple Families in Laton
The poverty statistics for married-couple families in Laton show that 2.7% or 7 of the total 259 families live below the poverty line. Families with 5 or more children have the highest poverty rate of 100.0%, comprising of 7 families. On the other hand, families with no children have the lowest poverty rate of 0.0%, which includes 0 families.
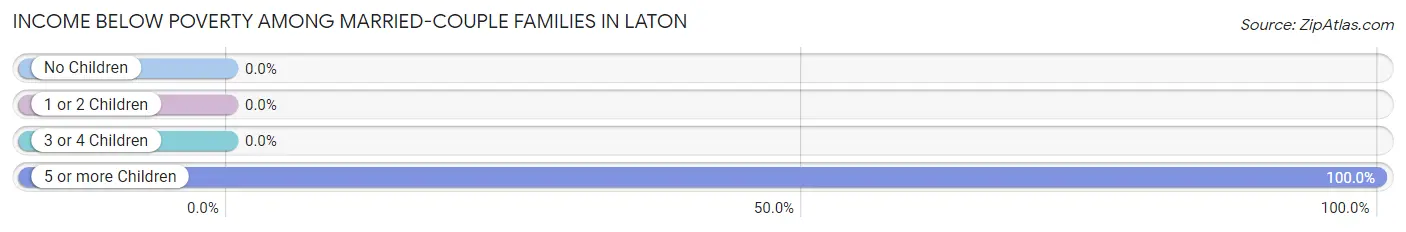
| Children | Above Poverty | Below Poverty |
| No Children | 72 (100.0%) | 0 (0.0%) |
| 1 or 2 Children | 142 (100.0%) | 0 (0.0%) |
| 3 or 4 Children | 38 (100.0%) | 0 (0.0%) |
| 5 or more Children | 0 (0.0%) | 7 (100.0%) |
| Total | 252 (97.3%) | 7 (2.7%) |
Income Below Poverty Among Single-Parent Households in Laton
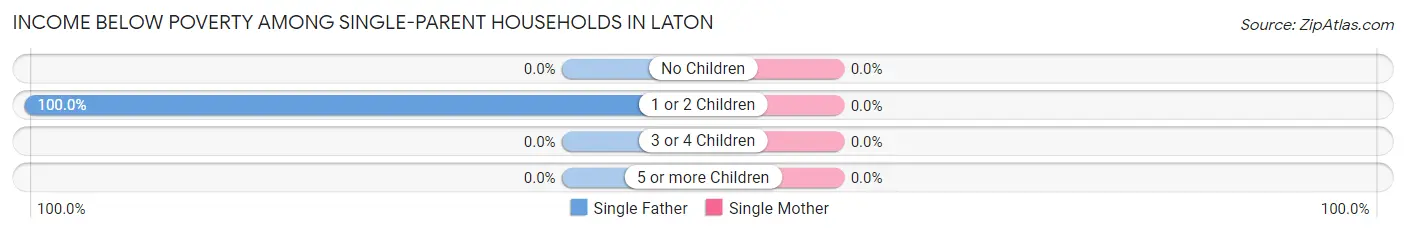
| Children | Single Father | Single Mother |
| No Children | 0 (0.0%) | 0 (0.0%) |
| 1 or 2 Children | 8 (100.0%) | 0 (0.0%) |
| 3 or 4 Children | 0 (0.0%) | 0 (0.0%) |
| 5 or more Children | 0 (0.0%) | 0 (0.0%) |
| Total | 8 (29.6%) | 0 (0.0%) |
Income Below Poverty Among Married-Couple vs Single-Parent Households in Laton
The poverty data for Laton shows that 7 of the married-couple family households (2.7%) and 8 of the single-parent households (13.8%) are living below the poverty level. Within the married-couple family households, those with 5 or more children have the highest poverty rate, with 7 households (100.0%) falling below the poverty line. Among the single-parent households, those with 1 or 2 children have the highest poverty rate, with 8 household (22.2%) living below poverty.
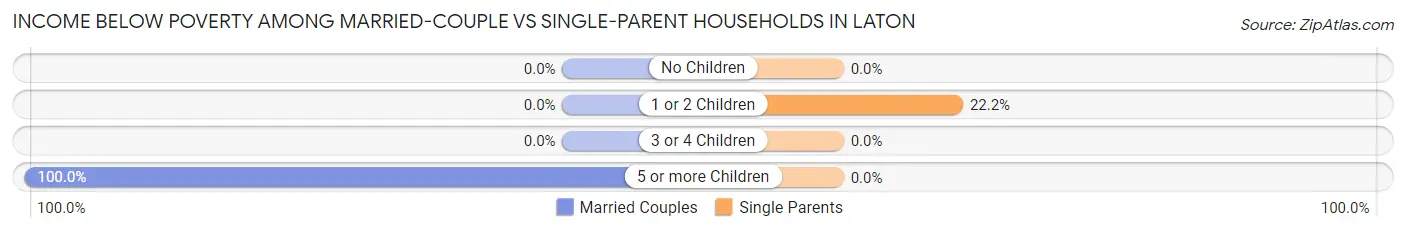
| Children | Married-Couple Families | Single-Parent Households |
| No Children | 0 (0.0%) | 0 (0.0%) |
| 1 or 2 Children | 0 (0.0%) | 8 (22.2%) |
| 3 or 4 Children | 0 (0.0%) | 0 (0.0%) |
| 5 or more Children | 7 (100.0%) | 0 (0.0%) |
| Total | 7 (2.7%) | 8 (13.8%) |
Race in Laton
The most populous races in Laton are White / Caucasian (1,076 | 82.7%), Hispanic or Latino (842 | 64.7%), and Some other Race (125 | 9.6%).
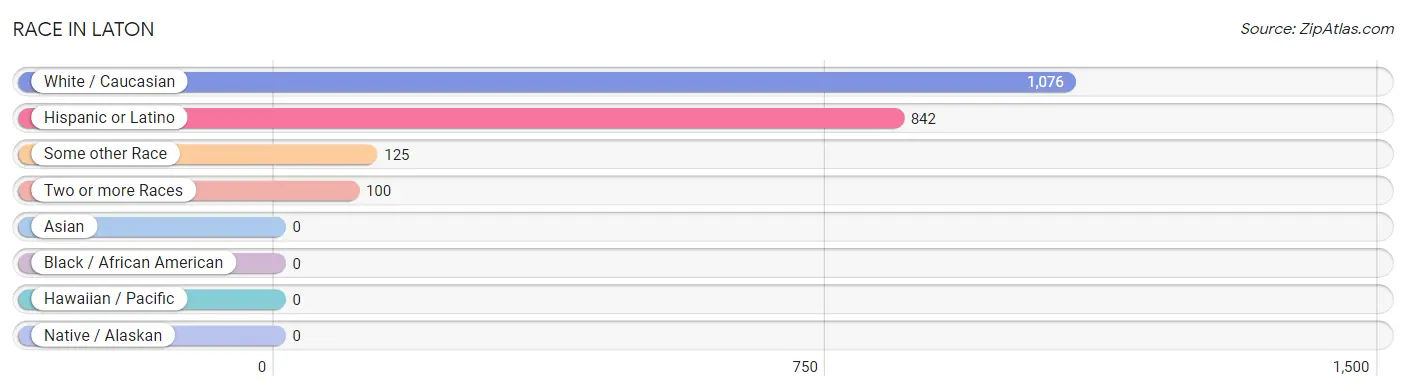
| Race | # Population | % Population |
| Asian | 0 | 0.0% |
| Black / African American | 0 | 0.0% |
| Hawaiian / Pacific | 0 | 0.0% |
| Hispanic or Latino | 842 | 64.7% |
| Native / Alaskan | 0 | 0.0% |
| White / Caucasian | 1,076 | 82.7% |
| Two or more Races | 100 | 7.7% |
| Some other Race | 125 | 9.6% |
| Total | 1,301 | 100.0% |
Ancestry in Laton
The most populous ancestries reported in Laton are Mexican (842 | 64.7%), German (83 | 6.4%), Portuguese (60 | 4.6%), Swedish (47 | 3.6%), and English (40 | 3.1%), together accounting for 82.4% of all Laton residents.
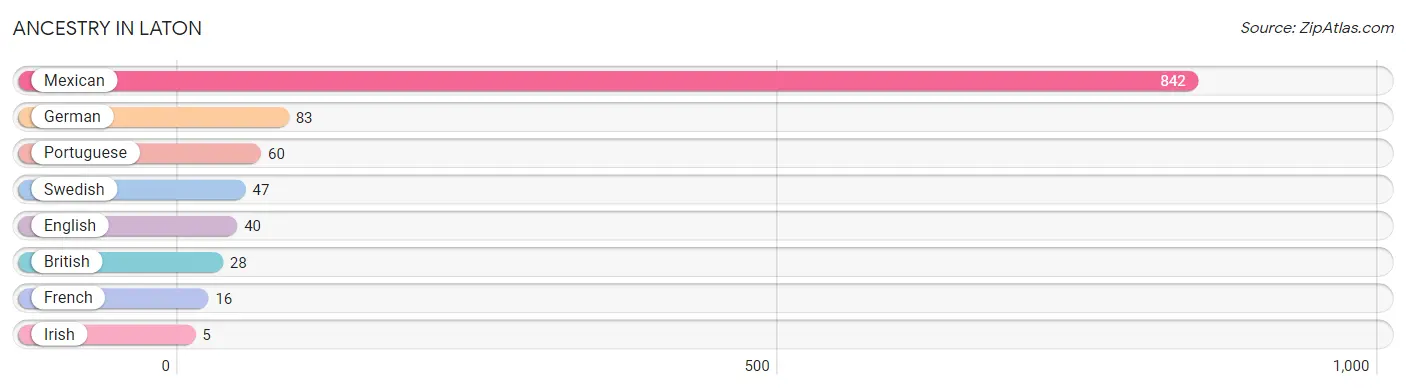
| Ancestry | # Population | % Population |
| British | 28 | 2.1% |
| English | 40 | 3.1% |
| French | 16 | 1.2% |
| German | 83 | 6.4% |
| Irish | 5 | 0.4% |
| Mexican | 842 | 64.7% |
| Portuguese | 60 | 4.6% |
| Swedish | 47 | 3.6% | View All 8 Rows |
Immigrants in Laton
The most numerous immigrant groups reported in Laton came from Central America (225 | 17.3%), Latin America (225 | 17.3%), Mexico (225 | 17.3%), Europe (28 | 2.1%), and Portugal (28 | 2.1%), together accounting for 56.2% of all Laton residents.
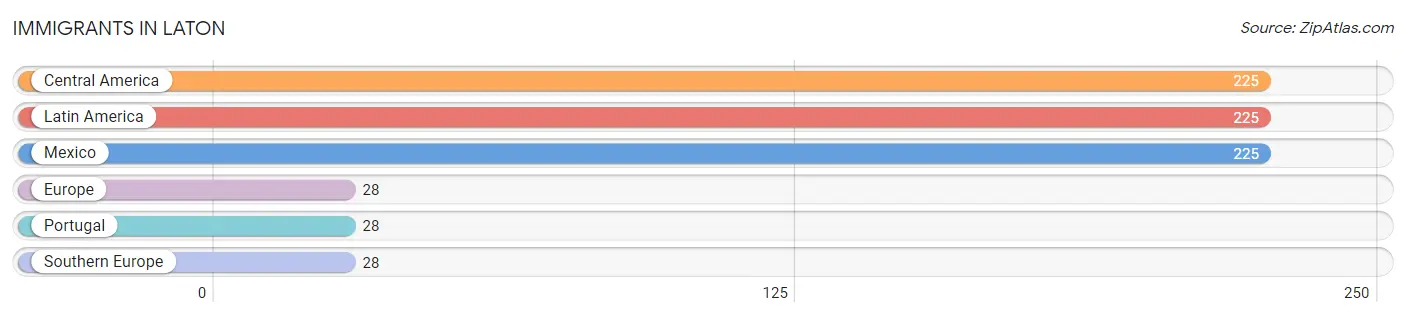
| Immigration Origin | # Population | % Population |
| Central America | 225 | 17.3% |
| Europe | 28 | 2.1% |
| Latin America | 225 | 17.3% |
| Mexico | 225 | 17.3% |
| Portugal | 28 | 2.1% |
| Southern Europe | 28 | 2.1% | View All 6 Rows |
Sex and Age in Laton
Sex and Age in Laton
The most populous age groups in Laton are 15 to 19 Years (142 | 20.1%) for men and 20 to 24 Years (81 | 13.6%) for women.
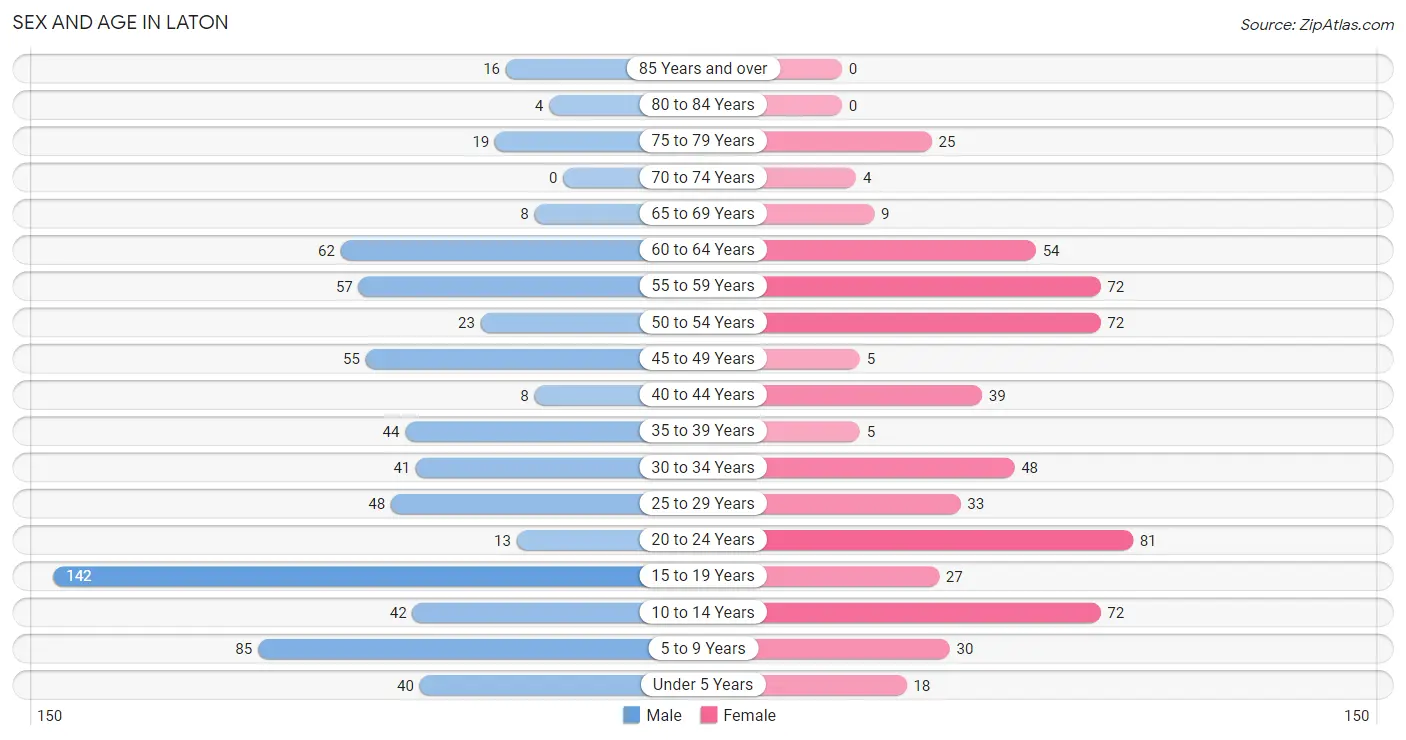
| Age Bracket | Male | Female |
| Under 5 Years | 40 (5.7%) | 18 (3.0%) |
| 5 to 9 Years | 85 (12.0%) | 30 (5.1%) |
| 10 to 14 Years | 42 (5.9%) | 72 (12.1%) |
| 15 to 19 Years | 142 (20.1%) | 27 (4.5%) |
| 20 to 24 Years | 13 (1.8%) | 81 (13.6%) |
| 25 to 29 Years | 48 (6.8%) | 33 (5.6%) |
| 30 to 34 Years | 41 (5.8%) | 48 (8.1%) |
| 35 to 39 Years | 44 (6.2%) | 5 (0.8%) |
| 40 to 44 Years | 8 (1.1%) | 39 (6.6%) |
| 45 to 49 Years | 55 (7.8%) | 5 (0.8%) |
| 50 to 54 Years | 23 (3.3%) | 72 (12.1%) |
| 55 to 59 Years | 57 (8.1%) | 72 (12.1%) |
| 60 to 64 Years | 62 (8.8%) | 54 (9.1%) |
| 65 to 69 Years | 8 (1.1%) | 9 (1.5%) |
| 70 to 74 Years | 0 (0.0%) | 4 (0.7%) |
| 75 to 79 Years | 19 (2.7%) | 25 (4.2%) |
| 80 to 84 Years | 4 (0.6%) | 0 (0.0%) |
| 85 Years and over | 16 (2.3%) | 0 (0.0%) |
| Total | 707 (100.0%) | 594 (100.0%) |
Families and Households in Laton
Median Family Size in Laton
The median family size in Laton is 3.85 persons per family, with married-couple families (259 | 81.7%) accounting for the largest median family size of 4.13 persons per family. On the other hand, single female/mother families (31 | 9.8%) represent the smallest median family size with 2.52 persons per family.
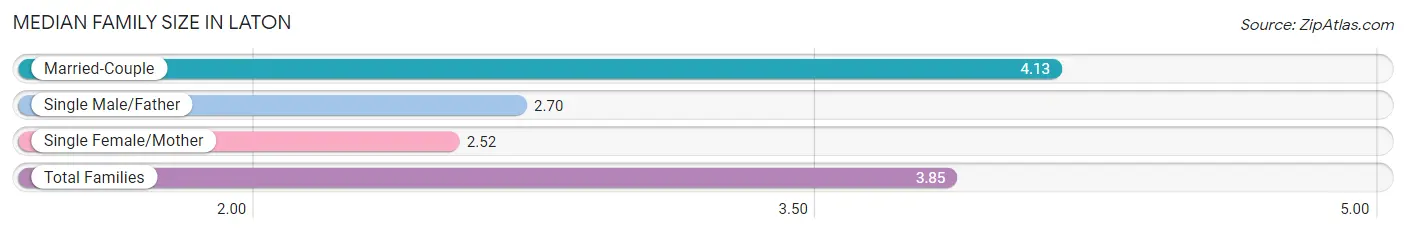
| Family Type | # Families | Family Size |
| Married-Couple | 259 (81.7%) | 4.13 |
| Single Male/Father | 27 (8.5%) | 2.70 |
| Single Female/Mother | 31 (9.8%) | 2.52 |
| Total Families | 317 (100.0%) | 3.85 |
Median Household Size in Laton
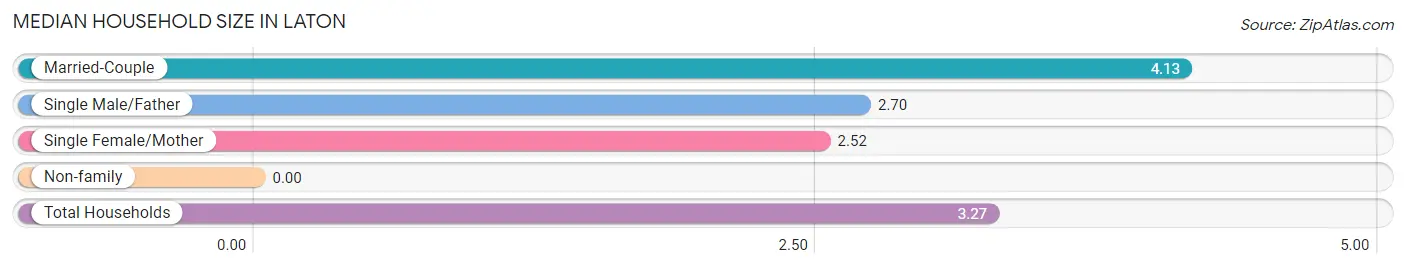
| Household Type | # Households | Household Size |
| Married-Couple | 259 (65.1%) | 4.13 |
| Single Male/Father | 27 (6.8%) | 2.70 |
| Single Female/Mother | 31 (7.8%) | 2.52 |
| Non-family | 81 (20.3%) | - |
| Total Households | 398 (100.0%) | 3.27 |
Household Size by Marriage Status in Laton
Out of a total of 398 households in Laton, 317 (79.6%) are family households, while 81 (20.3%) are nonfamily households. The most numerous type of family households are 4-person households, comprising 128, and the most common type of nonfamily households are 1-person households, comprising 81.
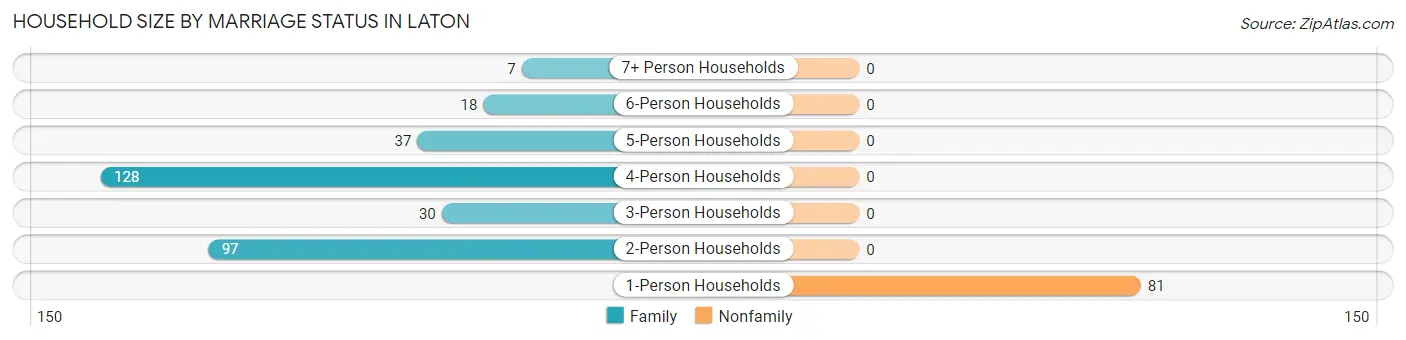
| Household Size | Family Households | Nonfamily Households |
| 1-Person Households | - | 81 (20.3%) |
| 2-Person Households | 97 (24.4%) | 0 (0.0%) |
| 3-Person Households | 30 (7.5%) | 0 (0.0%) |
| 4-Person Households | 128 (32.2%) | 0 (0.0%) |
| 5-Person Households | 37 (9.3%) | 0 (0.0%) |
| 6-Person Households | 18 (4.5%) | 0 (0.0%) |
| 7+ Person Households | 7 (1.8%) | 0 (0.0%) |
| Total | 317 (79.6%) | 81 (20.3%) |
Female Fertility in Laton
Fertility by Age in Laton
Average fertility rate in Laton is 66.0 births per 1,000 women. Women in the age bracket of 20 to 34 years have the highest fertility rate with 99.0 births per 1,000 women. Women in the age bracket of 20 to 34 years acount for 100.0% of all women with births.
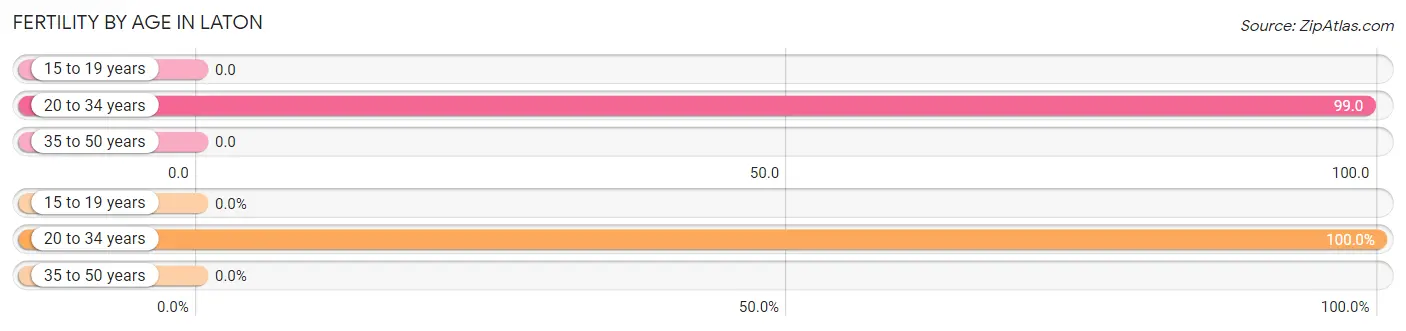
| Age Bracket | Women with Births | Births / 1,000 Women |
| 15 to 19 years | 0 (0.0%) | 0.0 |
| 20 to 34 years | 16 (100.0%) | 99.0 |
| 35 to 50 years | 0 (0.0%) | 0.0 |
| Total | 16 (100.0%) | 66.0 |
Fertility by Age by Marriage Status in Laton
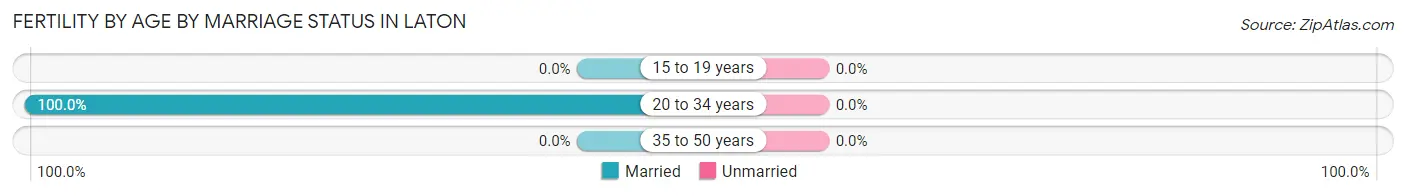
| Age Bracket | Married | Unmarried |
| 15 to 19 years | 0 (0.0%) | 0 (0.0%) |
| 20 to 34 years | 16 (100.0%) | 0 (0.0%) |
| 35 to 50 years | 0 (0.0%) | 0 (0.0%) |
| Total | 16 (100.0%) | 0 (0.0%) |
Fertility by Education in Laton
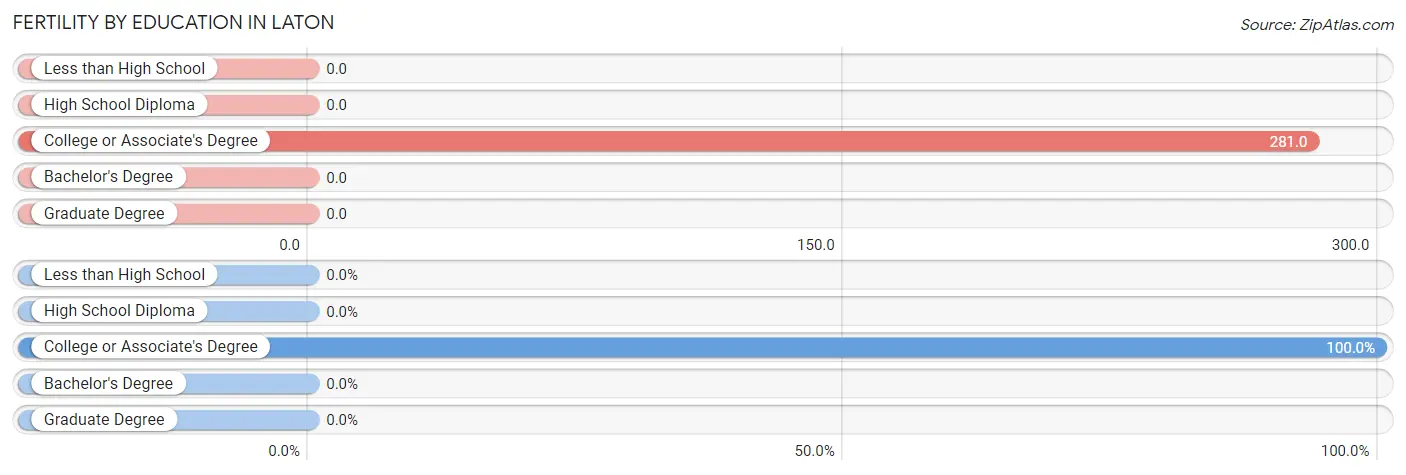
| Educational Attainment | Women with Births | Births / 1,000 Women |
| Less than High School | 0 (0.0%) | 0.0 |
| High School Diploma | 0 (0.0%) | 0.0 |
| College or Associate's Degree | 16 (100.0%) | 281.0 |
| Bachelor's Degree | 0 (0.0%) | 0.0 |
| Graduate Degree | 0 (0.0%) | 0.0 |
| Total | 16 (100.0%) | 66.0 |
Fertility by Education by Marriage Status in Laton
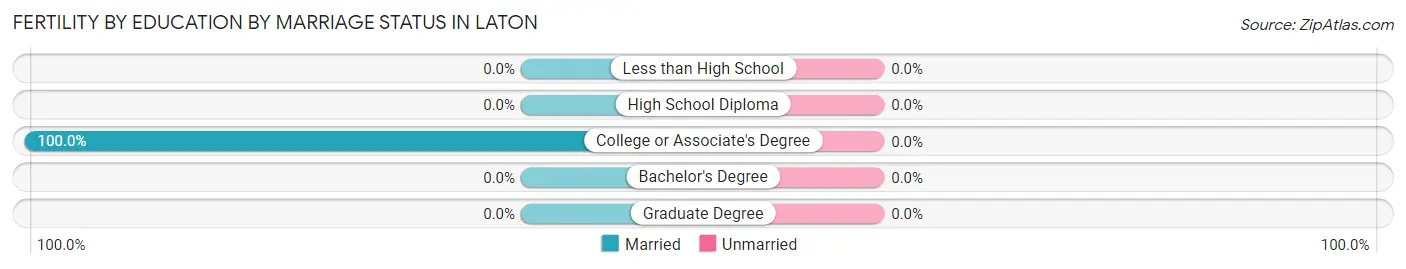
| Educational Attainment | Married | Unmarried |
| Less than High School | 0 (0.0%) | 0 (0.0%) |
| High School Diploma | 0 (0.0%) | 0 (0.0%) |
| College or Associate's Degree | 16 (100.0%) | 0 (0.0%) |
| Bachelor's Degree | 0 (0.0%) | 0 (0.0%) |
| Graduate Degree | 0 (0.0%) | 0 (0.0%) |
| Total | 16 (100.0%) | 0 (0.0%) |
Employment Characteristics in Laton
Employment by Class of Employer in Laton
Among the 531 employed individuals in Laton, private company employees (432 | 81.4%), self-employed (not incorporated) (61 | 11.5%), and local government employees (31 | 5.8%) make up the most common classes of employment.
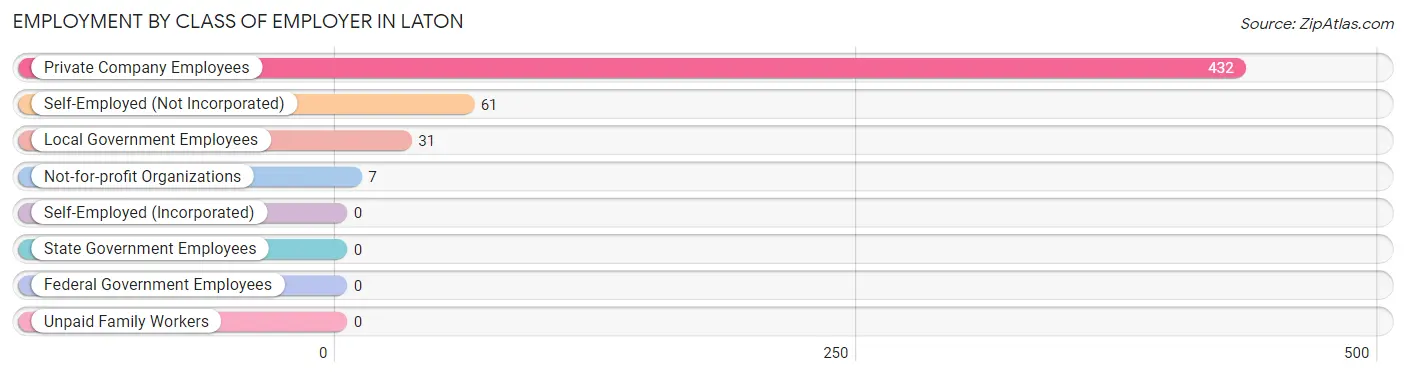
| Employer Class | # Employees | % Employees |
| Private Company Employees | 432 | 81.4% |
| Self-Employed (Incorporated) | 0 | 0.0% |
| Self-Employed (Not Incorporated) | 61 | 11.5% |
| Not-for-profit Organizations | 7 | 1.3% |
| Local Government Employees | 31 | 5.8% |
| State Government Employees | 0 | 0.0% |
| Federal Government Employees | 0 | 0.0% |
| Unpaid Family Workers | 0 | 0.0% |
| Total | 531 | 100.0% |
Employment Status by Age in Laton
According to the labor force statistics for Laton, out of the total population over 16 years of age (917), 64.9% or 595 individuals are in the labor force, with 8.1% or 48 of them unemployed. The age group with the highest labor force participation rate is 30 to 34 years, with 100.0% or 89 individuals in the labor force. Within the labor force, the 16 to 19 years age range has the highest percentage of unemployed individuals, with 66.7% or 6 of them being unemployed.
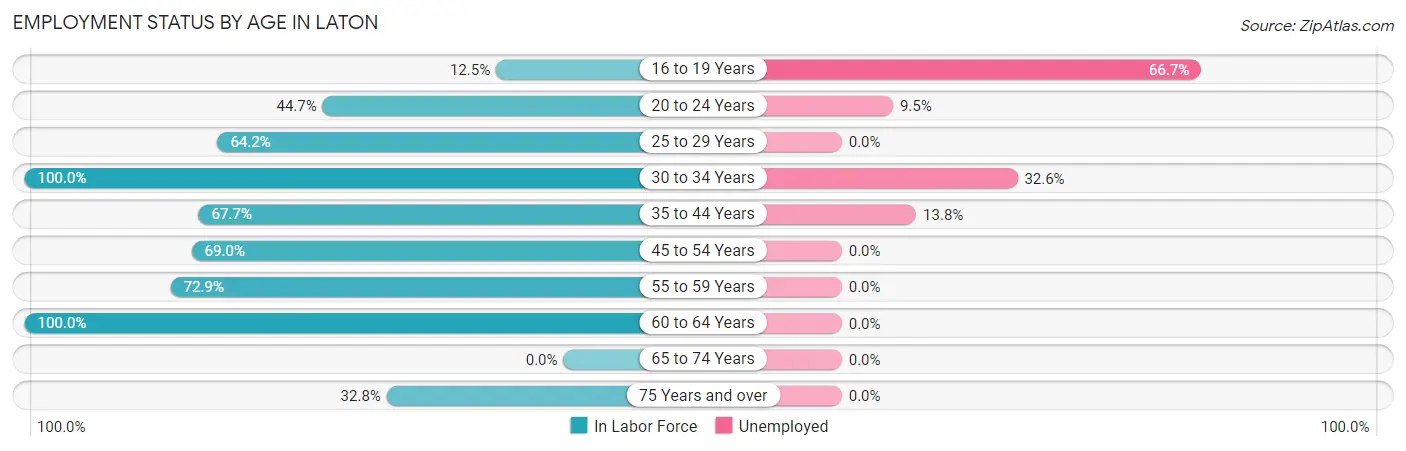
| Age Bracket | In Labor Force | Unemployed |
| 16 to 19 Years | 9 (12.5%) | 6 (66.7%) |
| 20 to 24 Years | 42 (44.7%) | 4 (9.5%) |
| 25 to 29 Years | 52 (64.2%) | 0 (0.0%) |
| 30 to 34 Years | 89 (100.0%) | 29 (32.6%) |
| 35 to 44 Years | 65 (67.7%) | 9 (13.8%) |
| 45 to 54 Years | 107 (69.0%) | 0 (0.0%) |
| 55 to 59 Years | 94 (72.9%) | 0 (0.0%) |
| 60 to 64 Years | 116 (100.0%) | 0 (0.0%) |
| 65 to 74 Years | 0 (0.0%) | 0 (0.0%) |
| 75 Years and over | 21 (32.8%) | 0 (0.0%) |
| Total | 595 (64.9%) | 48 (8.1%) |
Employment Status by Educational Attainment in Laton
According to labor force statistics for Laton, 78.5% of individuals (523) out of the total population between 25 and 64 years of age (666) are in the labor force, with 7.3% or 38 of them being unemployed. The group with the highest labor force participation rate are those with the educational attainment of high school diploma, with 100.0% or 222 individuals in the labor force. Within the labor force, individuals with high school diploma education have the highest percentage of unemployment, with 11.3% or 25 of them being unemployed.
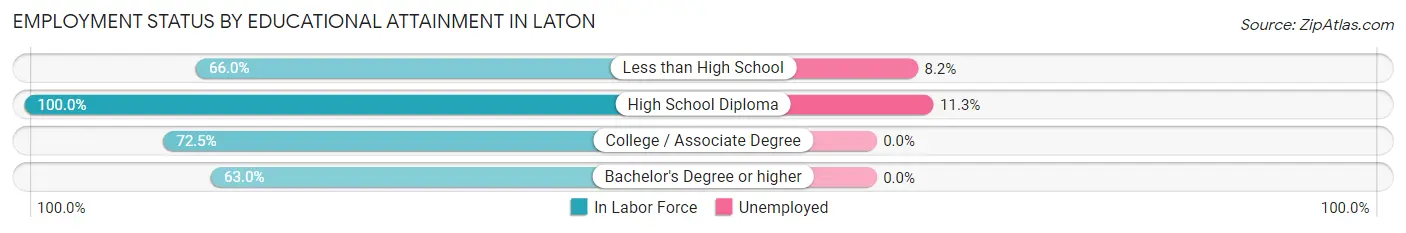
| Educational Attainment | In Labor Force | Unemployed |
| Less than High School | 159 (66.0%) | 20 (8.2%) |
| High School Diploma | 222 (100.0%) | 25 (11.3%) |
| College / Associate Degree | 108 (72.5%) | 0 (0.0%) |
| Bachelor's Degree or higher | 34 (63.0%) | 0 (0.0%) |
| Total | 523 (78.5%) | 49 (7.3%) |
Employment Occupations by Sex in Laton
Management, Business, Science and Arts Occupations
The most common Management, Business, Science and Arts occupations in Laton are Management (62 | 11.3%), Computers, Engineering & Science (5 | 0.9%), and Architecture & Engineering (5 | 0.9%).
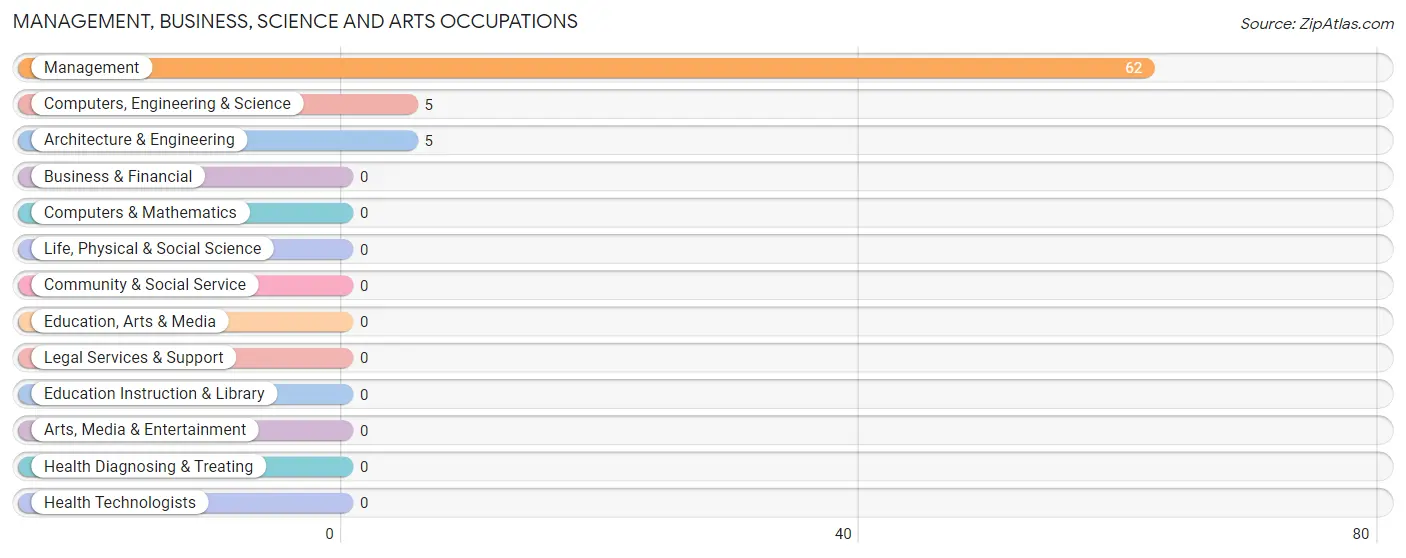
Management, Business, Science and Arts Occupations by Sex
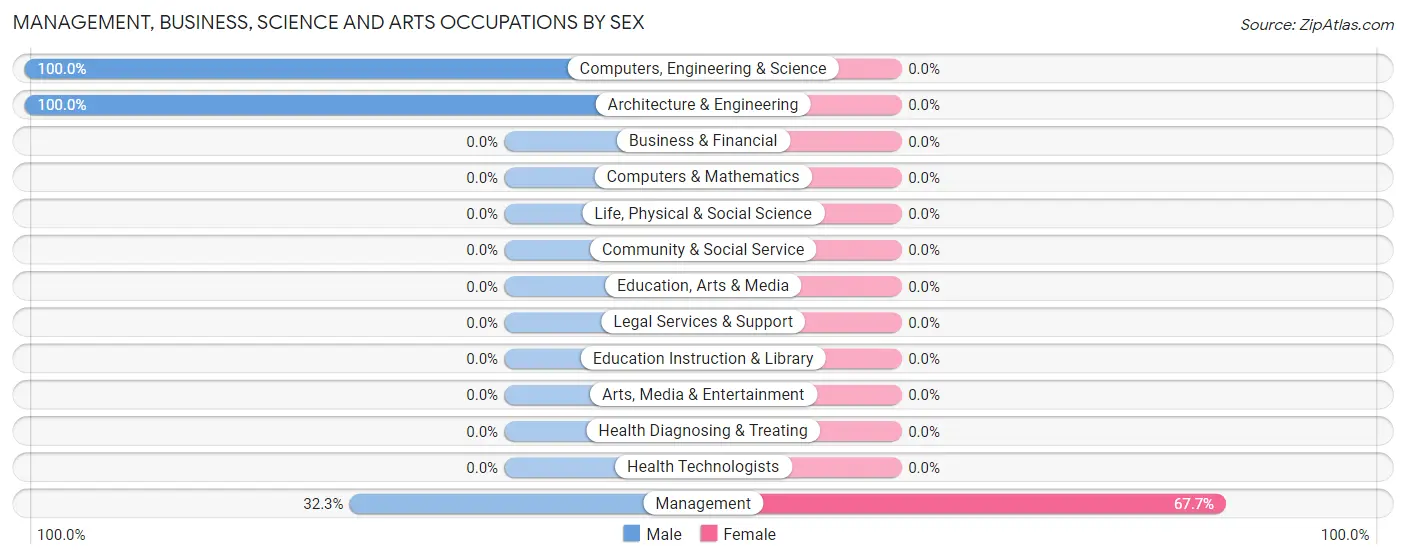
| Occupation | Male | Female |
| Management | 20 (32.3%) | 42 (67.7%) |
| Business & Financial | 0 (0.0%) | 0 (0.0%) |
| Computers, Engineering & Science | 5 (100.0%) | 0 (0.0%) |
| Computers & Mathematics | 0 (0.0%) | 0 (0.0%) |
| Architecture & Engineering | 5 (100.0%) | 0 (0.0%) |
| Life, Physical & Social Science | 0 (0.0%) | 0 (0.0%) |
| Community & Social Service | 0 (0.0%) | 0 (0.0%) |
| Education, Arts & Media | 0 (0.0%) | 0 (0.0%) |
| Legal Services & Support | 0 (0.0%) | 0 (0.0%) |
| Education Instruction & Library | 0 (0.0%) | 0 (0.0%) |
| Arts, Media & Entertainment | 0 (0.0%) | 0 (0.0%) |
| Health Diagnosing & Treating | 0 (0.0%) | 0 (0.0%) |
| Health Technologists | 0 (0.0%) | 0 (0.0%) |
| Total (Category) | 25 (37.3%) | 42 (62.7%) |
| Total (Overall) | 319 (58.3%) | 228 (41.7%) |
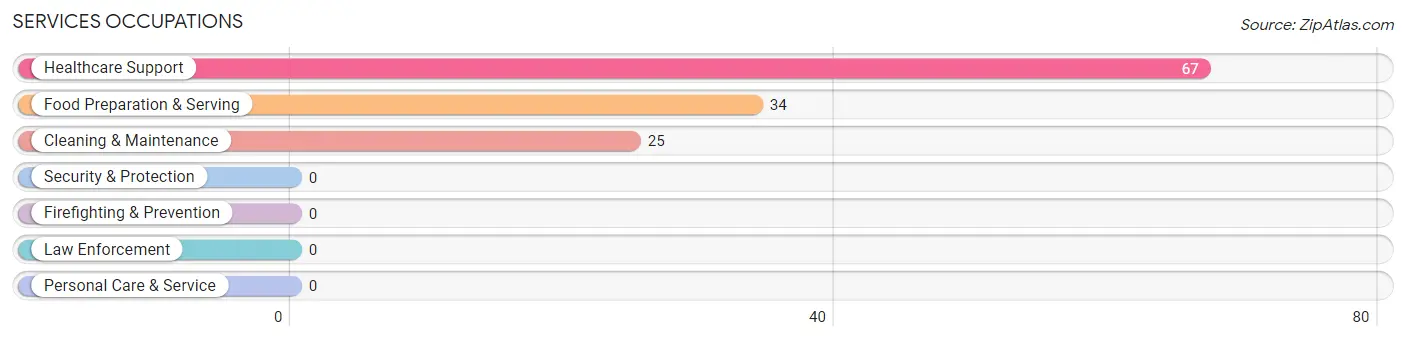
Services Occupations
The most common Services occupations in Laton are Healthcare Support (67 | 12.2%), Food Preparation & Serving (34 | 6.2%), and Cleaning & Maintenance (25 | 4.6%).
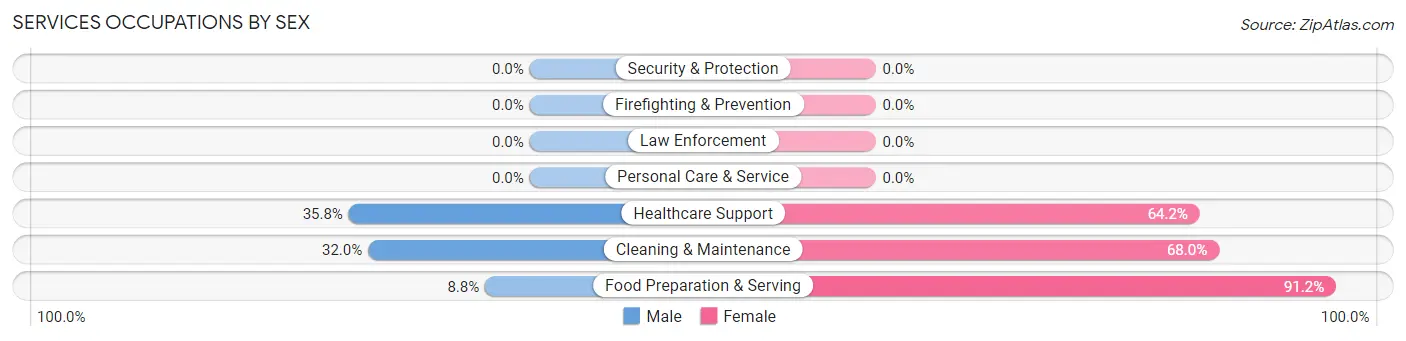
Services Occupations by Sex
Within the Services occupations in Laton, the most male-oriented occupations are Healthcare Support (35.8%), Cleaning & Maintenance (32.0%), and Food Preparation & Serving (8.8%), while the most female-oriented occupations are Food Preparation & Serving (91.2%), Cleaning & Maintenance (68.0%), and Healthcare Support (64.2%).
| Occupation | Male | Female |
| Healthcare Support | 24 (35.8%) | 43 (64.2%) |
| Security & Protection | 0 (0.0%) | 0 (0.0%) |
| Firefighting & Prevention | 0 (0.0%) | 0 (0.0%) |
| Law Enforcement | 0 (0.0%) | 0 (0.0%) |
| Food Preparation & Serving | 3 (8.8%) | 31 (91.2%) |
| Cleaning & Maintenance | 8 (32.0%) | 17 (68.0%) |
| Personal Care & Service | 0 (0.0%) | 0 (0.0%) |
| Total (Category) | 35 (27.8%) | 91 (72.2%) |
| Total (Overall) | 319 (58.3%) | 228 (41.7%) |
Sales and Office Occupations
The most common Sales and Office occupations in Laton are Sales & Related (102 | 18.6%), and Office & Administration (5 | 0.9%).
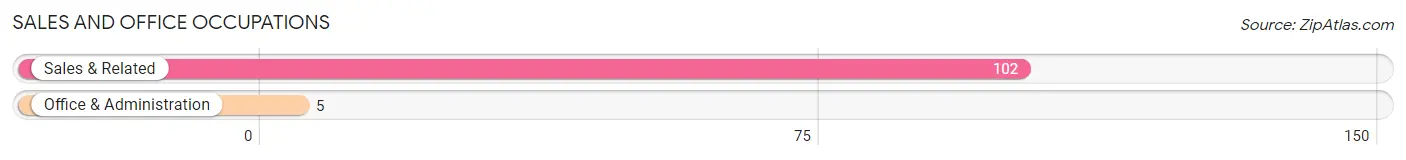
Sales and Office Occupations by Sex
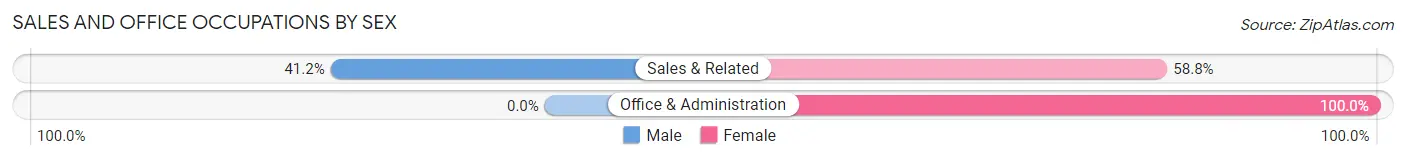
| Occupation | Male | Female |
| Sales & Related | 42 (41.2%) | 60 (58.8%) |
| Office & Administration | 0 (0.0%) | 5 (100.0%) |
| Total (Category) | 42 (39.3%) | 65 (60.8%) |
| Total (Overall) | 319 (58.3%) | 228 (41.7%) |
Natural Resources, Construction and Maintenance Occupations
The most common Natural Resources, Construction and Maintenance occupations in Laton are Farming, Fishing & Forestry (151 | 27.6%), Construction & Extraction (18 | 3.3%), and Installation, Maintenance & Repair (2 | 0.4%).
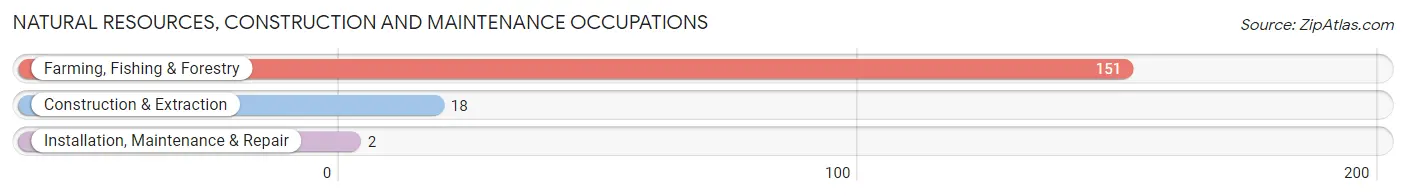
Natural Resources, Construction and Maintenance Occupations by Sex
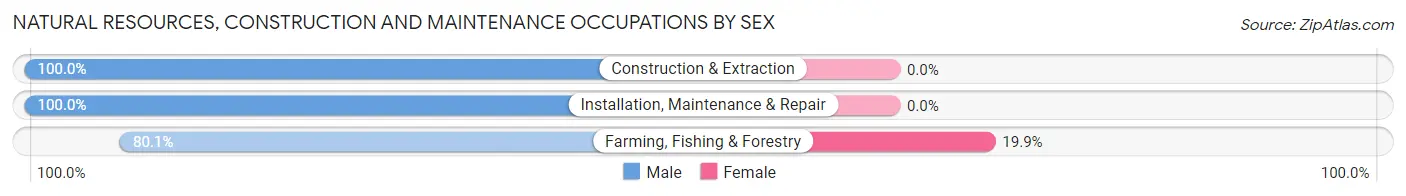
| Occupation | Male | Female |
| Farming, Fishing & Forestry | 121 (80.1%) | 30 (19.9%) |
| Construction & Extraction | 18 (100.0%) | 0 (0.0%) |
| Installation, Maintenance & Repair | 2 (100.0%) | 0 (0.0%) |
| Total (Category) | 141 (82.5%) | 30 (17.5%) |
| Total (Overall) | 319 (58.3%) | 228 (41.7%) |
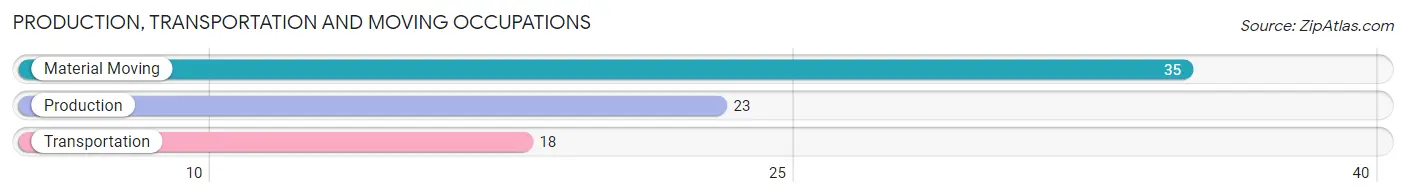
Production, Transportation and Moving Occupations
The most common Production, Transportation and Moving occupations in Laton are Material Moving (35 | 6.4%), Production (23 | 4.2%), and Transportation (18 | 3.3%).
Production, Transportation and Moving Occupations by Sex
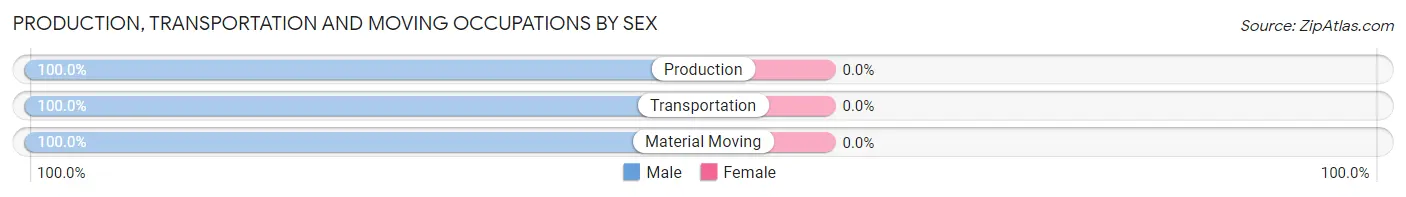
| Occupation | Male | Female |
| Production | 23 (100.0%) | 0 (0.0%) |
| Transportation | 18 (100.0%) | 0 (0.0%) |
| Material Moving | 35 (100.0%) | 0 (0.0%) |
| Total (Category) | 76 (100.0%) | 0 (0.0%) |
| Total (Overall) | 319 (58.3%) | 228 (41.7%) |
Employment Industries by Sex in Laton
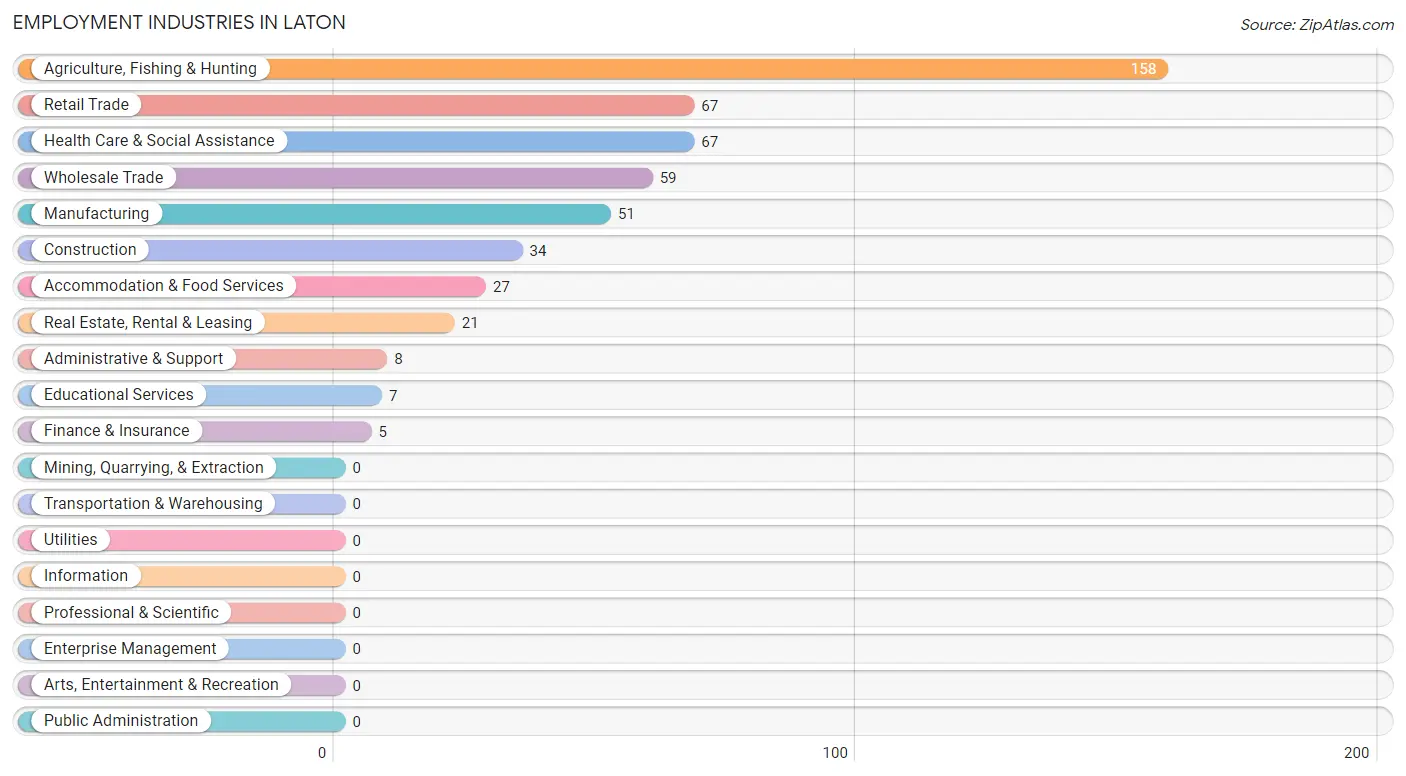
Employment Industries in Laton
The major employment industries in Laton include Agriculture, Fishing & Hunting (158 | 28.9%), Retail Trade (67 | 12.2%), Health Care & Social Assistance (67 | 12.2%), Wholesale Trade (59 | 10.8%), and Manufacturing (51 | 9.3%).
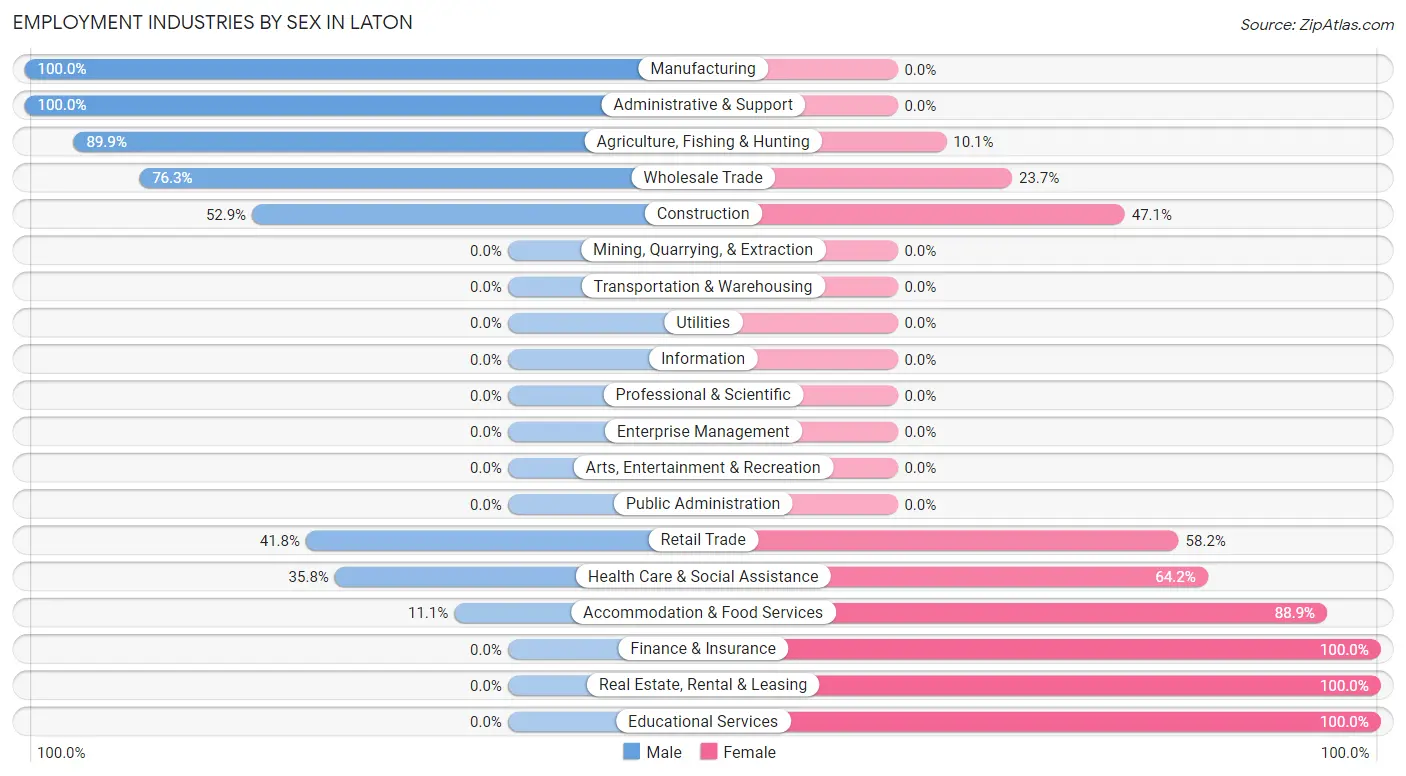
Employment Industries by Sex in Laton
The Laton industries that see more men than women are Manufacturing (100.0%), Administrative & Support (100.0%), and Agriculture, Fishing & Hunting (89.9%), whereas the industries that tend to have a higher number of women are Finance & Insurance (100.0%), Real Estate, Rental & Leasing (100.0%), and Educational Services (100.0%).
| Industry | Male | Female |
| Agriculture, Fishing & Hunting | 142 (89.9%) | 16 (10.1%) |
| Mining, Quarrying, & Extraction | 0 (0.0%) | 0 (0.0%) |
| Construction | 18 (52.9%) | 16 (47.1%) |
| Manufacturing | 51 (100.0%) | 0 (0.0%) |
| Wholesale Trade | 45 (76.3%) | 14 (23.7%) |
| Retail Trade | 28 (41.8%) | 39 (58.2%) |
| Transportation & Warehousing | 0 (0.0%) | 0 (0.0%) |
| Utilities | 0 (0.0%) | 0 (0.0%) |
| Information | 0 (0.0%) | 0 (0.0%) |
| Finance & Insurance | 0 (0.0%) | 5 (100.0%) |
| Real Estate, Rental & Leasing | 0 (0.0%) | 21 (100.0%) |
| Professional & Scientific | 0 (0.0%) | 0 (0.0%) |
| Enterprise Management | 0 (0.0%) | 0 (0.0%) |
| Administrative & Support | 8 (100.0%) | 0 (0.0%) |
| Educational Services | 0 (0.0%) | 7 (100.0%) |
| Health Care & Social Assistance | 24 (35.8%) | 43 (64.2%) |
| Arts, Entertainment & Recreation | 0 (0.0%) | 0 (0.0%) |
| Accommodation & Food Services | 3 (11.1%) | 24 (88.9%) |
| Public Administration | 0 (0.0%) | 0 (0.0%) |
| Total | 319 (58.3%) | 228 (41.7%) |
Education in Laton
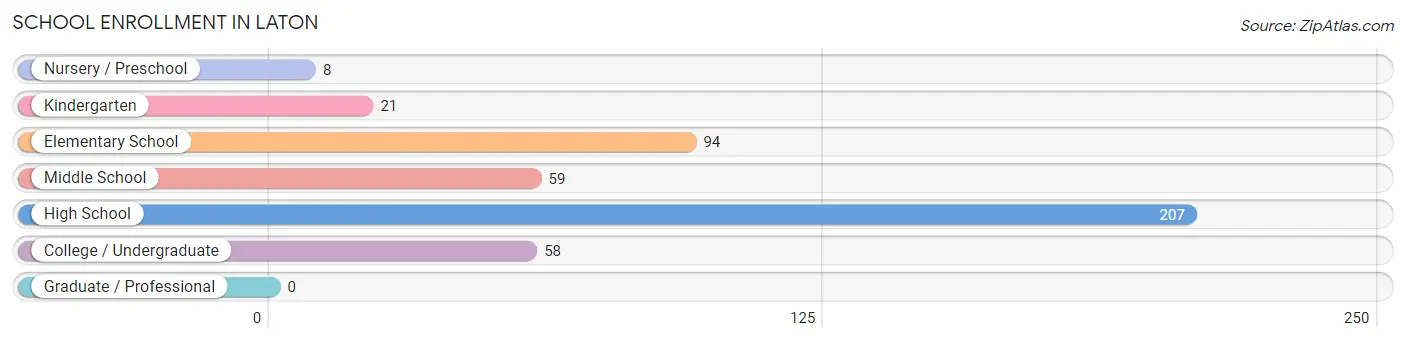
School Enrollment in Laton
The most common levels of schooling among the 447 students in Laton are high school (207 | 46.3%), elementary school (94 | 21.0%), and middle school (59 | 13.2%).
| School Level | # Students | % Students |
| Nursery / Preschool | 8 | 1.8% |
| Kindergarten | 21 | 4.7% |
| Elementary School | 94 | 21.0% |
| Middle School | 59 | 13.2% |
| High School | 207 | 46.3% |
| College / Undergraduate | 58 | 13.0% |
| Graduate / Professional | 0 | 0.0% |
| Total | 447 | 100.0% |
School Enrollment by Age by Funding Source in Laton
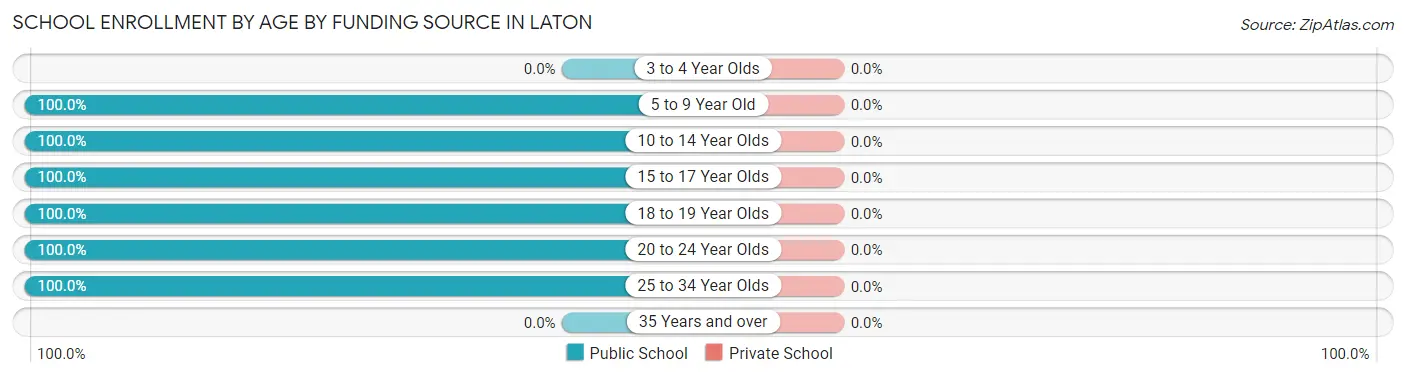
| Age Bracket | Public School | Private School |
| 3 to 4 Year Olds | 0 (0.0%) | 0 (0.0%) |
| 5 to 9 Year Old | 115 (100.0%) | 0 (0.0%) |
| 10 to 14 Year Olds | 114 (100.0%) | 0 (0.0%) |
| 15 to 17 Year Olds | 160 (100.0%) | 0 (0.0%) |
| 18 to 19 Year Olds | 9 (100.0%) | 0 (0.0%) |
| 20 to 24 Year Olds | 29 (100.0%) | 0 (0.0%) |
| 25 to 34 Year Olds | 20 (100.0%) | 0 (0.0%) |
| 35 Years and over | 0 (0.0%) | 0 (0.0%) |
| Total | 447 (100.0%) | 0 (0.0%) |
Educational Attainment by Field of Study in Laton
Arts & humanities (24 | 37.5%), social sciences (20 | 31.2%), engineering (5 | 7.8%), business (5 | 7.8%), and literature & languages (5 | 7.8%) are the most common fields of study among 64 individuals in Laton who have obtained a bachelor's degree or higher.
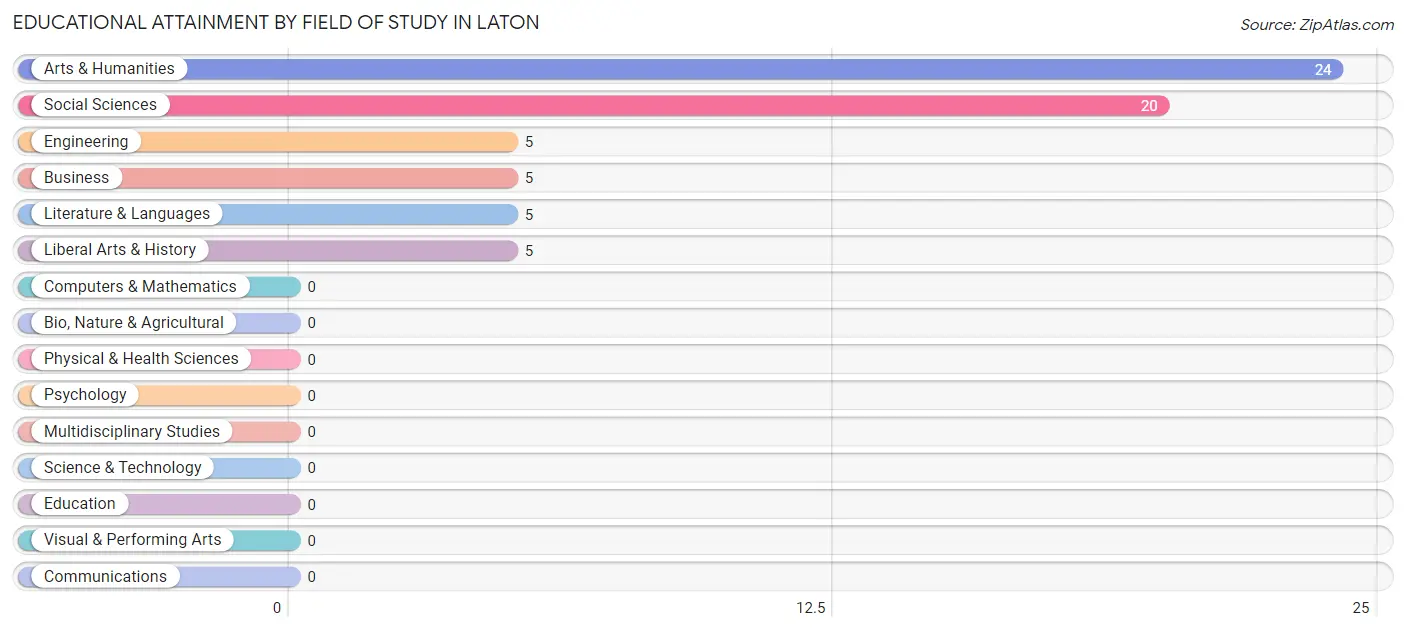
| Field of Study | # Graduates | % Graduates |
| Computers & Mathematics | 0 | 0.0% |
| Bio, Nature & Agricultural | 0 | 0.0% |
| Physical & Health Sciences | 0 | 0.0% |
| Psychology | 0 | 0.0% |
| Social Sciences | 20 | 31.2% |
| Engineering | 5 | 7.8% |
| Multidisciplinary Studies | 0 | 0.0% |
| Science & Technology | 0 | 0.0% |
| Business | 5 | 7.8% |
| Education | 0 | 0.0% |
| Literature & Languages | 5 | 7.8% |
| Liberal Arts & History | 5 | 7.8% |
| Visual & Performing Arts | 0 | 0.0% |
| Communications | 0 | 0.0% |
| Arts & Humanities | 24 | 37.5% |
| Total | 64 | 100.0% |
Transportation & Commute in Laton
Vehicle Availability by Sex in Laton
The most prevalent vehicle ownership categories in Laton are males with 3 vehicles (132, accounting for 41.4%) and females with 3 vehicles (49, making up 62.3%).
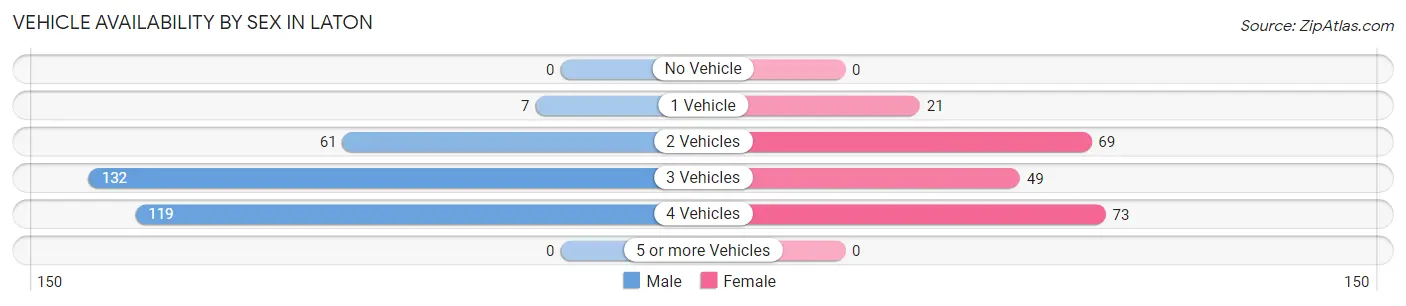
| Vehicles Available | Male | Female |
| No Vehicle | 0 (0.0%) | 0 (0.0%) |
| 1 Vehicle | 7 (2.2%) | 21 (9.9%) |
| 2 Vehicles | 61 (19.1%) | 69 (32.6%) |
| 3 Vehicles | 132 (41.4%) | 49 (23.1%) |
| 4 Vehicles | 119 (37.3%) | 73 (34.4%) |
| 5 or more Vehicles | 0 (0.0%) | 0 (0.0%) |
| Total | 319 (100.0%) | 212 (100.0%) |
Commute Time in Laton
The most frequently occuring commute durations in Laton are 15 to 19 minutes (142 commuters, 26.7%), 20 to 24 minutes (133 commuters, 25.1%), and 10 to 14 minutes (71 commuters, 13.4%).
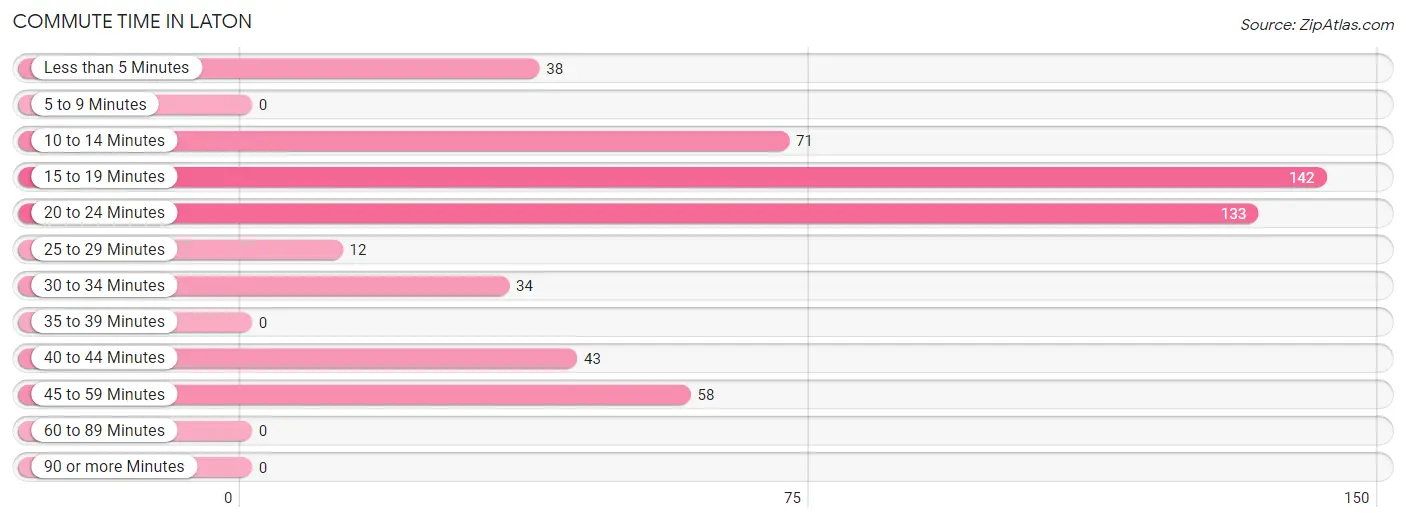
| Commute Time | # Commuters | % Commuters |
| Less than 5 Minutes | 38 | 7.2% |
| 5 to 9 Minutes | 0 | 0.0% |
| 10 to 14 Minutes | 71 | 13.4% |
| 15 to 19 Minutes | 142 | 26.7% |
| 20 to 24 Minutes | 133 | 25.1% |
| 25 to 29 Minutes | 12 | 2.3% |
| 30 to 34 Minutes | 34 | 6.4% |
| 35 to 39 Minutes | 0 | 0.0% |
| 40 to 44 Minutes | 43 | 8.1% |
| 45 to 59 Minutes | 58 | 10.9% |
| 60 to 89 Minutes | 0 | 0.0% |
| 90 or more Minutes | 0 | 0.0% |
Commute Time by Sex in Laton
The most common commute times in Laton are 15 to 19 minutes (89 commuters, 27.9%) for males and 20 to 24 minutes (88 commuters, 41.5%) for females.
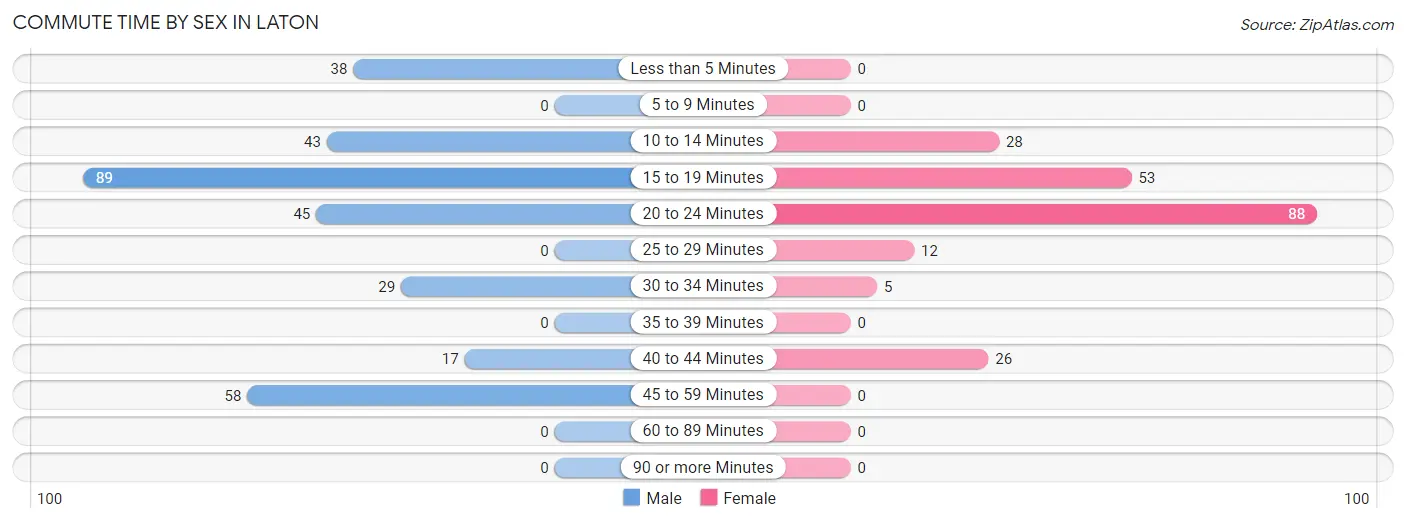
| Commute Time | Male | Female |
| Less than 5 Minutes | 38 (11.9%) | 0 (0.0%) |
| 5 to 9 Minutes | 0 (0.0%) | 0 (0.0%) |
| 10 to 14 Minutes | 43 (13.5%) | 28 (13.2%) |
| 15 to 19 Minutes | 89 (27.9%) | 53 (25.0%) |
| 20 to 24 Minutes | 45 (14.1%) | 88 (41.5%) |
| 25 to 29 Minutes | 0 (0.0%) | 12 (5.7%) |
| 30 to 34 Minutes | 29 (9.1%) | 5 (2.4%) |
| 35 to 39 Minutes | 0 (0.0%) | 0 (0.0%) |
| 40 to 44 Minutes | 17 (5.3%) | 26 (12.3%) |
| 45 to 59 Minutes | 58 (18.2%) | 0 (0.0%) |
| 60 to 89 Minutes | 0 (0.0%) | 0 (0.0%) |
| 90 or more Minutes | 0 (0.0%) | 0 (0.0%) |
Time of Departure to Work by Sex in Laton
The most frequent times of departure to work in Laton are 6:30 AM to 6:59 AM (101, 31.7%) for males and 8:00 AM to 8:29 AM (89, 42.0%) for females.
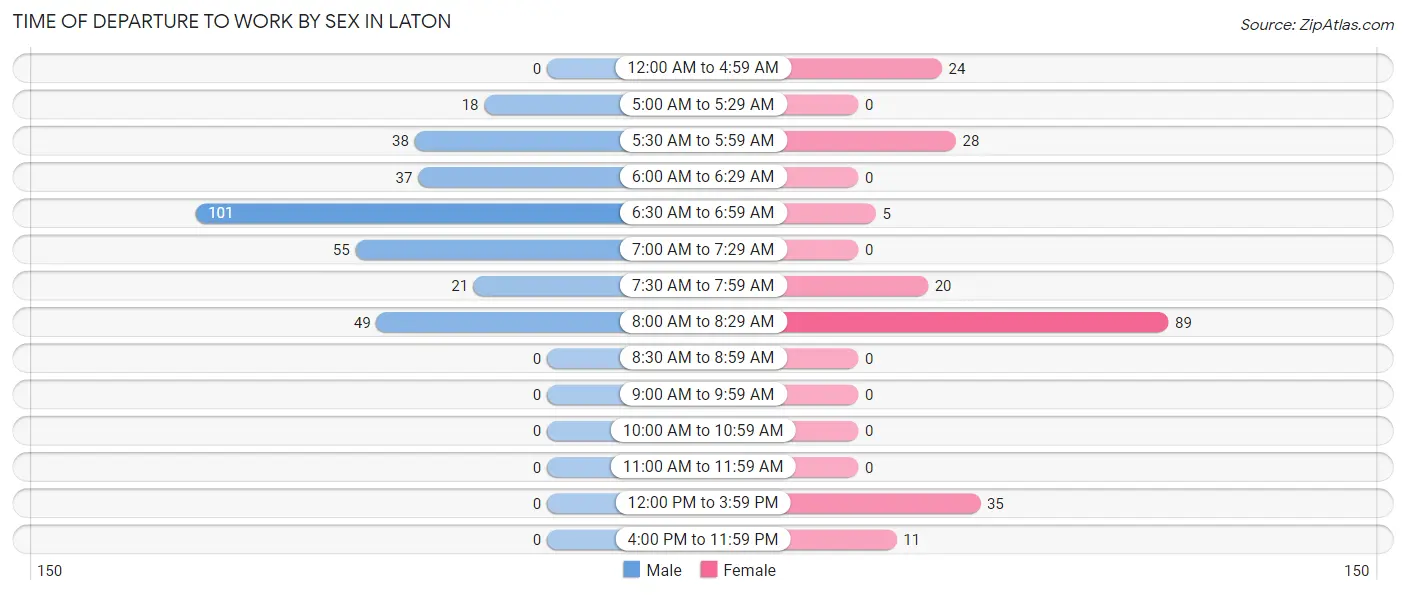
| Time of Departure | Male | Female |
| 12:00 AM to 4:59 AM | 0 (0.0%) | 24 (11.3%) |
| 5:00 AM to 5:29 AM | 18 (5.6%) | 0 (0.0%) |
| 5:30 AM to 5:59 AM | 38 (11.9%) | 28 (13.2%) |
| 6:00 AM to 6:29 AM | 37 (11.6%) | 0 (0.0%) |
| 6:30 AM to 6:59 AM | 101 (31.7%) | 5 (2.4%) |
| 7:00 AM to 7:29 AM | 55 (17.2%) | 0 (0.0%) |
| 7:30 AM to 7:59 AM | 21 (6.6%) | 20 (9.4%) |
| 8:00 AM to 8:29 AM | 49 (15.4%) | 89 (42.0%) |
| 8:30 AM to 8:59 AM | 0 (0.0%) | 0 (0.0%) |
| 9:00 AM to 9:59 AM | 0 (0.0%) | 0 (0.0%) |
| 10:00 AM to 10:59 AM | 0 (0.0%) | 0 (0.0%) |
| 11:00 AM to 11:59 AM | 0 (0.0%) | 0 (0.0%) |
| 12:00 PM to 3:59 PM | 0 (0.0%) | 35 (16.5%) |
| 4:00 PM to 11:59 PM | 0 (0.0%) | 11 (5.2%) |
| Total | 319 (100.0%) | 212 (100.0%) |
Housing Occupancy in Laton
Occupancy by Ownership in Laton
Of the total 398 dwellings in Laton, owner-occupied units account for 239 (60.1%), while renter-occupied units make up 159 (40.0%).
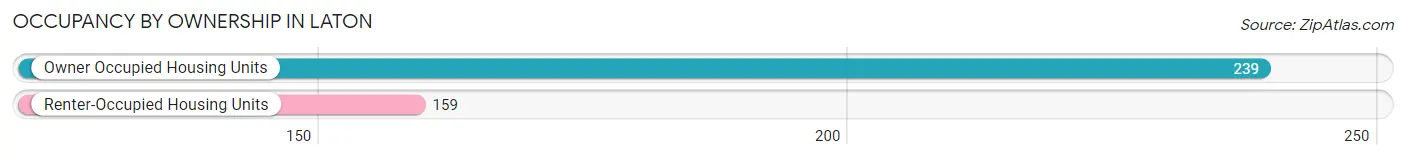
| Occupancy | # Housing Units | % Housing Units |
| Owner Occupied Housing Units | 239 | 60.1% |
| Renter-Occupied Housing Units | 159 | 40.0% |
| Total Occupied Housing Units | 398 | 100.0% |
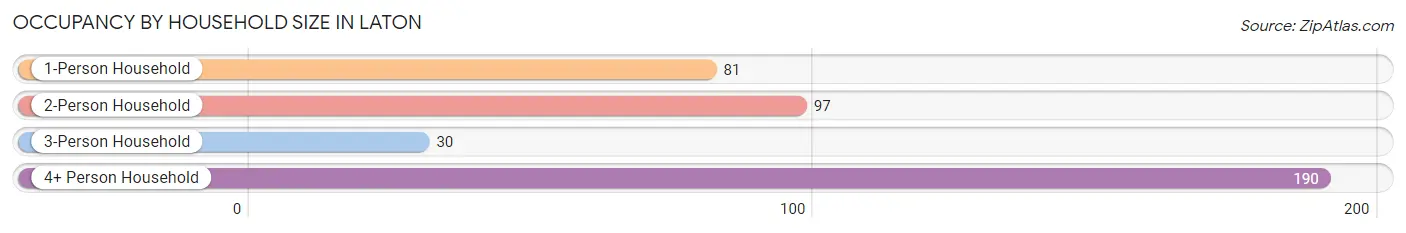
Occupancy by Household Size in Laton
| Household Size | # Housing Units | % Housing Units |
| 1-Person Household | 81 | 20.3% |
| 2-Person Household | 97 | 24.4% |
| 3-Person Household | 30 | 7.5% |
| 4+ Person Household | 190 | 47.7% |
| Total Housing Units | 398 | 100.0% |
Occupancy by Ownership by Household Size in Laton
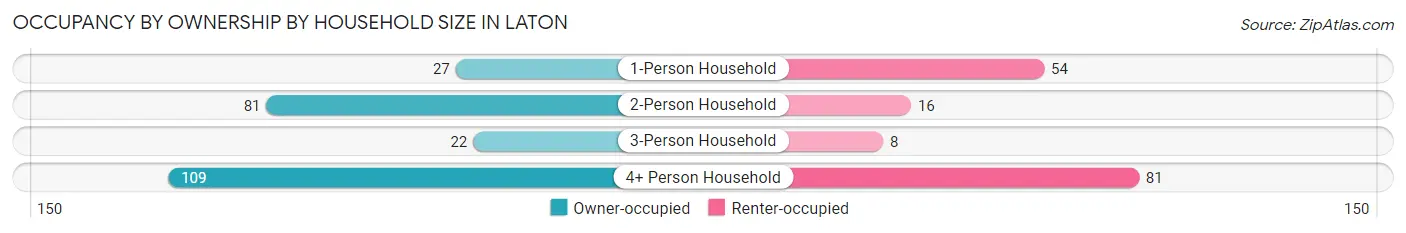
| Household Size | Owner-occupied | Renter-occupied |
| 1-Person Household | 27 (33.3%) | 54 (66.7%) |
| 2-Person Household | 81 (83.5%) | 16 (16.5%) |
| 3-Person Household | 22 (73.3%) | 8 (26.7%) |
| 4+ Person Household | 109 (57.4%) | 81 (42.6%) |
| Total Housing Units | 239 (60.1%) | 159 (40.0%) |
Occupancy by Educational Attainment in Laton
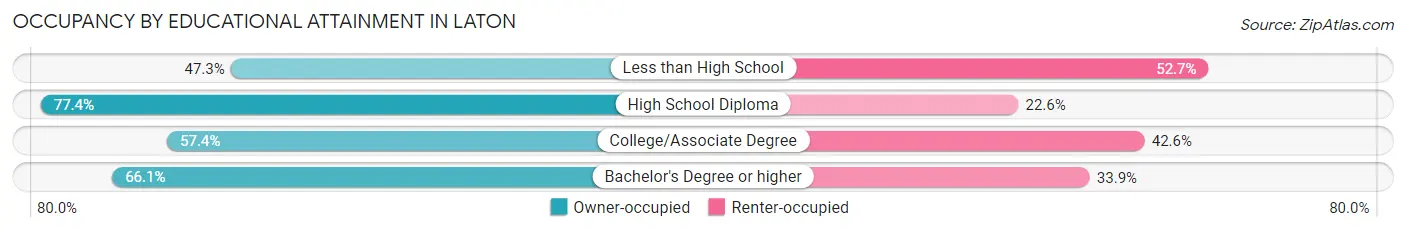
| Household Size | Owner-occupied | Renter-occupied |
| Less than High School | 62 (47.3%) | 69 (52.7%) |
| High School Diploma | 72 (77.4%) | 21 (22.6%) |
| College/Associate Degree | 66 (57.4%) | 49 (42.6%) |
| Bachelor's Degree or higher | 39 (66.1%) | 20 (33.9%) |
Occupancy by Age of Householder in Laton
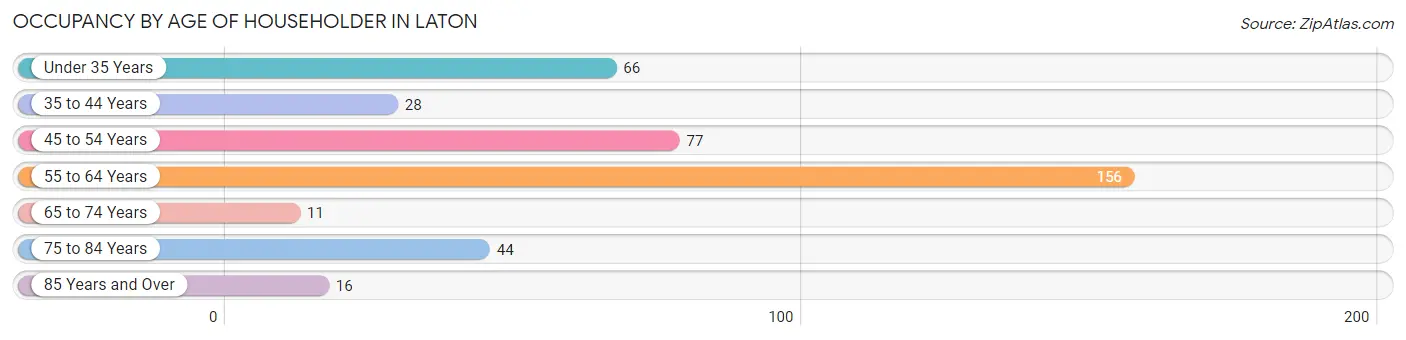
| Age Bracket | # Households | % Households |
| Under 35 Years | 66 | 16.6% |
| 35 to 44 Years | 28 | 7.0% |
| 45 to 54 Years | 77 | 19.4% |
| 55 to 64 Years | 156 | 39.2% |
| 65 to 74 Years | 11 | 2.8% |
| 75 to 84 Years | 44 | 11.1% |
| 85 Years and Over | 16 | 4.0% |
| Total | 398 | 100.0% |
Housing Finances in Laton
Median Income by Occupancy in Laton
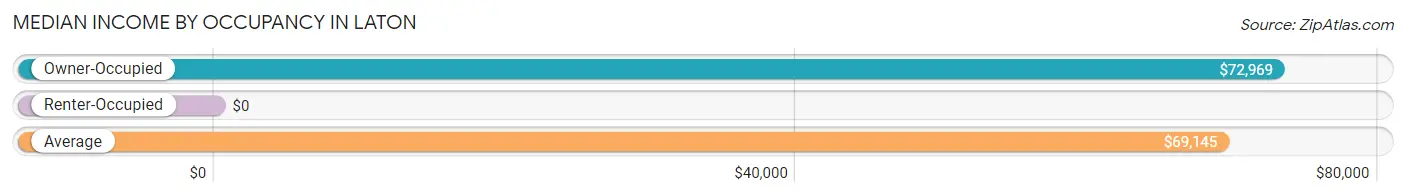
| Occupancy Type | # Households | Median Income |
| Owner-Occupied | 239 (60.1%) | $72,969 |
| Renter-Occupied | 159 (40.0%) | $0 |
| Average | 398 (100.0%) | $69,145 |
Occupancy by Householder Income Bracket in Laton
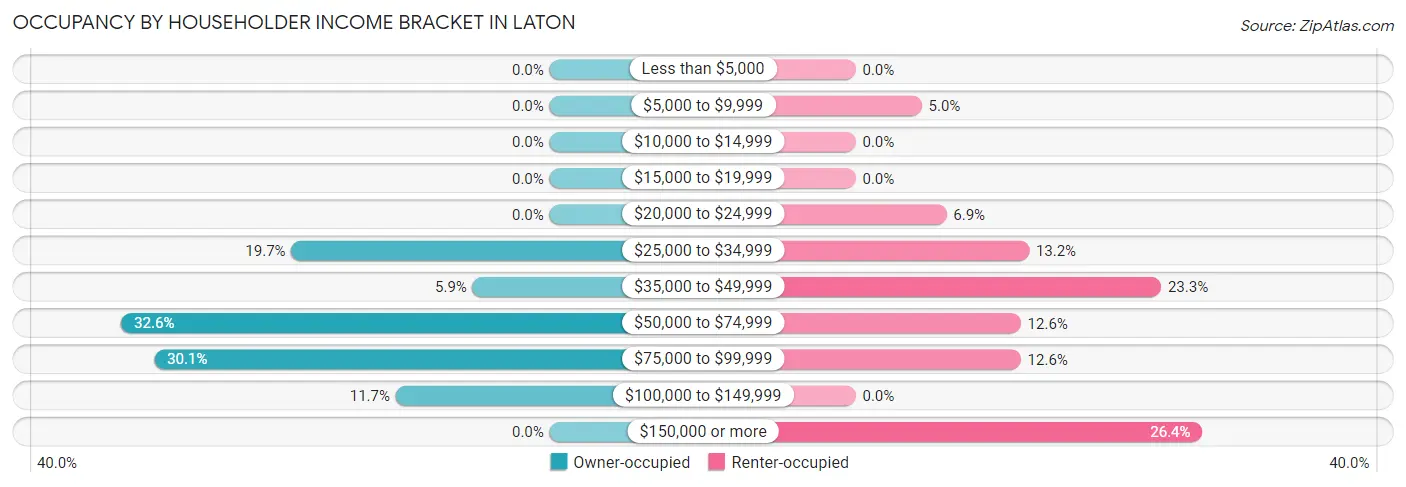
| Income Bracket | Owner-occupied | Renter-occupied |
| Less than $5,000 | 0 (0.0%) | 0 (0.0%) |
| $5,000 to $9,999 | 0 (0.0%) | 8 (5.0%) |
| $10,000 to $14,999 | 0 (0.0%) | 0 (0.0%) |
| $15,000 to $19,999 | 0 (0.0%) | 0 (0.0%) |
| $20,000 to $24,999 | 0 (0.0%) | 11 (6.9%) |
| $25,000 to $34,999 | 47 (19.7%) | 21 (13.2%) |
| $35,000 to $49,999 | 14 (5.9%) | 37 (23.3%) |
| $50,000 to $74,999 | 78 (32.6%) | 20 (12.6%) |
| $75,000 to $99,999 | 72 (30.1%) | 20 (12.6%) |
| $100,000 to $149,999 | 28 (11.7%) | 0 (0.0%) |
| $150,000 or more | 0 (0.0%) | 42 (26.4%) |
| Total | 239 (100.0%) | 159 (100.0%) |
Monthly Housing Cost Tiers in Laton
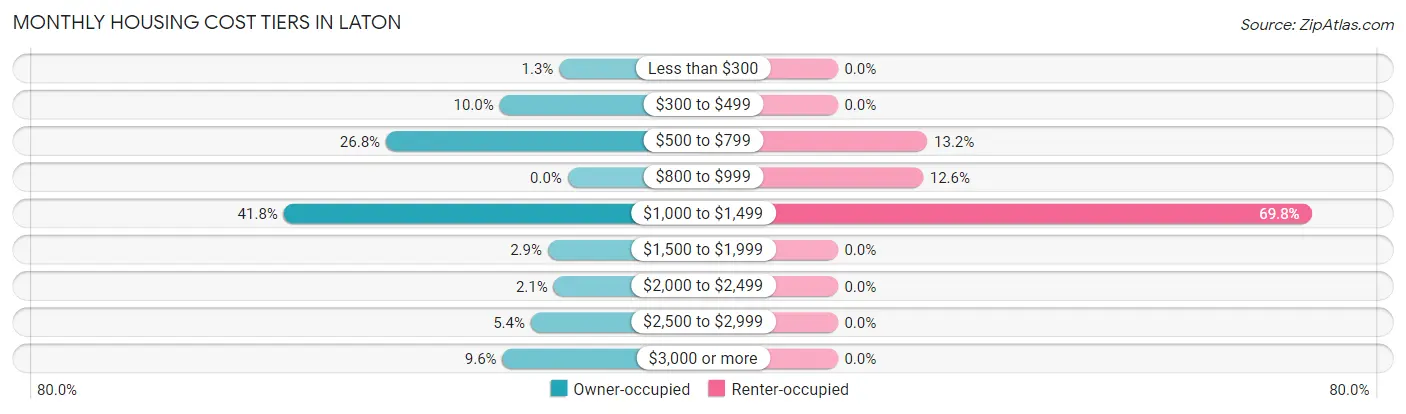
| Monthly Cost | Owner-occupied | Renter-occupied |
| Less than $300 | 3 (1.3%) | 0 (0.0%) |
| $300 to $499 | 24 (10.0%) | 0 (0.0%) |
| $500 to $799 | 64 (26.8%) | 21 (13.2%) |
| $800 to $999 | 0 (0.0%) | 20 (12.6%) |
| $1,000 to $1,499 | 100 (41.8%) | 111 (69.8%) |
| $1,500 to $1,999 | 7 (2.9%) | 0 (0.0%) |
| $2,000 to $2,499 | 5 (2.1%) | 0 (0.0%) |
| $2,500 to $2,999 | 13 (5.4%) | 0 (0.0%) |
| $3,000 or more | 23 (9.6%) | 0 (0.0%) |
| Total | 239 (100.0%) | 159 (100.0%) |
Physical Housing Characteristics in Laton
Housing Structures in Laton
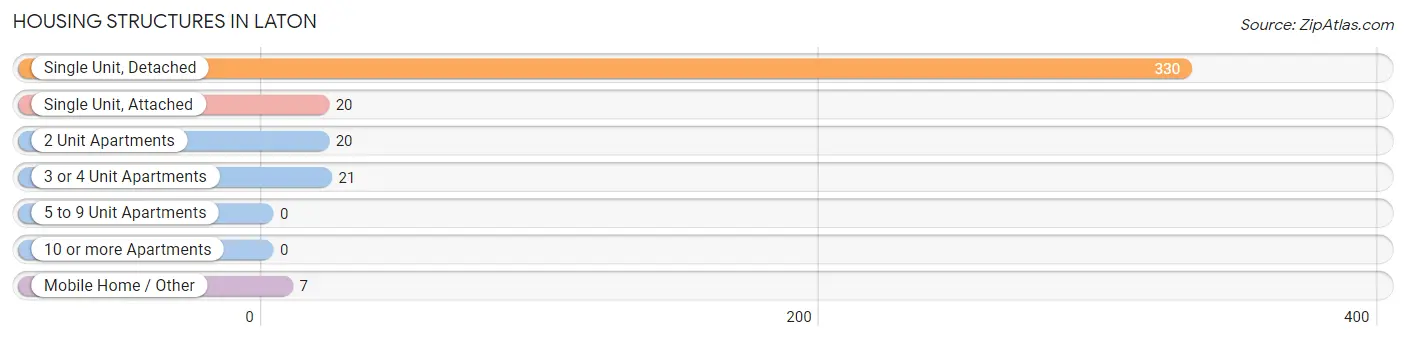
| Structure Type | # Housing Units | % Housing Units |
| Single Unit, Detached | 330 | 82.9% |
| Single Unit, Attached | 20 | 5.0% |
| 2 Unit Apartments | 20 | 5.0% |
| 3 or 4 Unit Apartments | 21 | 5.3% |
| 5 to 9 Unit Apartments | 0 | 0.0% |
| 10 or more Apartments | 0 | 0.0% |
| Mobile Home / Other | 7 | 1.8% |
| Total | 398 | 100.0% |
Housing Structures by Occupancy in Laton
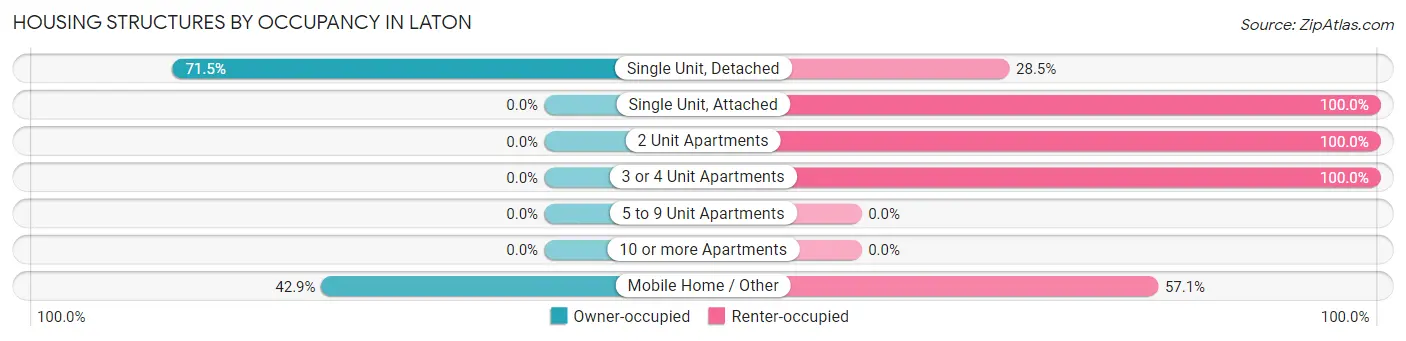
| Structure Type | Owner-occupied | Renter-occupied |
| Single Unit, Detached | 236 (71.5%) | 94 (28.5%) |
| Single Unit, Attached | 0 (0.0%) | 20 (100.0%) |
| 2 Unit Apartments | 0 (0.0%) | 20 (100.0%) |
| 3 or 4 Unit Apartments | 0 (0.0%) | 21 (100.0%) |
| 5 to 9 Unit Apartments | 0 (0.0%) | 0 (0.0%) |
| 10 or more Apartments | 0 (0.0%) | 0 (0.0%) |
| Mobile Home / Other | 3 (42.9%) | 4 (57.1%) |
| Total | 239 (60.1%) | 159 (40.0%) |
Housing Structures by Number of Rooms in Laton
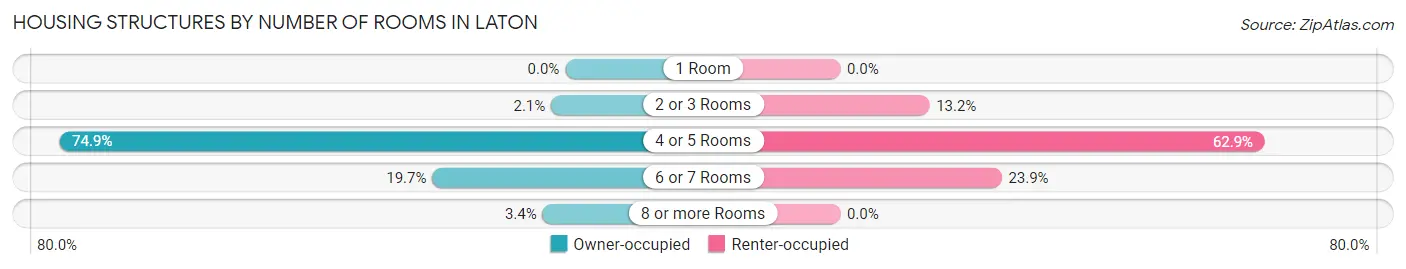
| Number of Rooms | Owner-occupied | Renter-occupied |
| 1 Room | 0 (0.0%) | 0 (0.0%) |
| 2 or 3 Rooms | 5 (2.1%) | 21 (13.2%) |
| 4 or 5 Rooms | 179 (74.9%) | 100 (62.9%) |
| 6 or 7 Rooms | 47 (19.7%) | 38 (23.9%) |
| 8 or more Rooms | 8 (3.4%) | 0 (0.0%) |
| Total | 239 (100.0%) | 159 (100.0%) |
Housing Structure by Heating Type in Laton
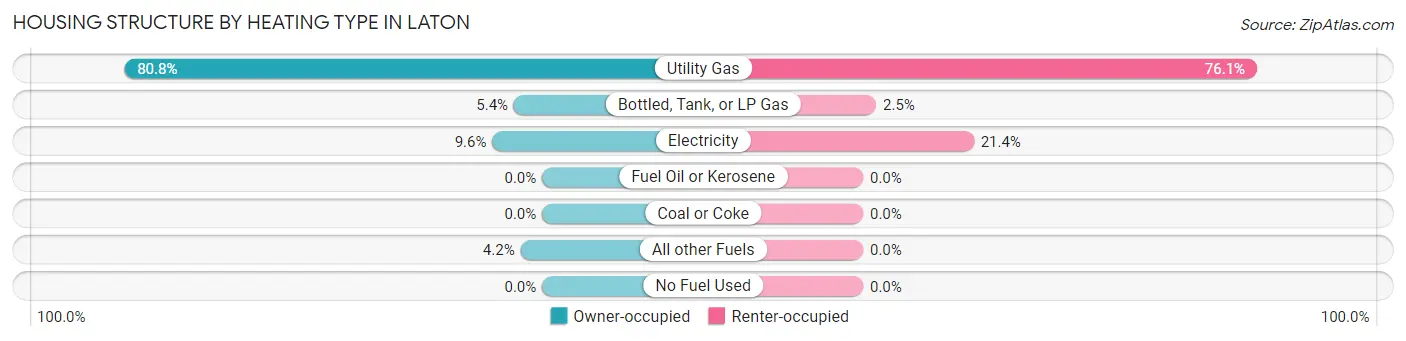
| Heating Type | Owner-occupied | Renter-occupied |
| Utility Gas | 193 (80.7%) | 121 (76.1%) |
| Bottled, Tank, or LP Gas | 13 (5.4%) | 4 (2.5%) |
| Electricity | 23 (9.6%) | 34 (21.4%) |
| Fuel Oil or Kerosene | 0 (0.0%) | 0 (0.0%) |
| Coal or Coke | 0 (0.0%) | 0 (0.0%) |
| All other Fuels | 10 (4.2%) | 0 (0.0%) |
| No Fuel Used | 0 (0.0%) | 0 (0.0%) |
| Total | 239 (100.0%) | 159 (100.0%) |
Household Vehicle Usage in Laton
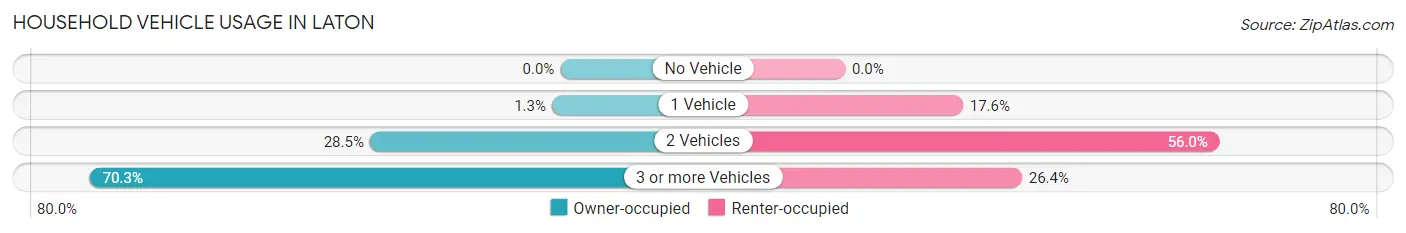
| Vehicles per Household | Owner-occupied | Renter-occupied |
| No Vehicle | 0 (0.0%) | 0 (0.0%) |
| 1 Vehicle | 3 (1.3%) | 28 (17.6%) |
| 2 Vehicles | 68 (28.4%) | 89 (56.0%) |
| 3 or more Vehicles | 168 (70.3%) | 42 (26.4%) |
| Total | 239 (100.0%) | 159 (100.0%) |
Real Estate & Mortgages in Laton
Real Estate and Mortgage Overview in Laton
| Characteristic | Without Mortgage | With Mortgage |
| Housing Units | 44 | 195 |
| Median Property Value | $287,500 | $207,200 |
| Median Household Income | - | - |
| Monthly Housing Costs | - | - |
| Real Estate Taxes | $1,406 | $0 |
Property Value by Mortgage Status in Laton
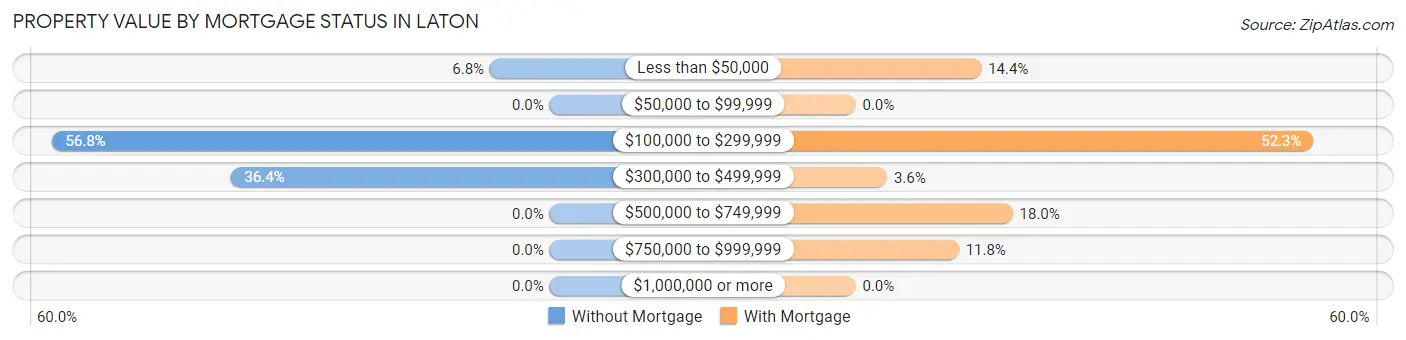
| Property Value | Without Mortgage | With Mortgage |
| Less than $50,000 | 3 (6.8%) | 28 (14.4%) |
| $50,000 to $99,999 | 0 (0.0%) | 0 (0.0%) |
| $100,000 to $299,999 | 25 (56.8%) | 102 (52.3%) |
| $300,000 to $499,999 | 16 (36.4%) | 7 (3.6%) |
| $500,000 to $749,999 | 0 (0.0%) | 35 (17.9%) |
| $750,000 to $999,999 | 0 (0.0%) | 23 (11.8%) |
| $1,000,000 or more | 0 (0.0%) | 0 (0.0%) |
| Total | 44 (100.0%) | 195 (100.0%) |
Household Income by Mortgage Status in Laton
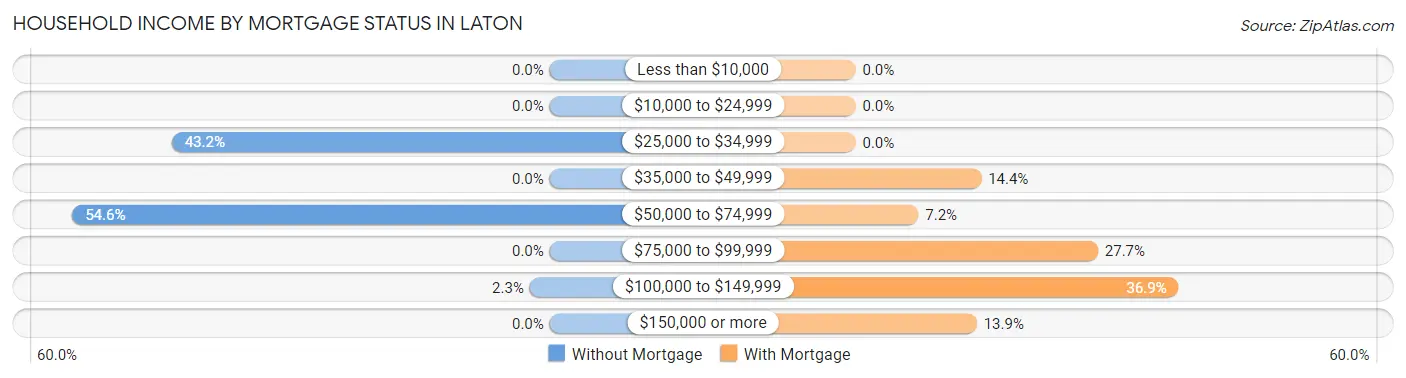
| Household Income | Without Mortgage | With Mortgage |
| Less than $10,000 | 0 (0.0%) | 0 (0.0%) |
| $10,000 to $24,999 | 0 (0.0%) | 0 (0.0%) |
| $25,000 to $34,999 | 19 (43.2%) | 0 (0.0%) |
| $35,000 to $49,999 | 0 (0.0%) | 28 (14.4%) |
| $50,000 to $74,999 | 24 (54.5%) | 14 (7.2%) |
| $75,000 to $99,999 | 0 (0.0%) | 54 (27.7%) |
| $100,000 to $149,999 | 1 (2.3%) | 72 (36.9%) |
| $150,000 or more | 0 (0.0%) | 27 (13.9%) |
| Total | 44 (100.0%) | 195 (100.0%) |
Property Value to Household Income Ratio in Laton
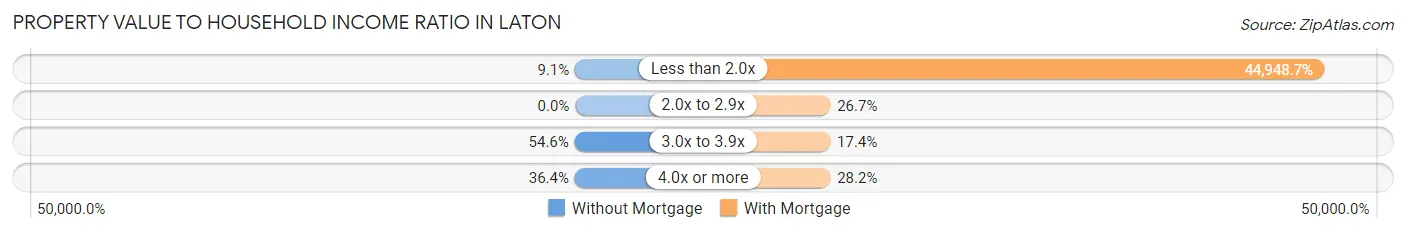
| Value-to-Income Ratio | Without Mortgage | With Mortgage |
| Less than 2.0x | 4 (9.1%) | 87,650 (44,948.7%) |
| 2.0x to 2.9x | 0 (0.0%) | 52 (26.7%) |
| 3.0x to 3.9x | 24 (54.5%) | 34 (17.4%) |
| 4.0x or more | 16 (36.4%) | 55 (28.2%) |
| Total | 44 (100.0%) | 195 (100.0%) |
Real Estate Taxes by Mortgage Status in Laton
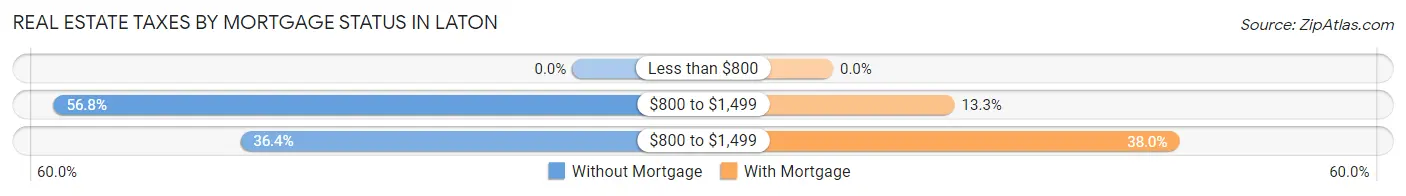
| Property Taxes | Without Mortgage | With Mortgage |
| Less than $800 | 0 (0.0%) | 0 (0.0%) |
| $800 to $1,499 | 25 (56.8%) | 26 (13.3%) |
| $800 to $1,499 | 16 (36.4%) | 74 (38.0%) |
| Total | 44 (100.0%) | 195 (100.0%) |
Health & Disability in Laton
Health Insurance Coverage by Age in Laton
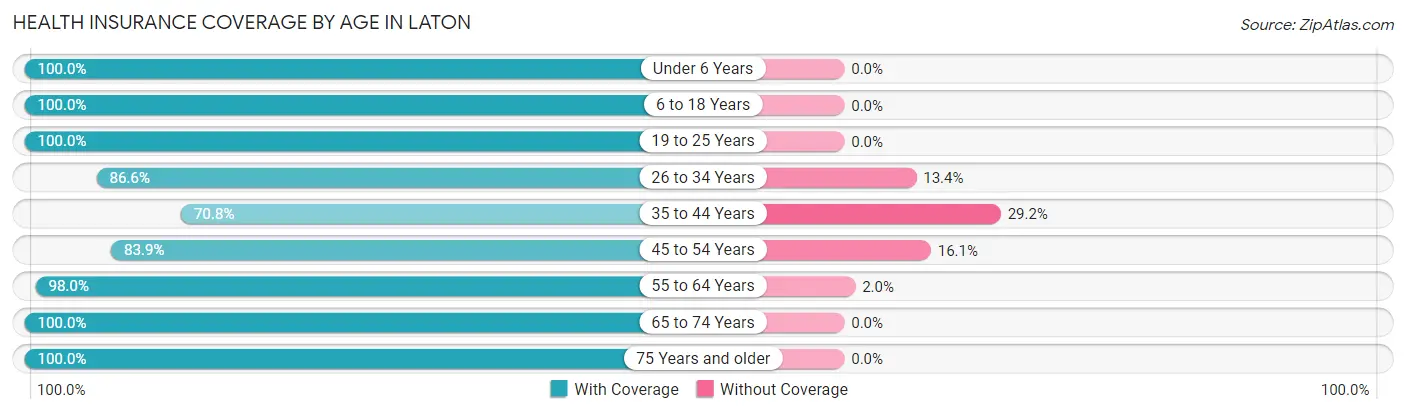
| Age Bracket | With Coverage | Without Coverage |
| Under 6 Years | 87 (100.0%) | 0 (0.0%) |
| 6 to 18 Years | 360 (100.0%) | 0 (0.0%) |
| 19 to 25 Years | 124 (100.0%) | 0 (0.0%) |
| 26 to 34 Years | 129 (86.6%) | 20 (13.4%) |
| 35 to 44 Years | 68 (70.8%) | 28 (29.2%) |
| 45 to 54 Years | 130 (83.9%) | 25 (16.1%) |
| 55 to 64 Years | 240 (98.0%) | 5 (2.0%) |
| 65 to 74 Years | 21 (100.0%) | 0 (0.0%) |
| 75 Years and older | 64 (100.0%) | 0 (0.0%) |
| Total | 1,223 (94.0%) | 78 (6.0%) |
Health Insurance Coverage by Citizenship Status in Laton
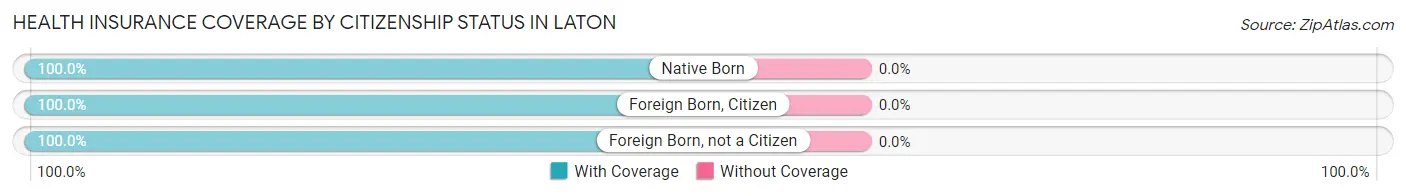
| Citizenship Status | With Coverage | Without Coverage |
| Native Born | 87 (100.0%) | 0 (0.0%) |
| Foreign Born, Citizen | 360 (100.0%) | 0 (0.0%) |
| Foreign Born, not a Citizen | 124 (100.0%) | 0 (0.0%) |
Health Insurance Coverage by Household Income in Laton
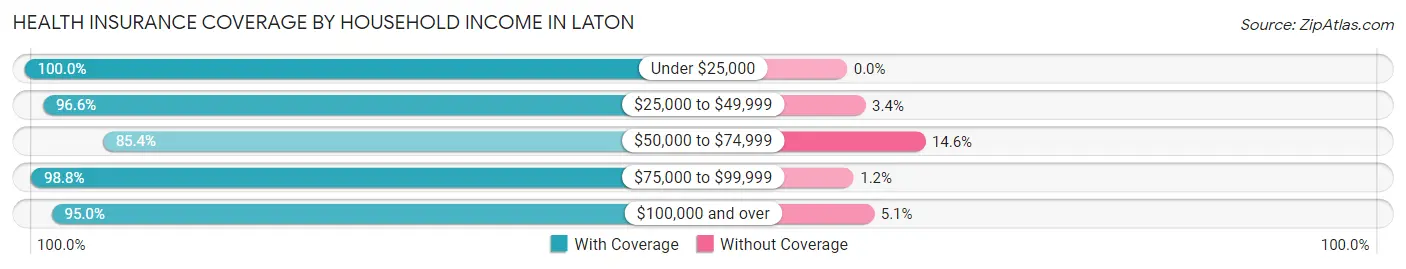
| Household Income | With Coverage | Without Coverage |
| Under $25,000 | 41 (100.0%) | 0 (0.0%) |
| $25,000 to $49,999 | 281 (96.6%) | 10 (3.4%) |
| $50,000 to $74,999 | 309 (85.4%) | 53 (14.6%) |
| $75,000 to $99,999 | 404 (98.8%) | 5 (1.2%) |
| $100,000 and over | 188 (95.0%) | 10 (5.1%) |
Public vs Private Health Insurance Coverage by Age in Laton
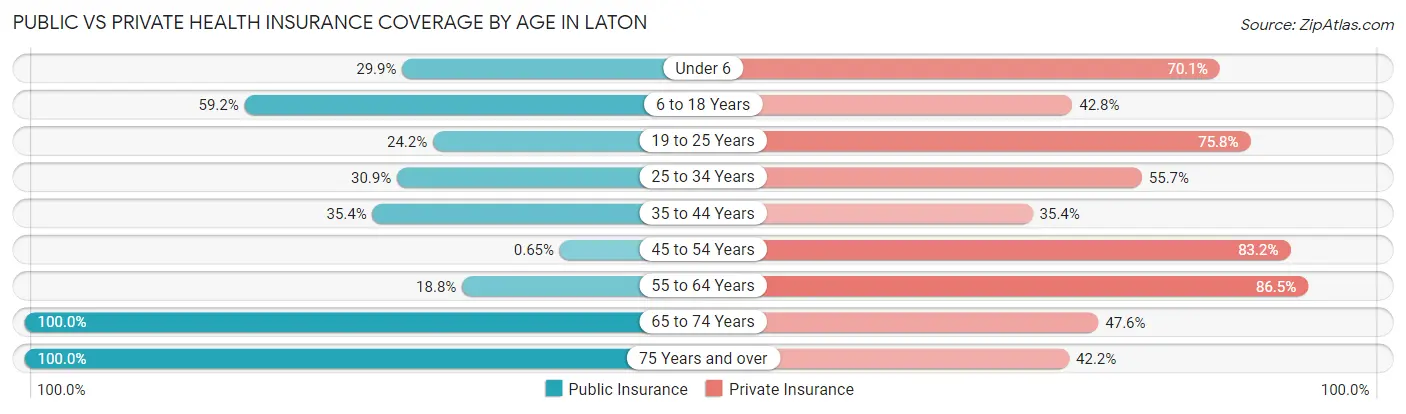
| Age Bracket | Public Insurance | Private Insurance |
| Under 6 | 26 (29.9%) | 61 (70.1%) |
| 6 to 18 Years | 213 (59.2%) | 154 (42.8%) |
| 19 to 25 Years | 30 (24.2%) | 94 (75.8%) |
| 25 to 34 Years | 46 (30.9%) | 83 (55.7%) |
| 35 to 44 Years | 34 (35.4%) | 34 (35.4%) |
| 45 to 54 Years | 1 (0.6%) | 129 (83.2%) |
| 55 to 64 Years | 46 (18.8%) | 212 (86.5%) |
| 65 to 74 Years | 21 (100.0%) | 10 (47.6%) |
| 75 Years and over | 64 (100.0%) | 27 (42.2%) |
| Total | 481 (37.0%) | 804 (61.8%) |
Disability Status by Sex by Age in Laton
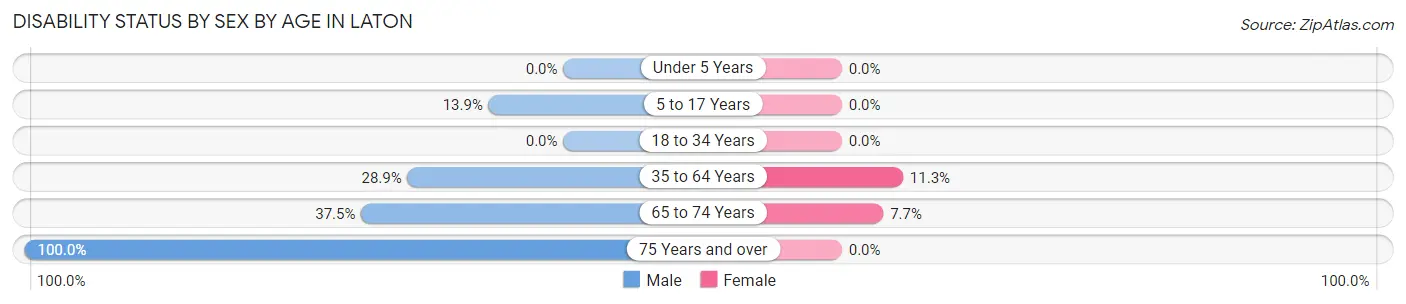
| Age Bracket | Male | Female |
| Under 5 Years | 0 (0.0%) | 0 (0.0%) |
| 5 to 17 Years | 36 (13.9%) | 0 (0.0%) |
| 18 to 34 Years | 0 (0.0%) | 0 (0.0%) |
| 35 to 64 Years | 72 (28.9%) | 28 (11.3%) |
| 65 to 74 Years | 3 (37.5%) | 1 (7.7%) |
| 75 Years and over | 39 (100.0%) | 0 (0.0%) |
Disability Class by Sex by Age in Laton
Disability Class: Hearing Difficulty
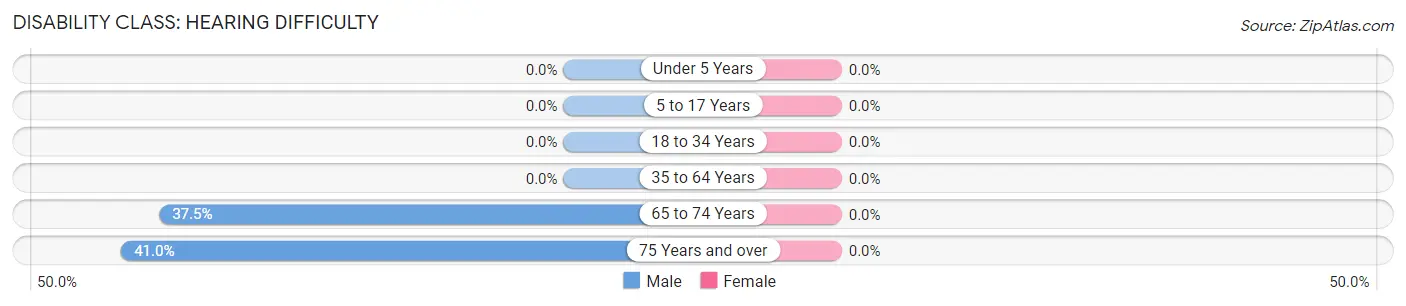
| Age Bracket | Male | Female |
| Under 5 Years | 0 (0.0%) | 0 (0.0%) |
| 5 to 17 Years | 0 (0.0%) | 0 (0.0%) |
| 18 to 34 Years | 0 (0.0%) | 0 (0.0%) |
| 35 to 64 Years | 0 (0.0%) | 0 (0.0%) |
| 65 to 74 Years | 3 (37.5%) | 0 (0.0%) |
| 75 Years and over | 16 (41.0%) | 0 (0.0%) |
Disability Class: Vision Difficulty
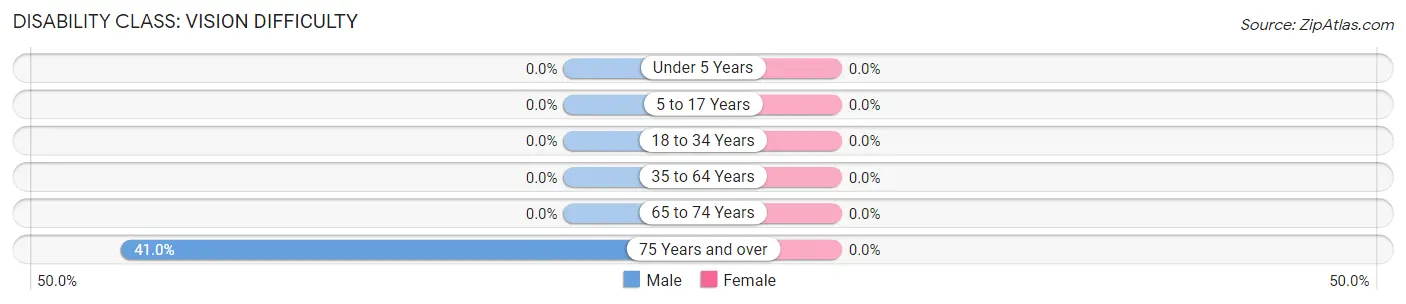
| Age Bracket | Male | Female |
| Under 5 Years | 0 (0.0%) | 0 (0.0%) |
| 5 to 17 Years | 0 (0.0%) | 0 (0.0%) |
| 18 to 34 Years | 0 (0.0%) | 0 (0.0%) |
| 35 to 64 Years | 0 (0.0%) | 0 (0.0%) |
| 65 to 74 Years | 0 (0.0%) | 0 (0.0%) |
| 75 Years and over | 16 (41.0%) | 0 (0.0%) |
Disability Class: Cognitive Difficulty
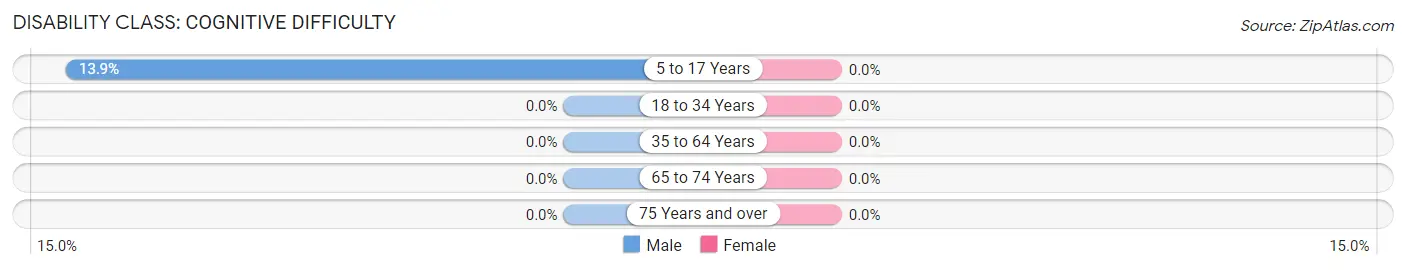
| Age Bracket | Male | Female |
| 5 to 17 Years | 36 (13.9%) | 0 (0.0%) |
| 18 to 34 Years | 0 (0.0%) | 0 (0.0%) |
| 35 to 64 Years | 0 (0.0%) | 0 (0.0%) |
| 65 to 74 Years | 0 (0.0%) | 0 (0.0%) |
| 75 Years and over | 0 (0.0%) | 0 (0.0%) |
Disability Class: Ambulatory Difficulty
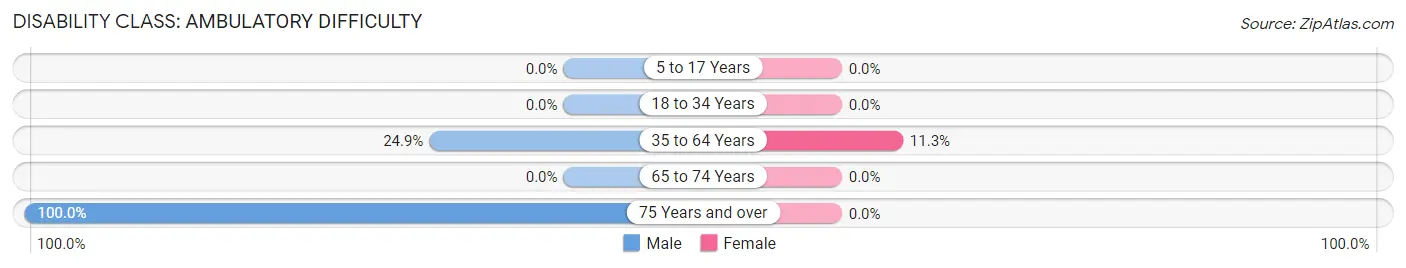
| Age Bracket | Male | Female |
| 5 to 17 Years | 0 (0.0%) | 0 (0.0%) |
| 18 to 34 Years | 0 (0.0%) | 0 (0.0%) |
| 35 to 64 Years | 62 (24.9%) | 28 (11.3%) |
| 65 to 74 Years | 0 (0.0%) | 0 (0.0%) |
| 75 Years and over | 39 (100.0%) | 0 (0.0%) |
Disability Class: Self-Care Difficulty
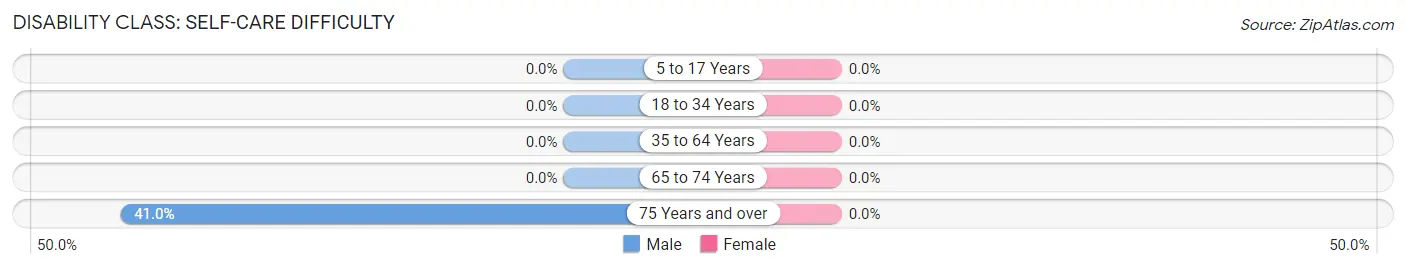
| Age Bracket | Male | Female |
| 5 to 17 Years | 0 (0.0%) | 0 (0.0%) |
| 18 to 34 Years | 0 (0.0%) | 0 (0.0%) |
| 35 to 64 Years | 0 (0.0%) | 0 (0.0%) |
| 65 to 74 Years | 0 (0.0%) | 0 (0.0%) |
| 75 Years and over | 16 (41.0%) | 0 (0.0%) |
Technology Access in Laton
Computing Device Access in Laton
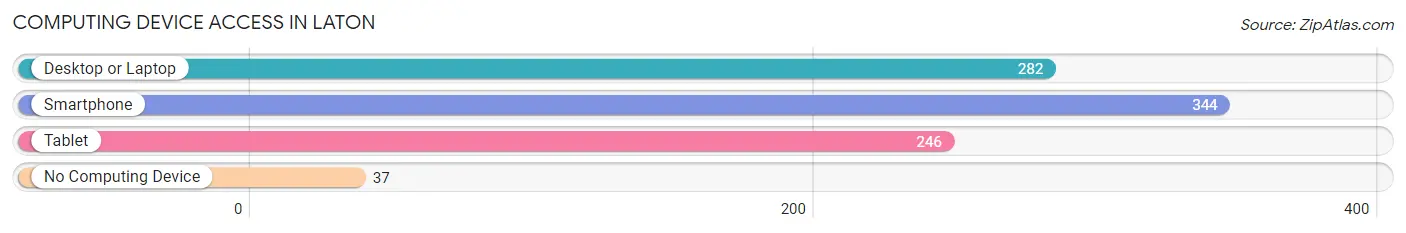
| Device Type | # Households | % Households |
| Desktop or Laptop | 282 | 70.9% |
| Smartphone | 344 | 86.4% |
| Tablet | 246 | 61.8% |
| No Computing Device | 37 | 9.3% |
| Total | 398 | 100.0% |
Internet Access in Laton
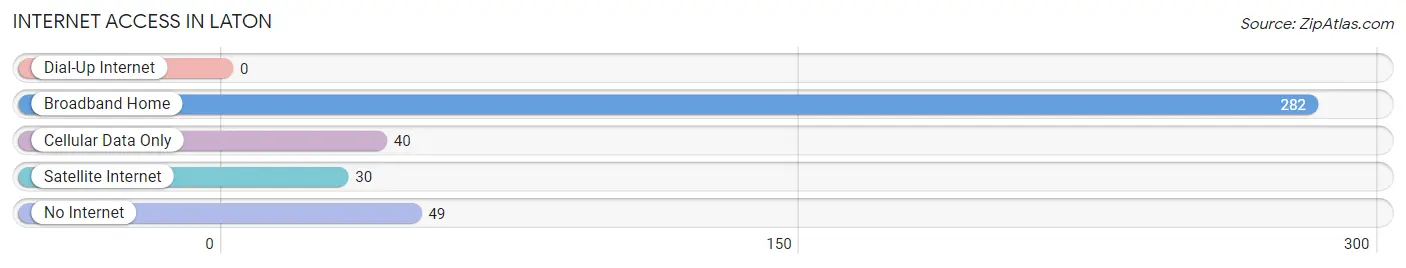
| Internet Type | # Households | % Households |
| Dial-Up Internet | 0 | 0.0% |
| Broadband Home | 282 | 70.9% |
| Cellular Data Only | 40 | 10.1% |
| Satellite Internet | 30 | 7.5% |
| No Internet | 49 | 12.3% |
| Total | 398 | 100.0% |
Laton Summary
Laton is a small unincorporated community located in Fresno County, California. It is situated in the San Joaquin Valley, approximately 10 miles south of the city of Fresno. The population of Laton was estimated to be 1,845 in the 2010 census.
History
Laton was founded in 1891 by the Southern Pacific Railroad. The town was named after the Spanish word for “lawn”, which was the type of grass that grew in the area. The town was originally a farming community, and the main crops grown were cotton, wheat, and barley.
In the early 1900s, Laton began to experience a population boom due to the arrival of the railroad. This allowed for the transportation of goods and people to and from the town. The population of Laton peaked in the 1920s, when it had a population of over 2,000 people.
In the 1950s, the population of Laton began to decline due to the introduction of mechanized farming. This caused many of the local farmers to move away in search of better opportunities. By the 1970s, the population of Laton had dropped to just over 1,000 people.
Geography
Laton is located in the San Joaquin Valley, approximately 10 miles south of the city of Fresno. The town is situated on the west side of the Kings River, which flows through the area. The terrain of the area is mostly flat, with some rolling hills. The climate of the area is hot and dry in the summer, and mild and wet in the winter.
Economy
The economy of Laton is largely based on agriculture. The main crops grown in the area are cotton, wheat, and barley. In addition, there are several small businesses in the town, including a grocery store, a gas station, and a few restaurants.
Demographics
As of the 2010 census, the population of Laton was estimated to be 1,845. The racial makeup of the town was 79.3% White, 0.7% African American, 0.3% Native American, 0.2% Asian, 0.1% Pacific Islander, 16.2% from other races, and 3.4% from two or more races. The median household income in Laton was $37,917, and the median age was 33.7 years.
Conclusion
Laton is a small unincorporated community located in Fresno County, California. It was founded in 1891 by the Southern Pacific Railroad, and was originally a farming community. The population of Laton peaked in the 1920s, but has since declined due to the introduction of mechanized farming. The economy of Laton is largely based on agriculture, and the main crops grown in the area are cotton, wheat, and barley. As of the 2010 census, the population of Laton was estimated to be 1,845.
Common Questions
What is Per Capita Income in Laton?
Per Capita income in Laton is $24,443.
What is the Median Family Income in Laton?
Median Family Income in Laton is $72,656.
What is the Median Household income in Laton?
Median Household Income in Laton is $69,145.
What is Income or Wage Gap in Laton?
Income or Wage Gap in Laton is 56.1%.
Women in Laton earn 43.9 cents for every dollar earned by a man.
What is Inequality or Gini Index in Laton?
Inequality or Gini Index in Laton is 0.35.
What is the Total Population of Laton?
Total Population of Laton is 1,301.
What is the Total Male Population of Laton?
Total Male Population of Laton is 707.
What is the Total Female Population of Laton?
Total Female Population of Laton is 594.
What is the Ratio of Males per 100 Females in Laton?
There are 119.02 Males per 100 Females in Laton.
What is the Ratio of Females per 100 Males in Laton?
There are 84.02 Females per 100 Males in Laton.
What is the Median Population Age in Laton?
Median Population Age in Laton is 31.3 Years.
What is the Average Family Size in Laton
Average Family Size in Laton is 3.9 People.
What is the Average Household Size in Laton
Average Household Size in Laton is 3.3 People.
How Large is the Labor Force in Laton?
There are 595 People in the Labor Forcein in Laton.
What is the Percentage of People in the Labor Force in Laton?
64.9% of People are in the Labor Force in Laton.
What is the Unemployment Rate in Laton?
Unemployment Rate in Laton is 8.1%.