Cities with the Highest Percentage of Households With Three or more Vehicles in Louisiana
RELATED REPORTS & OPTIONS
Households with 3 or more Cars
Louisiana
Compare Cities
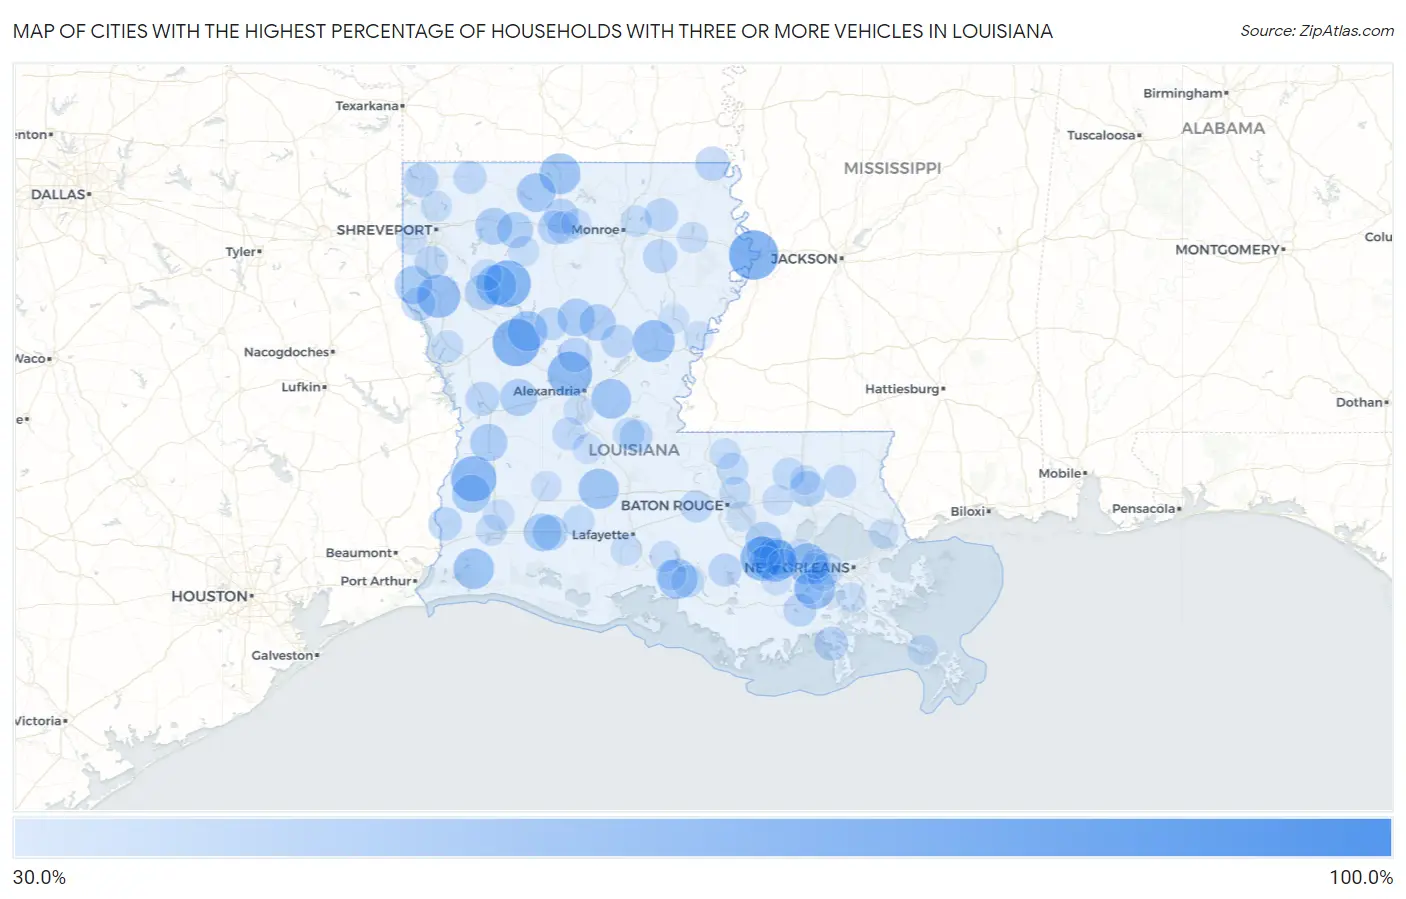
Map of Cities with the Highest Percentage of Households With Three or more Vehicles in Louisiana
0.0%
100.0%
Cities with the Highest Percentage of Households With Three or more Vehicles in Louisiana
| City | Housholds With 3+ Cars | vs State | vs National | |
| 1. | Rio | 100.0% | 23.1%(+76.9)#1 | 29.0%(+71.0)#53 |
| 2. | Trout | 100.0% | 23.1%(+76.9)#2 | 29.0%(+71.0)#101 |
| 3. | Delta | 72.7% | 23.1%(+49.6)#3 | 29.0%(+43.7)#810 |
| 4. | Natchez | 68.1% | 23.1%(+45.0)#4 | 29.0%(+39.1)#985 |
| 5. | Ashland | 66.7% | 23.1%(+43.6)#5 | 29.0%(+37.7)#1,057 |
| 6. | Singer | 63.8% | 23.1%(+40.7)#6 | 29.0%(+34.8)#1,265 |
| 7. | Rock Hill | 61.8% | 23.1%(+38.7)#7 | 29.0%(+32.8)#1,433 |
| 8. | Welcome | 61.7% | 23.1%(+38.6)#8 | 29.0%(+32.7)#1,440 |
| 9. | Hester | 59.7% | 23.1%(+36.6)#9 | 29.0%(+30.7)#1,670 |
| 10. | South Mansfield | 58.6% | 23.1%(+35.5)#10 | 29.0%(+29.6)#1,801 |
| 11. | Wallace Ridge | 57.1% | 23.1%(+34.0)#11 | 29.0%(+28.1)#1,960 |
| 12. | Lillie | 54.2% | 23.1%(+31.1)#12 | 29.0%(+25.2)#2,434 |
| 13. | Killona | 53.7% | 23.1%(+30.6)#13 | 29.0%(+24.7)#2,521 |
| 14. | Hackberry | 53.4% | 23.1%(+30.3)#14 | 29.0%(+24.4)#2,580 |
| 15. | Bayou Gauche | 53.2% | 23.1%(+30.1)#15 | 29.0%(+24.2)#2,620 |
| 16. | Chataignier | 52.9% | 23.1%(+29.8)#16 | 29.0%(+23.9)#2,690 |
| 17. | Martin | 52.6% | 23.1%(+29.5)#17 | 29.0%(+23.6)#2,748 |
| 18. | Sorrel | 52.3% | 23.1%(+29.2)#18 | 29.0%(+23.3)#2,824 |
| 19. | St Maurice | 52.3% | 23.1%(+29.2)#19 | 29.0%(+23.3)#2,829 |
| 20. | Center Point | 51.9% | 23.1%(+28.8)#20 | 29.0%(+22.9)#2,912 |
| 21. | Lisbon | 49.3% | 23.1%(+26.2)#21 | 29.0%(+20.3)#3,544 |
| 22. | Oretta | 48.3% | 23.1%(+25.2)#22 | 29.0%(+19.3)#3,809 |
| 23. | Longstreet | 47.7% | 23.1%(+24.6)#23 | 29.0%(+18.7)#3,996 |
| 24. | Welsh | 47.1% | 23.1%(+24.0)#24 | 29.0%(+18.1)#4,128 |
| 25. | Jordan Hill | 46.6% | 23.1%(+23.5)#25 | 29.0%(+17.6)#4,311 |
| 26. | Rosepine | 46.5% | 23.1%(+23.4)#26 | 29.0%(+17.5)#4,324 |
| 27. | Simpson | 46.2% | 23.1%(+23.1)#27 | 29.0%(+17.2)#4,433 |
| 28. | Dubberly | 45.6% | 23.1%(+22.5)#28 | 29.0%(+16.6)#4,650 |
| 29. | Tullos | 44.7% | 23.1%(+21.6)#29 | 29.0%(+15.7)#4,967 |
| 30. | Sorrento | 44.5% | 23.1%(+21.4)#30 | 29.0%(+15.5)#5,013 |
| 31. | Mount Lebanon | 43.6% | 23.1%(+20.5)#31 | 29.0%(+14.6)#5,421 |
| 32. | Midland | 43.3% | 23.1%(+20.2)#32 | 29.0%(+14.3)#5,540 |
| 33. | Edgefield | 43.0% | 23.1%(+19.9)#33 | 29.0%(+14.0)#5,650 |
| 34. | Grand Point | 42.6% | 23.1%(+19.5)#34 | 29.0%(+13.6)#5,795 |
| 35. | Roanoke | 42.6% | 23.1%(+19.5)#35 | 29.0%(+13.6)#5,816 |
| 36. | Tickfaw | 42.2% | 23.1%(+19.1)#36 | 29.0%(+13.2)#5,986 |
| 37. | Vienna | 41.5% | 23.1%(+18.4)#37 | 29.0%(+12.5)#6,347 |
| 38. | Kilbourne | 40.6% | 23.1%(+17.5)#38 | 29.0%(+11.6)#6,799 |
| 39. | Hosston | 40.5% | 23.1%(+17.4)#39 | 29.0%(+11.5)#6,846 |
| 40. | Dry Prong | 40.4% | 23.1%(+17.3)#40 | 29.0%(+11.4)#6,891 |
| 41. | Grambling | 39.8% | 23.1%(+16.7)#41 | 29.0%(+10.8)#7,213 |
| 42. | Mangham | 39.5% | 23.1%(+16.4)#42 | 29.0%(+10.5)#7,416 |
| 43. | Stanley | 39.3% | 23.1%(+16.2)#43 | 29.0%(+10.3)#7,543 |
| 44. | Golden Meadow | 39.2% | 23.1%(+16.1)#44 | 29.0%(+10.2)#7,570 |
| 45. | Anacoco | 39.2% | 23.1%(+16.1)#45 | 29.0%(+10.2)#7,575 |
| 46. | Starks | 38.6% | 23.1%(+15.5)#46 | 29.0%(+9.60)#7,955 |
| 47. | Oak Ridge | 38.5% | 23.1%(+15.4)#47 | 29.0%(+9.50)#8,025 |
| 48. | Pierre Part | 37.8% | 23.1%(+14.7)#48 | 29.0%(+8.80)#8,404 |
| 49. | Stonewall | 37.8% | 23.1%(+14.7)#49 | 29.0%(+8.80)#8,405 |
| 50. | Lockport Heights | 37.7% | 23.1%(+14.6)#50 | 29.0%(+8.70)#8,470 |
| 51. | Midway | 37.6% | 23.1%(+14.5)#51 | 29.0%(+8.60)#8,531 |
| 52. | Plaucheville | 37.5% | 23.1%(+14.4)#52 | 29.0%(+8.50)#8,599 |
| 53. | Ruston | 37.3% | 23.1%(+14.2)#53 | 29.0%(+8.30)#8,689 |
| 54. | Sarepta | 37.3% | 23.1%(+14.2)#54 | 29.0%(+8.30)#8,718 |
| 55. | Mcnary | 37.3% | 23.1%(+14.2)#55 | 29.0%(+8.30)#8,741 |
| 56. | Folsom | 36.7% | 23.1%(+13.6)#56 | 29.0%(+7.70)#9,138 |
| 57. | Atlanta | 36.7% | 23.1%(+13.6)#57 | 29.0%(+7.70)#9,162 |
| 58. | Charenton | 36.6% | 23.1%(+13.5)#58 | 29.0%(+7.60)#9,206 |
| 59. | Union | 36.5% | 23.1%(+13.4)#59 | 29.0%(+7.50)#9,277 |
| 60. | Rosedale | 36.3% | 23.1%(+13.2)#60 | 29.0%(+7.30)#9,396 |
| 61. | Montpelier | 36.1% | 23.1%(+13.0)#61 | 29.0%(+7.10)#9,522 |
| 62. | St James | 36.0% | 23.1%(+12.9)#62 | 29.0%(+7.00)#9,574 |
| 63. | Slaughter | 35.3% | 23.1%(+12.2)#63 | 29.0%(+6.30)#10,027 |
| 64. | Cottonport | 35.2% | 23.1%(+12.1)#64 | 29.0%(+6.20)#10,087 |
| 65. | Iota | 35.1% | 23.1%(+12.0)#65 | 29.0%(+6.10)#10,154 |
| 66. | St Rose | 34.9% | 23.1%(+11.8)#66 | 29.0%(+5.90)#10,295 |
| 67. | Swartz | 34.7% | 23.1%(+11.6)#67 | 29.0%(+5.70)#10,438 |
| 68. | Brownfields | 34.6% | 23.1%(+11.5)#68 | 29.0%(+5.60)#10,508 |
| 69. | Zwolle | 34.4% | 23.1%(+11.3)#69 | 29.0%(+5.40)#10,698 |
| 70. | Hall Summit | 34.1% | 23.1%(+11.0)#70 | 29.0%(+5.10)#10,983 |
| 71. | Hahnville | 33.9% | 23.1%(+10.8)#71 | 29.0%(+4.90)#11,097 |
| 72. | Gillis | 33.9% | 23.1%(+10.8)#72 | 29.0%(+4.90)#11,133 |
| 73. | Westlake | 33.6% | 23.1%(+10.5)#73 | 29.0%(+4.60)#11,378 |
| 74. | Milton | 33.5% | 23.1%(+10.4)#74 | 29.0%(+4.50)#11,462 |
| 75. | Loreauville | 33.5% | 23.1%(+10.4)#75 | 29.0%(+4.50)#11,480 |
| 76. | Bienville | 33.3% | 23.1%(+10.2)#76 | 29.0%(+4.30)#11,661 |
| 77. | Benton | 33.2% | 23.1%(+10.1)#77 | 29.0%(+4.20)#11,779 |
| 78. | Good Pine | 33.2% | 23.1%(+10.1)#78 | 29.0%(+4.20)#11,798 |
| 79. | Delhi | 33.1% | 23.1%(+10.00)#79 | 29.0%(+4.10)#11,826 |
| 80. | Jackson | 32.9% | 23.1%(+9.80)#80 | 29.0%(+3.90)#11,944 |
| 81. | Livingston | 32.8% | 23.1%(+9.70)#81 | 29.0%(+3.80)#12,026 |
| 82. | Woodworth | 32.5% | 23.1%(+9.40)#82 | 29.0%(+3.50)#12,260 |
| 83. | Chackbay | 32.3% | 23.1%(+9.20)#83 | 29.0%(+3.30)#12,426 |
| 84. | Jeanerette | 32.2% | 23.1%(+9.10)#84 | 29.0%(+3.20)#12,522 |
| 85. | Oberlin | 32.2% | 23.1%(+9.10)#85 | 29.0%(+3.20)#12,541 |
| 86. | Turkey Creek | 32.1% | 23.1%(+9.00)#86 | 29.0%(+3.10)#12,646 |
| 87. | Choudrant | 32.0% | 23.1%(+8.90)#87 | 29.0%(+3.00)#12,716 |
| 88. | Greenwood | 31.8% | 23.1%(+8.70)#88 | 29.0%(+2.80)#12,865 |
| 89. | Des Allemands | 31.7% | 23.1%(+8.60)#89 | 29.0%(+2.70)#12,963 |
| 90. | Eden Isle | 31.6% | 23.1%(+8.50)#90 | 29.0%(+2.60)#13,027 |
| 91. | North Vacherie | 31.6% | 23.1%(+8.50)#91 | 29.0%(+2.60)#13,052 |
| 92. | Triumph | 31.6% | 23.1%(+8.50)#92 | 29.0%(+2.60)#13,084 |
| 93. | Village St George | 31.5% | 23.1%(+8.40)#93 | 29.0%(+2.50)#13,118 |
| 94. | Sicily Island | 31.5% | 23.1%(+8.40)#94 | 29.0%(+2.50)#13,172 |
| 95. | Spokane | 31.4% | 23.1%(+8.30)#95 | 29.0%(+2.40)#13,245 |
| 96. | Luling | 31.2% | 23.1%(+8.10)#96 | 29.0%(+2.20)#13,406 |
| 97. | Norco | 31.2% | 23.1%(+8.10)#97 | 29.0%(+2.20)#13,423 |
| 98. | Independence | 31.2% | 23.1%(+8.10)#98 | 29.0%(+2.20)#13,429 |
| 99. | Reserve | 31.1% | 23.1%(+8.00)#99 | 29.0%(+2.10)#13,476 |
| 100. | Jean Lafitte | 31.1% | 23.1%(+8.00)#100 | 29.0%(+2.10)#13,495 |
Common Questions
What are the Top 10 Cities with the Highest Percentage of Households With Three or more Vehicles in Louisiana?
Top 10 Cities with the Highest Percentage of Households With Three or more Vehicles in Louisiana are:
#1
72.7%
#2
68.1%
#3
66.7%
#4
63.8%
#5
61.8%
#6
61.7%
#7
59.7%
#8
58.6%
#9
57.1%
#10
54.2%
What city has the Highest Percentage of Households With Three or more Vehicles in Louisiana?
Delta has the Highest Percentage of Households With Three or more Vehicles in Louisiana with 72.7%.
What is the Percentage of Households With Three or more Vehicles in the State of Louisiana?
Percentage of Households With Three or more Vehicles in Louisiana is 23.1%.
What is the Percentage of Households With Three or more Vehicles in the United States?
Percentage of Households With Three or more Vehicles in the United States is 29.0%.