Cities with the Highest Percentage of Households With Three or more Vehicles in West Virginia
RELATED REPORTS & OPTIONS
Households with 3 or more Cars
West Virginia
Compare Cities
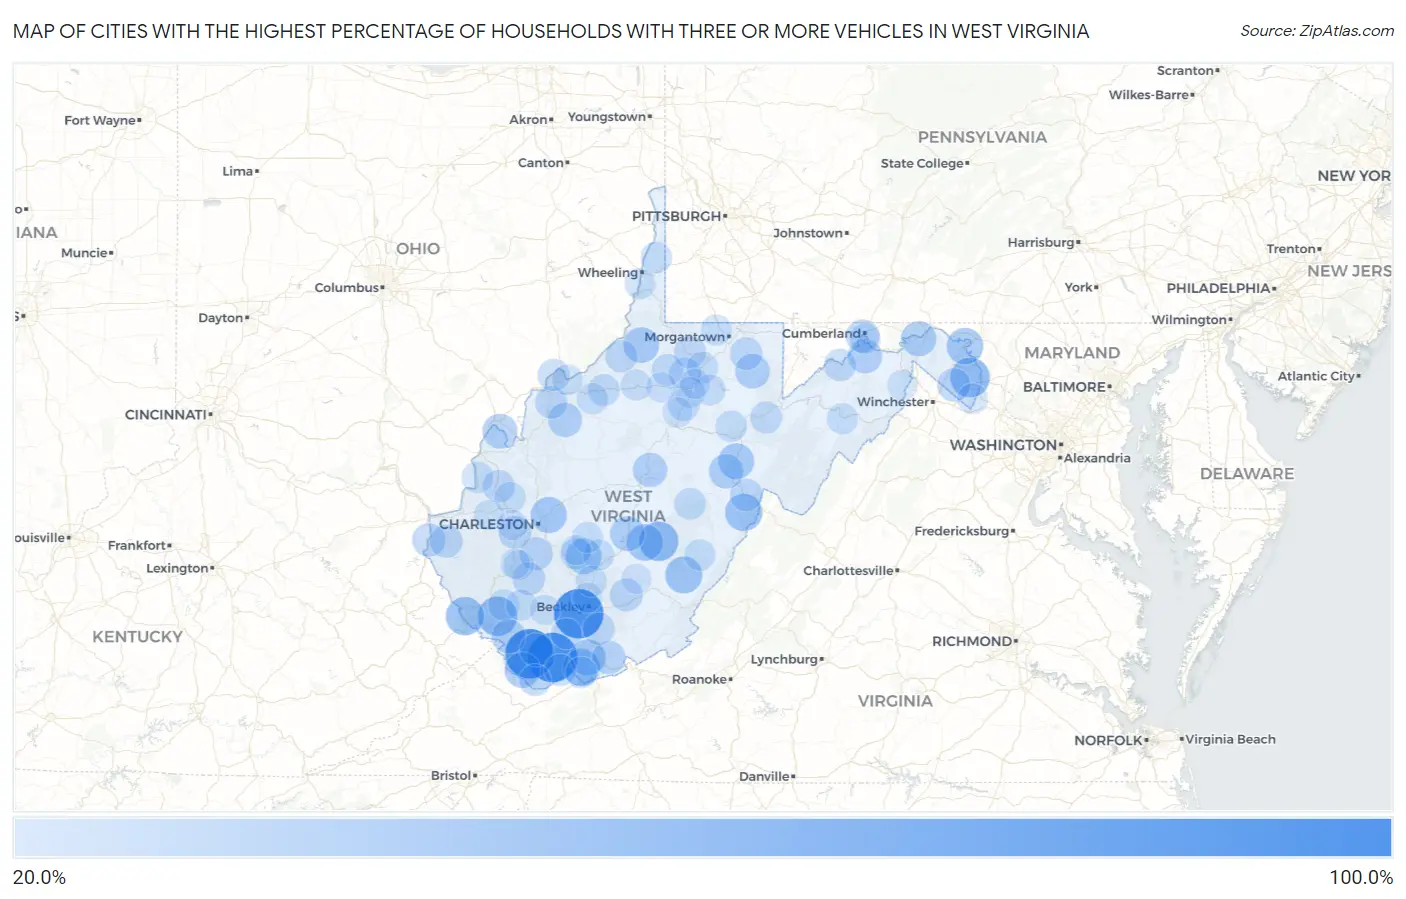
Map of Cities with the Highest Percentage of Households With Three or more Vehicles in West Virginia
0.0%
100.0%
Cities with the Highest Percentage of Households With Three or more Vehicles in West Virginia
| City | Housholds With 3+ Cars | vs State | vs National | |
| 1. | Kimball | 100.0% | 25.8%(+74.2)#1 | 29.0%(+71.0)#49 |
| 2. | Glen White | 100.0% | 25.8%(+74.2)#2 | 29.0%(+71.0)#85 |
| 3. | Roderfield | 100.0% | 25.8%(+74.2)#3 | 29.0%(+71.0)#126 |
| 4. | Peach Creek | 100.0% | 25.8%(+74.2)#4 | 29.0%(+71.0)#213 |
| 5. | Shenandoah Junction | 62.2% | 25.8%(+36.4)#5 | 29.0%(+33.2)#1,389 |
| 6. | Sarah Ann | 61.7% | 25.8%(+35.9)#6 | 29.0%(+32.7)#1,444 |
| 7. | Fenwick | 61.5% | 25.8%(+35.7)#7 | 29.0%(+32.5)#1,463 |
| 8. | Chattaroy | 58.1% | 25.8%(+32.3)#8 | 29.0%(+29.1)#1,865 |
| 9. | Montcalm | 54.4% | 25.8%(+28.6)#9 | 29.0%(+25.4)#2,399 |
| 10. | Green Bank | 54.2% | 25.8%(+28.4)#10 | 29.0%(+25.2)#2,440 |
| 11. | Falling Spring | 52.9% | 25.8%(+27.1)#11 | 29.0%(+23.9)#2,701 |
| 12. | Falling Waters | 51.3% | 25.8%(+25.5)#12 | 29.0%(+22.3)#3,019 |
| 13. | Nettie | 50.9% | 25.8%(+25.1)#13 | 29.0%(+21.9)#3,095 |
| 14. | Big Chimney | 50.0% | 25.8%(+24.2)#14 | 29.0%(+21.0)#3,270 |
| 15. | Cottageville | 50.0% | 25.8%(+24.2)#15 | 29.0%(+21.0)#3,307 |
| 16. | Lashmeet | 49.8% | 25.8%(+24.0)#16 | 29.0%(+20.8)#3,449 |
| 17. | East Dailey | 48.5% | 25.8%(+22.7)#17 | 29.0%(+19.5)#3,754 |
| 18. | Charlton Heights | 48.2% | 25.8%(+22.4)#18 | 29.0%(+19.2)#3,838 |
| 19. | Raysal | 47.9% | 25.8%(+22.1)#19 | 29.0%(+18.9)#3,916 |
| 20. | Reader | 47.9% | 25.8%(+22.1)#20 | 29.0%(+18.9)#3,928 |
| 21. | Great Cacapon | 46.0% | 25.8%(+20.2)#21 | 29.0%(+17.0)#4,509 |
| 22. | Summersville | 45.2% | 25.8%(+19.4)#22 | 29.0%(+16.2)#4,772 |
| 23. | New Haven | 44.6% | 25.8%(+18.8)#23 | 29.0%(+15.6)#4,982 |
| 24. | Tunnelton | 44.2% | 25.8%(+18.4)#24 | 29.0%(+15.2)#5,156 |
| 25. | Huttonsville | 44.2% | 25.8%(+18.4)#25 | 29.0%(+15.2)#5,165 |
| 26. | Flatwoods | 43.2% | 25.8%(+17.4)#26 | 29.0%(+14.2)#5,569 |
| 27. | Fort Ashby | 42.5% | 25.8%(+16.7)#27 | 29.0%(+13.5)#5,854 |
| 28. | Hinkleville | 42.5% | 25.8%(+16.7)#28 | 29.0%(+13.5)#5,864 |
| 29. | Gilbert Creek | 42.4% | 25.8%(+16.6)#29 | 29.0%(+13.4)#5,893 |
| 30. | Elizabeth | 42.4% | 25.8%(+16.6)#30 | 29.0%(+13.4)#5,895 |
| 31. | Institute | 42.4% | 25.8%(+16.6)#31 | 29.0%(+13.4)#5,897 |
| 32. | Clifton | 41.6% | 25.8%(+15.8)#32 | 29.0%(+12.6)#6,311 |
| 33. | Carpendale | 40.1% | 25.8%(+14.3)#33 | 29.0%(+11.1)#7,039 |
| 34. | Athens | 39.7% | 25.8%(+13.9)#34 | 29.0%(+10.7)#7,285 |
| 35. | Davy | 39.7% | 25.8%(+13.9)#35 | 29.0%(+10.7)#7,303 |
| 36. | Prichard | 39.5% | 25.8%(+13.7)#36 | 29.0%(+10.5)#7,425 |
| 37. | Arthurdale | 39.0% | 25.8%(+13.2)#37 | 29.0%(+10.0)#7,680 |
| 38. | Middleway | 38.9% | 25.8%(+13.1)#38 | 29.0%(+9.90)#7,748 |
| 39. | Racine | 38.8% | 25.8%(+13.0)#39 | 29.0%(+9.80)#7,822 |
| 40. | Wayne | 38.3% | 25.8%(+12.5)#40 | 29.0%(+9.30)#8,120 |
| 41. | Alum Creek | 38.1% | 25.8%(+12.3)#41 | 29.0%(+9.10)#8,233 |
| 42. | Meadow Bridge | 38.1% | 25.8%(+12.3)#42 | 29.0%(+9.10)#8,242 |
| 43. | Van | 37.5% | 25.8%(+11.7)#43 | 29.0%(+8.50)#8,604 |
| 44. | Reedsville | 37.0% | 25.8%(+11.2)#44 | 29.0%(+8.00)#8,917 |
| 45. | Eskdale | 36.8% | 25.8%(+11.0)#45 | 29.0%(+7.80)#9,063 |
| 46. | Frank | 36.8% | 25.8%(+11.0)#46 | 29.0%(+7.80)#9,075 |
| 47. | Mineralwells | 36.2% | 25.8%(+10.4)#47 | 29.0%(+7.20)#9,438 |
| 48. | Buffalo | 35.8% | 25.8%(+10.00)#48 | 29.0%(+6.80)#9,687 |
| 49. | Keyser | 35.7% | 25.8%(+9.90)#49 | 29.0%(+6.70)#9,728 |
| 50. | Ghent | 35.7% | 25.8%(+9.90)#50 | 29.0%(+6.70)#9,754 |
| 51. | Middlebourne | 35.5% | 25.8%(+9.70)#51 | 29.0%(+6.50)#9,905 |
| 52. | Lumberport | 35.5% | 25.8%(+9.70)#52 | 29.0%(+6.50)#9,907 |
| 53. | Rachel | 35.3% | 25.8%(+9.50)#53 | 29.0%(+6.30)#10,043 |
| 54. | Boaz | 35.1% | 25.8%(+9.30)#54 | 29.0%(+6.10)#10,155 |
| 55. | Anawalt | 35.1% | 25.8%(+9.30)#55 | 29.0%(+6.10)#10,199 |
| 56. | Hendricks | 34.7% | 25.8%(+8.90)#56 | 29.0%(+5.70)#10,482 |
| 57. | Wallace | 34.6% | 25.8%(+8.80)#57 | 29.0%(+5.60)#10,560 |
| 58. | Berwind | 34.6% | 25.8%(+8.80)#58 | 29.0%(+5.60)#10,565 |
| 59. | Lost Creek | 34.5% | 25.8%(+8.70)#59 | 29.0%(+5.50)#10,646 |
| 60. | Ellenboro | 34.4% | 25.8%(+8.60)#60 | 29.0%(+5.40)#10,741 |
| 61. | Bergoo | 34.1% | 25.8%(+8.30)#61 | 29.0%(+5.10)#10,993 |
| 62. | West Liberty | 33.3% | 25.8%(+7.50)#62 | 29.0%(+4.30)#11,564 |
| 63. | Kimberly | 33.3% | 25.8%(+7.50)#63 | 29.0%(+4.30)#11,619 |
| 64. | Apple Grove | 33.3% | 25.8%(+7.50)#64 | 29.0%(+4.30)#11,670 |
| 65. | Bluewell | 33.2% | 25.8%(+7.40)#65 | 29.0%(+4.20)#11,780 |
| 66. | Belington | 33.1% | 25.8%(+7.30)#66 | 29.0%(+4.10)#11,835 |
| 67. | White Hall | 33.0% | 25.8%(+7.20)#67 | 29.0%(+4.00)#11,908 |
| 68. | Booth | 32.6% | 25.8%(+6.80)#68 | 29.0%(+3.60)#12,221 |
| 69. | Hillsboro | 32.6% | 25.8%(+6.80)#69 | 29.0%(+3.60)#12,227 |
| 70. | Winfield | 32.3% | 25.8%(+6.50)#70 | 29.0%(+3.30)#12,436 |
| 71. | Cairo | 32.3% | 25.8%(+6.50)#71 | 29.0%(+3.30)#12,486 |
| 72. | Neibert | 32.0% | 25.8%(+6.20)#72 | 29.0%(+3.00)#12,737 |
| 73. | West Union | 31.7% | 25.8%(+5.90)#73 | 29.0%(+2.70)#12,982 |
| 74. | Scarbro | 31.7% | 25.8%(+5.90)#74 | 29.0%(+2.70)#13,003 |
| 75. | Moorefield | 31.5% | 25.8%(+5.70)#75 | 29.0%(+2.50)#13,136 |
| 76. | Ansted | 31.5% | 25.8%(+5.70)#76 | 29.0%(+2.50)#13,156 |
| 77. | Robinette | 31.5% | 25.8%(+5.70)#77 | 29.0%(+2.50)#13,169 |
| 78. | Mullens | 31.4% | 25.8%(+5.60)#78 | 29.0%(+2.40)#13,213 |
| 79. | Mcmechen | 31.4% | 25.8%(+5.60)#79 | 29.0%(+2.40)#13,221 |
| 80. | Cassville | 31.4% | 25.8%(+5.60)#80 | 29.0%(+2.40)#13,226 |
| 81. | Flemington | 31.3% | 25.8%(+5.50)#81 | 29.0%(+2.30)#13,359 |
| 82. | Dixie | 31.3% | 25.8%(+5.50)#82 | 29.0%(+2.30)#13,377 |
| 83. | Wiley Ford | 31.0% | 25.8%(+5.20)#83 | 29.0%(+2.00)#13,612 |
| 84. | Stonewood | 30.9% | 25.8%(+5.10)#84 | 29.0%(+1.90)#13,675 |
| 85. | Waverly | 30.4% | 25.8%(+4.60)#85 | 29.0%(+1.40)#14,170 |
| 86. | Rock Cave | 30.4% | 25.8%(+4.60)#86 | 29.0%(+1.40)#14,181 |
| 87. | Shannondale | 30.0% | 25.8%(+4.20)#87 | 29.0%(+1.00)#14,499 |
| 88. | Gatewood | 29.3% | 25.8%(+3.50)#88 | 29.0%(+0.300)#15,182 |
| 89. | Tornado | 29.2% | 25.8%(+3.40)#89 | 29.0%(+0.200)#15,259 |
| 90. | Salem | 29.0% | 25.8%(+3.20)#90 | 29.0%(=0.000)#15,439 |
| 91. | Kopperston | 29.0% | 25.8%(+3.20)#91 | 29.0%(=0.000)#15,452 |
| 92. | Capon Bridge | 29.0% | 25.8%(+3.20)#92 | 29.0%(=0.000)#15,464 |
| 93. | Bridgeport | 28.9% | 25.8%(+3.10)#93 | 29.0%(-0.100)#15,509 |
| 94. | Culloden | 28.9% | 25.8%(+3.10)#94 | 29.0%(-0.100)#15,521 |
| 95. | Madison | 28.9% | 25.8%(+3.10)#95 | 29.0%(-0.100)#15,522 |
| 96. | Rainelle | 28.7% | 25.8%(+2.90)#96 | 29.0%(-0.300)#15,732 |
| 97. | Jane Lew | 28.7% | 25.8%(+2.90)#97 | 29.0%(-0.300)#15,754 |
| 98. | Danville | 28.5% | 25.8%(+2.70)#98 | 29.0%(-0.500)#16,001 |
| 99. | Smithers | 28.4% | 25.8%(+2.60)#99 | 29.0%(-0.600)#16,077 |
| 100. | Prosperity | 28.3% | 25.8%(+2.50)#100 | 29.0%(-0.700)#16,163 |
Common Questions
What are the Top 10 Cities with the Highest Percentage of Households With Three or more Vehicles in West Virginia?
Top 10 Cities with the Highest Percentage of Households With Three or more Vehicles in West Virginia are:
#1
100.0%
#2
100.0%
#3
100.0%
#4
62.2%
#5
61.7%
#6
61.5%
#7
58.1%
#8
54.4%
#9
54.2%
#10
52.9%
What city has the Highest Percentage of Households With Three or more Vehicles in West Virginia?
Kimball has the Highest Percentage of Households With Three or more Vehicles in West Virginia with 100.0%.
What is the Percentage of Households With Three or more Vehicles in the State of West Virginia?
Percentage of Households With Three or more Vehicles in West Virginia is 25.8%.
What is the Percentage of Households With Three or more Vehicles in the United States?
Percentage of Households With Three or more Vehicles in the United States is 29.0%.