Cities with the Highest Percentage of Households With Three or more Vehicles in Maryland
RELATED REPORTS & OPTIONS
Households with 3 or more Cars
Maryland
Compare Cities
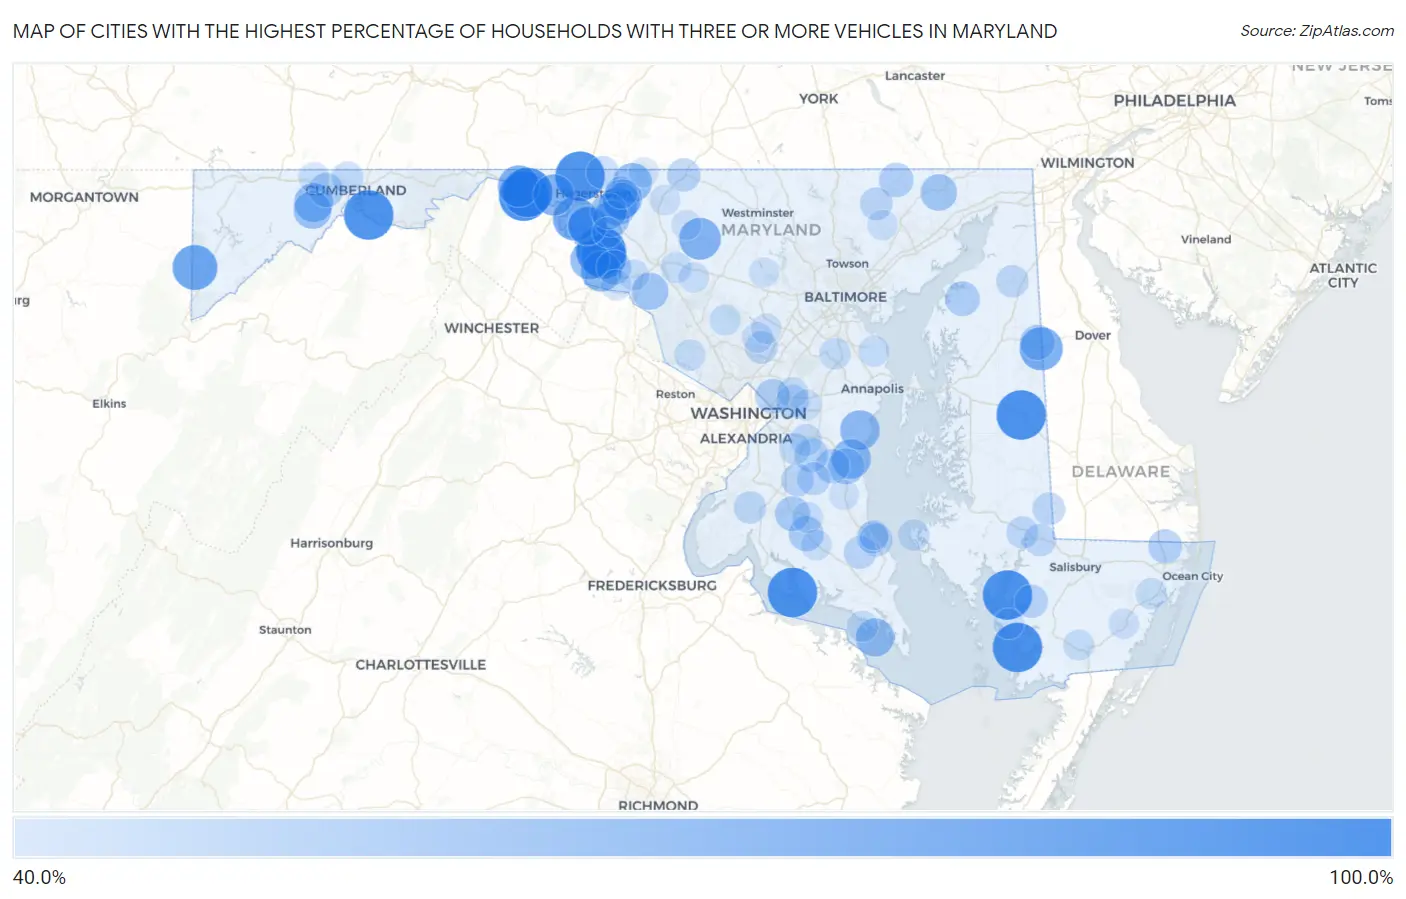
Map of Cities with the Highest Percentage of Households With Three or more Vehicles in Maryland
0.0%
100.0%
Cities with the Highest Percentage of Households With Three or more Vehicles in Maryland
| City | Housholds With 3+ Cars | vs State | vs National | |
| 1. | Nanticoke | 100.0% | 29.5%(+70.5)#1 | 29.0%(+71.0)#34 |
| 2. | Mount Briar | 100.0% | 29.5%(+70.5)#2 | 29.0%(+71.0)#96 |
| 3. | Cearfoss | 100.0% | 29.5%(+70.5)#3 | 29.0%(+71.0)#113 |
| 4. | Rock Point | 100.0% | 29.5%(+70.5)#4 | 29.0%(+71.0)#173 |
| 5. | West Denton | 100.0% | 29.5%(+70.5)#5 | 29.0%(+71.0)#229 |
| 6. | Spring Gap | 100.0% | 29.5%(+70.5)#6 | 29.0%(+71.0)#248 |
| 7. | Ernstville | 100.0% | 29.5%(+70.5)#7 | 29.0%(+71.0)#316 |
| 8. | Indian Springs | 100.0% | 29.5%(+70.5)#8 | 29.0%(+71.0)#356 |
| 9. | Frenchtown Rumbly | 100.0% | 29.5%(+70.5)#9 | 29.0%(+71.0)#368 |
| 10. | Trego Rohrersville Station | 87.5% | 29.5%(+58.0)#10 | 29.0%(+58.5)#453 |
| 11. | Crellin | 85.7% | 29.5%(+56.2)#11 | 29.0%(+56.7)#475 |
| 12. | Downsville | 83.3% | 29.5%(+53.8)#12 | 29.0%(+54.3)#511 |
| 13. | Marydel | 80.8% | 29.5%(+51.3)#13 | 29.0%(+51.8)#566 |
| 14. | Pecktonville | 76.7% | 29.5%(+47.2)#14 | 29.0%(+47.7)#673 |
| 15. | Libertytown | 76.5% | 29.5%(+47.0)#15 | 29.0%(+47.5)#675 |
| 16. | Charlton | 75.0% | 29.5%(+45.5)#16 | 29.0%(+46.0)#725 |
| 17. | Yarrowsburg | 72.7% | 29.5%(+43.2)#17 | 29.0%(+43.7)#809 |
| 18. | Galesville | 70.2% | 29.5%(+40.7)#18 | 29.0%(+41.2)#883 |
| 19. | Friendship | 69.5% | 29.5%(+40.0)#19 | 29.0%(+40.5)#913 |
| 20. | Antietam | 69.2% | 29.5%(+39.7)#20 | 29.0%(+40.2)#928 |
| 21. | Fairplay | 69.0% | 29.5%(+39.5)#21 | 29.0%(+40.0)#931 |
| 22. | Edgemont | 68.5% | 29.5%(+39.0)#22 | 29.0%(+39.5)#958 |
| 23. | Pondsville | 68.3% | 29.5%(+38.8)#23 | 29.0%(+39.3)#972 |
| 24. | Woodland | 68.2% | 29.5%(+38.7)#24 | 29.0%(+39.2)#978 |
| 25. | Tilghmanton | 67.7% | 29.5%(+38.2)#25 | 29.0%(+38.7)#1,003 |
| 26. | St George Island | 66.7% | 29.5%(+37.2)#26 | 29.0%(+37.7)#1,055 |
| 27. | Mount Aetna | 65.4% | 29.5%(+35.9)#27 | 29.0%(+36.4)#1,155 |
| 28. | Gilmore | 65.1% | 29.5%(+35.6)#28 | 29.0%(+36.1)#1,174 |
| 29. | Jugtown | 62.9% | 29.5%(+33.4)#29 | 29.0%(+33.9)#1,334 |
| 30. | Adamstown | 62.0% | 29.5%(+32.5)#30 | 29.0%(+33.0)#1,416 |
| 31. | Darlington | 61.3% | 29.5%(+31.8)#31 | 29.0%(+32.3)#1,479 |
| 32. | San Mar | 61.1% | 29.5%(+31.6)#32 | 29.0%(+32.1)#1,502 |
| 33. | Beaver Creek | 60.6% | 29.5%(+31.1)#33 | 29.0%(+31.6)#1,556 |
| 34. | Owings | 59.9% | 29.5%(+30.4)#34 | 29.0%(+30.9)#1,648 |
| 35. | Templeville | 57.1% | 29.5%(+27.6)#35 | 29.0%(+28.1)#1,973 |
| 36. | Charlotte Hall | 56.8% | 29.5%(+27.3)#36 | 29.0%(+27.8)#2,026 |
| 37. | Bryantown | 56.7% | 29.5%(+27.2)#37 | 29.0%(+27.7)#2,043 |
| 38. | Ten Mile Creek | 56.2% | 29.5%(+26.7)#38 | 29.0%(+27.2)#2,107 |
| 39. | Burkittsville | 56.0% | 29.5%(+26.5)#39 | 29.0%(+27.0)#2,154 |
| 40. | Butlertown | 55.8% | 29.5%(+26.3)#40 | 29.0%(+26.8)#2,178 |
| 41. | Edmonston | 55.6% | 29.5%(+26.1)#41 | 29.0%(+26.6)#2,196 |
| 42. | Eckhart Mines | 55.3% | 29.5%(+25.8)#42 | 29.0%(+26.3)#2,263 |
| 43. | Pylesville | 55.0% | 29.5%(+25.5)#43 | 29.0%(+26.0)#2,306 |
| 44. | Dunkirk | 54.8% | 29.5%(+25.3)#44 | 29.0%(+25.8)#2,331 |
| 45. | Bishopville | 54.1% | 29.5%(+24.6)#45 | 29.0%(+25.1)#2,448 |
| 46. | Croom | 53.6% | 29.5%(+24.1)#46 | 29.0%(+24.6)#2,534 |
| 47. | Mount Vernon | 52.1% | 29.5%(+22.6)#47 | 29.0%(+23.1)#2,865 |
| 48. | Emmitsburg | 52.0% | 29.5%(+22.5)#48 | 29.0%(+23.0)#2,885 |
| 49. | Baden | 51.1% | 29.5%(+21.6)#49 | 29.0%(+22.1)#3,053 |
| 50. | Long Beach | 51.1% | 29.5%(+21.6)#50 | 29.0%(+22.1)#3,055 |
| 51. | Green Valley | 50.7% | 29.5%(+21.2)#51 | 29.0%(+21.7)#3,119 |
| 52. | Broomes Island | 50.5% | 29.5%(+21.0)#52 | 29.0%(+21.5)#3,178 |
| 53. | Springdale | 50.2% | 29.5%(+20.7)#53 | 29.0%(+21.2)#3,215 |
| 54. | Jarrettsville | 50.2% | 29.5%(+20.7)#54 | 29.0%(+21.2)#3,219 |
| 55. | Cedarville | 50.2% | 29.5%(+20.7)#55 | 29.0%(+21.2)#3,228 |
| 56. | Reid | 50.0% | 29.5%(+20.5)#56 | 29.0%(+21.0)#3,345 |
| 57. | Galestown | 50.0% | 29.5%(+20.5)#57 | 29.0%(+21.0)#3,361 |
| 58. | Spencerville | 49.7% | 29.5%(+20.2)#58 | 29.0%(+20.7)#3,467 |
| 59. | Cavetown | 49.7% | 29.5%(+20.2)#59 | 29.0%(+20.7)#3,470 |
| 60. | Galena | 49.6% | 29.5%(+20.1)#60 | 29.0%(+20.6)#3,489 |
| 61. | Pomfret | 49.5% | 29.5%(+20.0)#61 | 29.0%(+20.5)#3,501 |
| 62. | Mardela Springs | 49.4% | 29.5%(+19.9)#62 | 29.0%(+20.4)#3,520 |
| 63. | Vienna | 49.1% | 29.5%(+19.6)#63 | 29.0%(+20.1)#3,598 |
| 64. | St Leonard | 48.5% | 29.5%(+19.0)#64 | 29.0%(+19.5)#3,749 |
| 65. | Queensland | 47.9% | 29.5%(+18.4)#65 | 29.0%(+18.9)#3,909 |
| 66. | Corriganville | 47.5% | 29.5%(+18.0)#66 | 29.0%(+18.5)#4,038 |
| 67. | Abingdon | 47.2% | 29.5%(+17.7)#67 | 29.0%(+18.2)#4,094 |
| 68. | Gambrills | 47.1% | 29.5%(+17.6)#68 | 29.0%(+18.1)#4,129 |
| 69. | Rosaryville | 47.0% | 29.5%(+17.5)#69 | 29.0%(+18.0)#4,168 |
| 70. | Graceham | 46.9% | 29.5%(+17.4)#70 | 29.0%(+17.9)#4,215 |
| 71. | Taylors Island | 46.6% | 29.5%(+17.1)#71 | 29.0%(+17.6)#4,313 |
| 72. | Tall Timbers | 46.4% | 29.5%(+16.9)#72 | 29.0%(+17.4)#4,371 |
| 73. | Hughesville | 46.0% | 29.5%(+16.5)#73 | 29.0%(+17.0)#4,496 |
| 74. | Bartonsville | 45.9% | 29.5%(+16.4)#74 | 29.0%(+16.9)#4,526 |
| 75. | Newark | 45.9% | 29.5%(+16.4)#75 | 29.0%(+16.9)#4,546 |
| 76. | Lanham | 45.8% | 29.5%(+16.3)#76 | 29.0%(+16.8)#4,552 |
| 77. | Lake Shore | 45.5% | 29.5%(+16.0)#77 | 29.0%(+16.5)#4,670 |
| 78. | Darnestown | 45.5% | 29.5%(+16.0)#78 | 29.0%(+16.5)#4,671 |
| 79. | Jefferson | 45.5% | 29.5%(+16.0)#79 | 29.0%(+16.5)#4,678 |
| 80. | West Pocomoke | 45.4% | 29.5%(+15.9)#80 | 29.0%(+16.4)#4,732 |
| 81. | Laytonsville | 45.3% | 29.5%(+15.8)#81 | 29.0%(+16.3)#4,749 |
| 82. | Mechanicsville | 45.2% | 29.5%(+15.7)#82 | 29.0%(+16.2)#4,779 |
| 83. | Dames Quarter | 45.2% | 29.5%(+15.7)#83 | 29.0%(+16.2)#4,801 |
| 84. | Ashton Sandy Spring | 44.7% | 29.5%(+15.2)#84 | 29.0%(+15.7)#4,941 |
| 85. | Woodmore | 44.7% | 29.5%(+15.2)#85 | 29.0%(+15.7)#4,944 |
| 86. | Rosemont | 44.7% | 29.5%(+15.2)#86 | 29.0%(+15.7)#4,966 |
| 87. | Finzel | 44.6% | 29.5%(+15.1)#87 | 29.0%(+15.6)#4,990 |
| 88. | Monrovia | 44.4% | 29.5%(+14.9)#88 | 29.0%(+15.4)#5,038 |
| 89. | Brown Station | 44.3% | 29.5%(+14.8)#89 | 29.0%(+15.3)#5,101 |
| 90. | Boonsboro | 44.2% | 29.5%(+14.7)#90 | 29.0%(+15.2)#5,136 |
| 91. | Thurmont | 43.9% | 29.5%(+14.4)#91 | 29.0%(+14.9)#5,256 |
| 92. | Calvert Beach | 43.9% | 29.5%(+14.4)#92 | 29.0%(+14.9)#5,271 |
| 93. | Snow Hill | 43.8% | 29.5%(+14.3)#93 | 29.0%(+14.8)#5,302 |
| 94. | Fallston | 43.7% | 29.5%(+14.2)#94 | 29.0%(+14.7)#5,351 |
| 95. | Highland | 43.7% | 29.5%(+14.2)#95 | 29.0%(+14.7)#5,368 |
| 96. | Woodsboro | 43.3% | 29.5%(+13.8)#96 | 29.0%(+14.3)#5,522 |
| 97. | Sykesville | 43.2% | 29.5%(+13.7)#97 | 29.0%(+14.2)#5,556 |
| 98. | Highfield Cascade | 43.0% | 29.5%(+13.5)#98 | 29.0%(+14.0)#5,642 |
| 99. | Huntingtown | 42.9% | 29.5%(+13.4)#99 | 29.0%(+13.9)#5,661 |
| 100. | Callaway | 42.9% | 29.5%(+13.4)#100 | 29.0%(+13.9)#5,667 |
Common Questions
What are the Top 10 Cities with the Highest Percentage of Households With Three or more Vehicles in Maryland?
Top 10 Cities with the Highest Percentage of Households With Three or more Vehicles in Maryland are:
#1
100.0%
#2
100.0%
#3
100.0%
#4
100.0%
#5
100.0%
#6
100.0%
#7
100.0%
#8
100.0%
#9
100.0%
#10
87.5%
What city has the Highest Percentage of Households With Three or more Vehicles in Maryland?
Nanticoke has the Highest Percentage of Households With Three or more Vehicles in Maryland with 100.0%.
What is the Percentage of Households With Three or more Vehicles in the State of Maryland?
Percentage of Households With Three or more Vehicles in Maryland is 29.5%.
What is the Percentage of Households With Three or more Vehicles in the United States?
Percentage of Households With Three or more Vehicles in the United States is 29.0%.