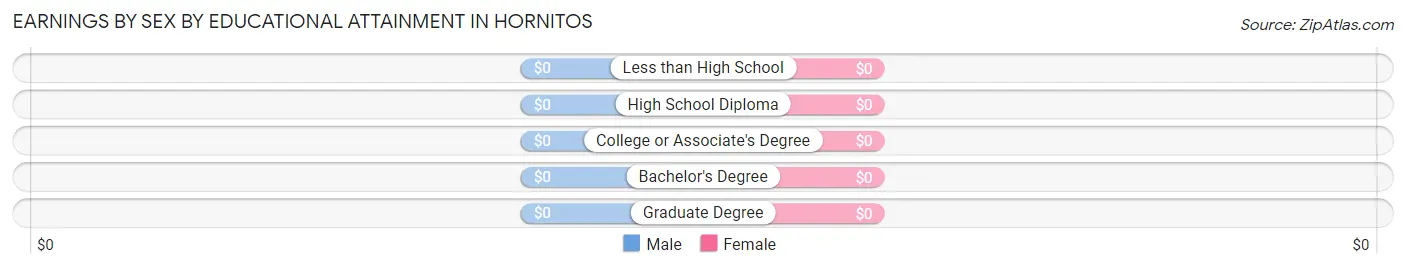
Earnings by Sex by Educational Attainment in Hornitos
Educational Attainment
Male Income
Female Income
Less than High School
-
-
High School Diploma
-
-
College or Associate's Degree
-
-
Bachelor's Degree
-
-
Graduate Degree
-
-
Total
-
-
Family Income in Hornitos
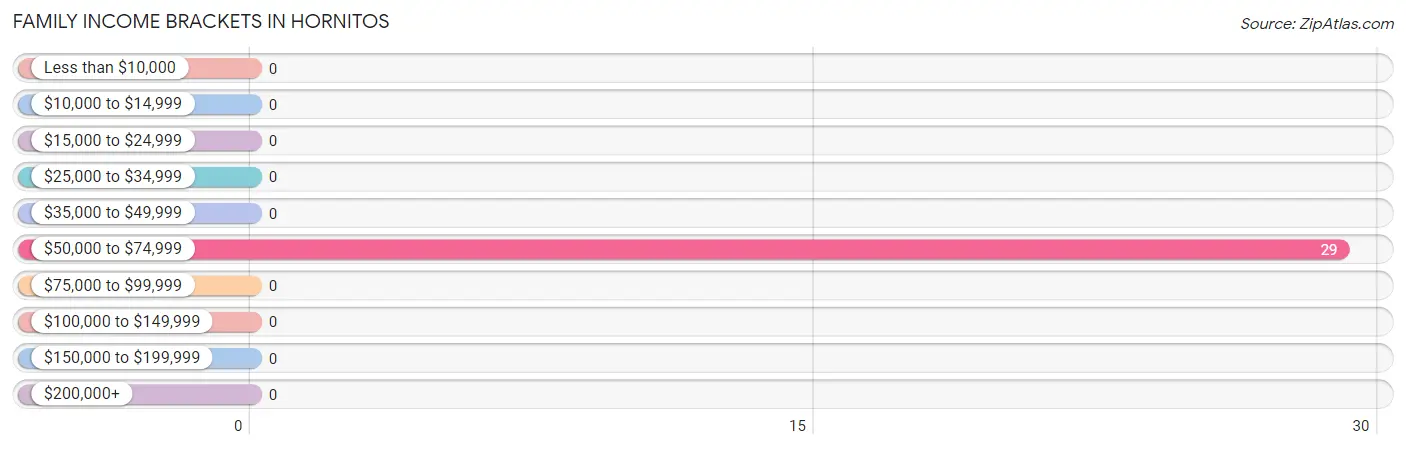
Family Income Brackets in Hornitos
According to the Hornitos family income data, there are 29 families falling into the $50,000 to $74,999 income range, which is the most common income bracket and makes up 100.0% of all families.
Income Bracket
# Families
% Families
Less than $10,000
0
0.0%
$10,000 to $14,999
0
0.0%
$15,000 to $24,999
0
0.0%
$25,000 to $34,999
0
0.0%
$35,000 to $49,999
0
0.0%
$50,000 to $74,999
29
100.0%
$75,000 to $99,999
0
0.0%
$100,000 to $149,999
0
0.0%
$150,000 to $199,999
0
0.0%
$200,000+
0
0.0%
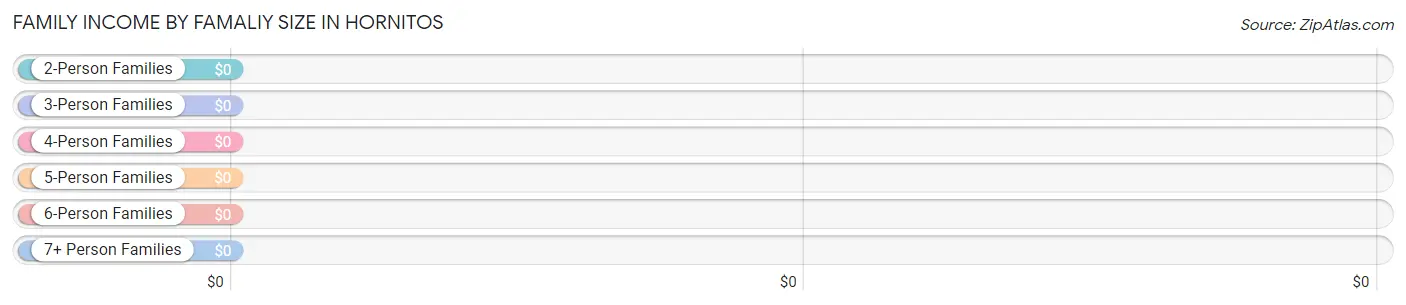
Family Income by Famaliy Size in Hornitos
Income Bracket
# Families
Median Income
2-Person Families
29 (100.0%)
$0
3-Person Families
0 (0.0%)
$0
4-Person Families
0 (0.0%)
$0
5-Person Families
0 (0.0%)
$0
6-Person Families
0 (0.0%)
$0
7+ Person Families
0 (0.0%)
$0
Total
29 (100.0%)
$0
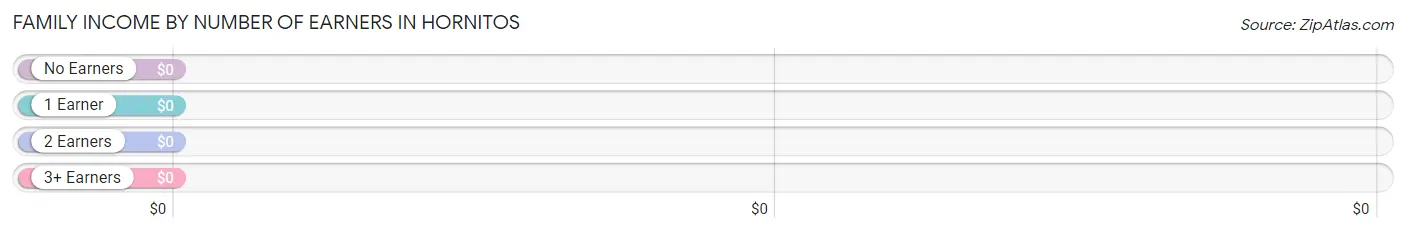
Family Income by Number of Earners in Hornitos
Number of Earners
# Families
Median Income
No Earners
0 (0.0%)
$0
1 Earner
29 (100.0%)
$0
2 Earners
0 (0.0%)
$0
3+ Earners
0 (0.0%)
$0
Total
29 (100.0%)
$0
Household Income in Hornitos
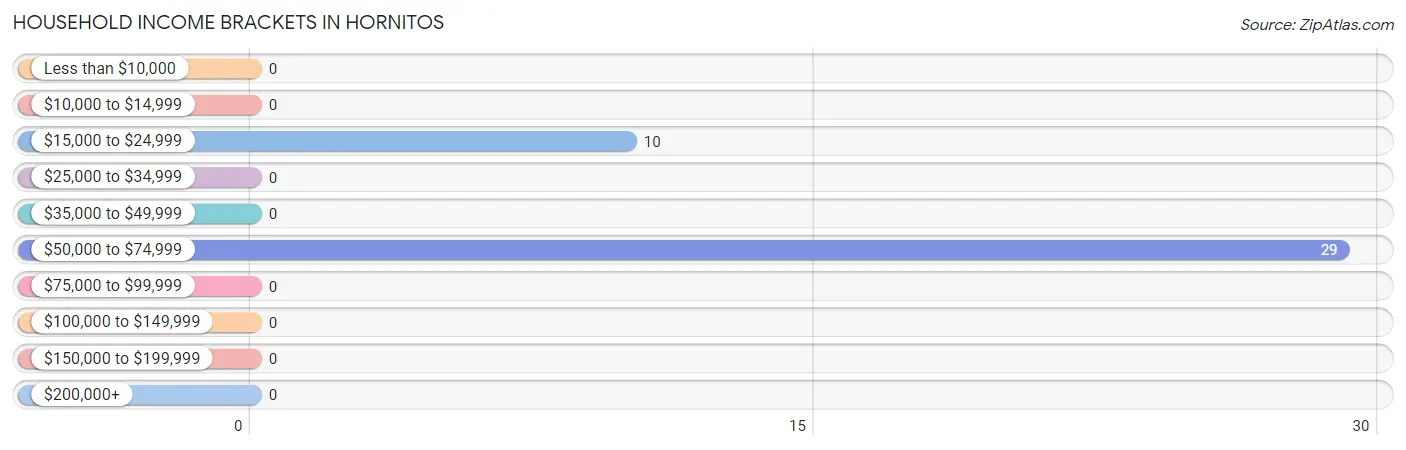
Household Income Brackets in Hornitos
With 29 households falling in the category, the $50,000 to $74,999 income range is the most frequent in Hornitos, accounting for 74.4% of all households.
Income Bracket
# Households
% Households
Less than $10,000
0
0.0%
$10,000 to $14,999
0
0.0%
$15,000 to $24,999
10
25.6%
$25,000 to $34,999
0
0.0%
$35,000 to $49,999
0
0.0%
$50,000 to $74,999
29
74.4%
$75,000 to $99,999
0
0.0%
$100,000 to $149,999
0
0.0%
$150,000 to $199,999
0
0.0%
$200,000+
0
0.0%
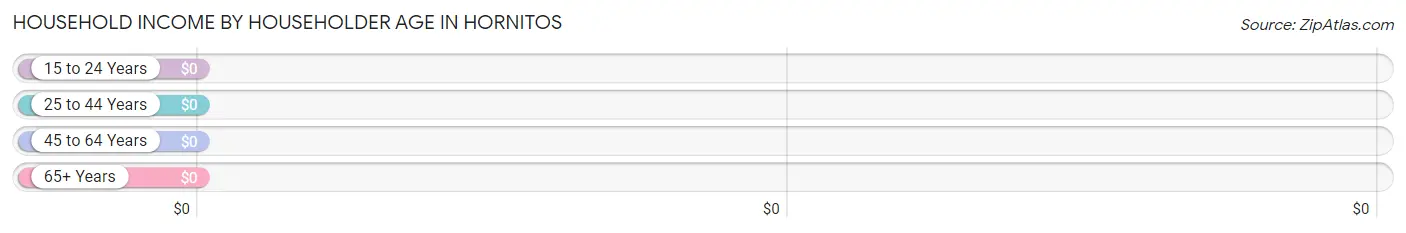
Household Income by Householder Age in Hornitos
Income Bracket
# Households
Median Income
15 to 24 Years
0 (0.0%)
$0
25 to 44 Years
0 (0.0%)
$0
45 to 64 Years
29 (74.4%)
$0
65+ Years
10 (25.6%)
$0
Total
39 (100.0%)
$0
Poverty in Hornitos
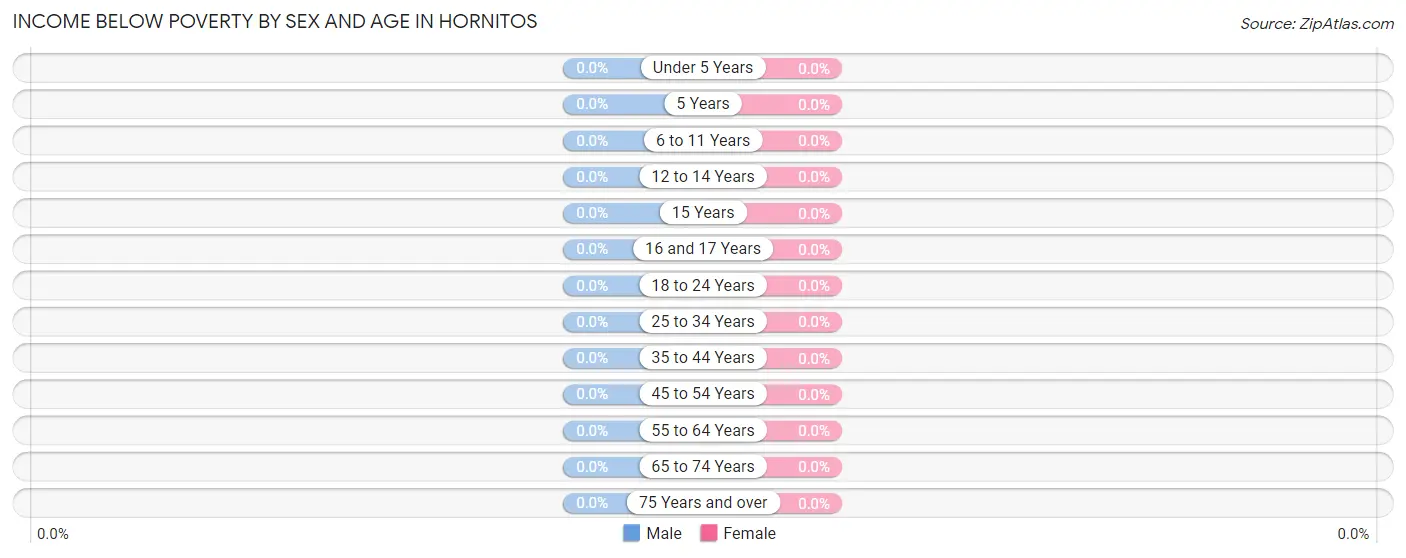
Income Below Poverty by Sex and Age in Hornitos
Age Bracket
Male
Female
Under 5 Years
0 (0.0%)
0 (0.0%)
5 Years
0 (0.0%)
0 (0.0%)
6 to 11 Years
0 (0.0%)
0 (0.0%)
12 to 14 Years
0 (0.0%)
0 (0.0%)
15 Years
0 (0.0%)
0 (0.0%)
16 and 17 Years
0 (0.0%)
0 (0.0%)
18 to 24 Years
0 (0.0%)
0 (0.0%)
25 to 34 Years
0 (0.0%)
0 (0.0%)
35 to 44 Years
0 (0.0%)
0 (0.0%)
45 to 54 Years
0 (0.0%)
0 (0.0%)
55 to 64 Years
0 (0.0%)
0 (0.0%)
65 to 74 Years
0 (0.0%)
0 (0.0%)
75 Years and over
0 (0.0%)
0 (0.0%)
Total
0 (0.0%)
0 (0.0%)
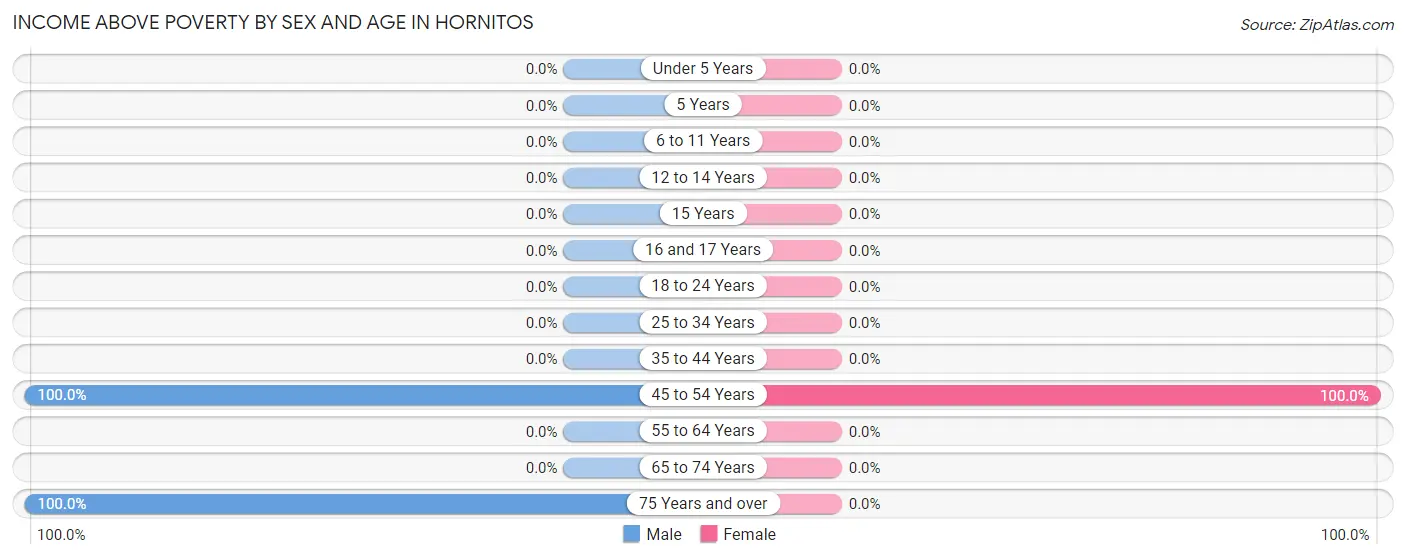
Income Above Poverty by Sex and Age in Hornitos
According to the poverty statistics in Hornitos, males aged 45 to 54 years and females aged 45 to 54 years are the age groups that are most secure financially, with 100.0% of males and 100.0% of females in these age groups living above the poverty line.
Age Bracket
Male
Female
Under 5 Years
0 (0.0%)
0 (0.0%)
5 Years
0 (0.0%)
0 (0.0%)
6 to 11 Years
0 (0.0%)
0 (0.0%)
12 to 14 Years
0 (0.0%)
0 (0.0%)
15 Years
0 (0.0%)
0 (0.0%)
16 and 17 Years
0 (0.0%)
0 (0.0%)
18 to 24 Years
0 (0.0%)
0 (0.0%)
25 to 34 Years
0 (0.0%)
0 (0.0%)
35 to 44 Years
0 (0.0%)
0 (0.0%)
45 to 54 Years
15 (100.0%)
29 (100.0%)
55 to 64 Years
0 (0.0%)
0 (0.0%)
65 to 74 Years
0 (0.0%)
0 (0.0%)
75 Years and over
10 (100.0%)
0 (0.0%)
Total
25 (100.0%)
29 (100.0%)
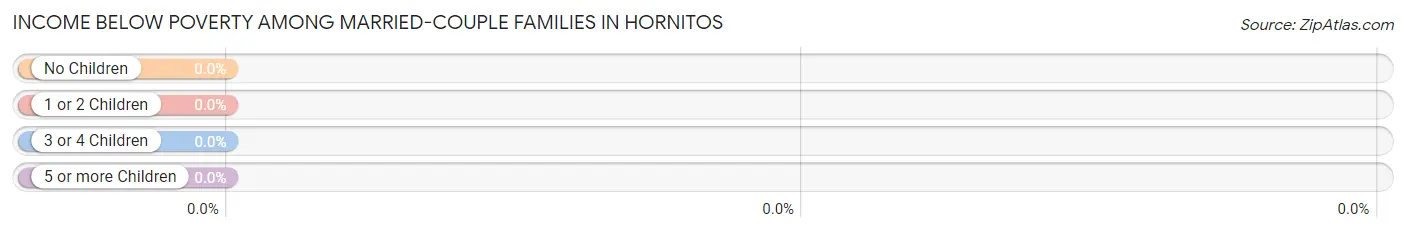
Income Below Poverty Among Married-Couple Families in Hornitos
Children
Above Poverty
Below Poverty
No Children
29 (100.0%)
0 (0.0%)
1 or 2 Children
0 (0.0%)
0 (0.0%)
3 or 4 Children
0 (0.0%)
0 (0.0%)
5 or more Children
0 (0.0%)
0 (0.0%)
Total
29 (100.0%)
0 (0.0%)
Income Below Poverty Among Single-Parent Households in Hornitos
Children
Single Father
Single Mother
No Children
0 (0.0%)
0 (0.0%)
1 or 2 Children
0 (0.0%)
0 (0.0%)
3 or 4 Children
0 (0.0%)
0 (0.0%)
5 or more Children
0 (0.0%)
0 (0.0%)
Total
0 (0.0%)
0 (0.0%)
Income Below Poverty Among Married-Couple vs Single-Parent Households in Hornitos
Children
Married-Couple Families
Single-Parent Households
No Children
0 (0.0%)
0 (0.0%)
1 or 2 Children
0 (0.0%)
0 (0.0%)
3 or 4 Children
0 (0.0%)
0 (0.0%)
5 or more Children
0 (0.0%)
0 (0.0%)
Total
0 (0.0%)
0 (0.0%)
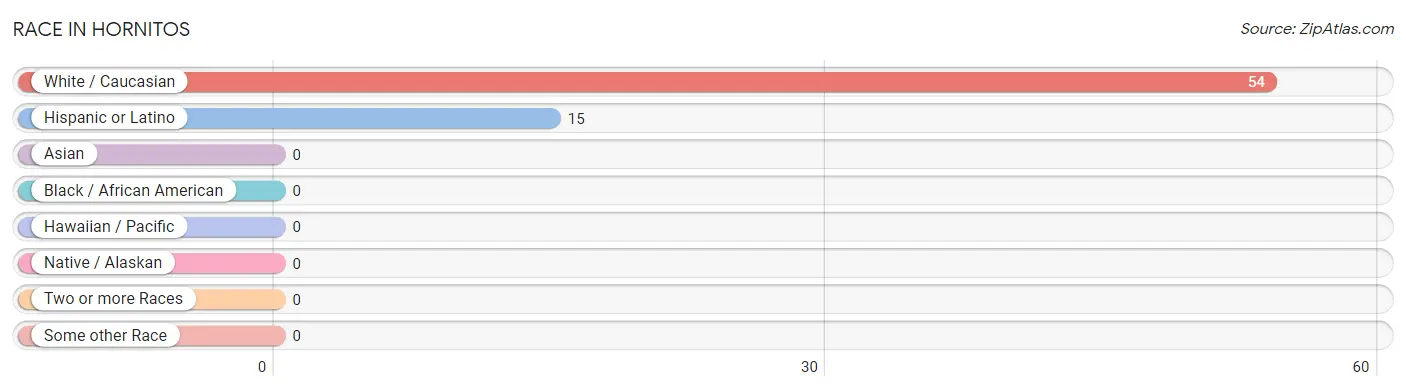
Race in Hornitos
The most populous races in Hornitos are White / Caucasian (54 | 100.0%), and Hispanic or Latino (15 | 27.8%).
Race
# Population
% Population
Asian
0
0.0%
Black / African American
0
0.0%
Hawaiian / Pacific
0
0.0%
Hispanic or Latino
15
27.8%
Native / Alaskan
0
0.0%
White / Caucasian
54
100.0%
Two or more Races
0
0.0%
Some other Race
0
0.0%
Total
54
100.0%
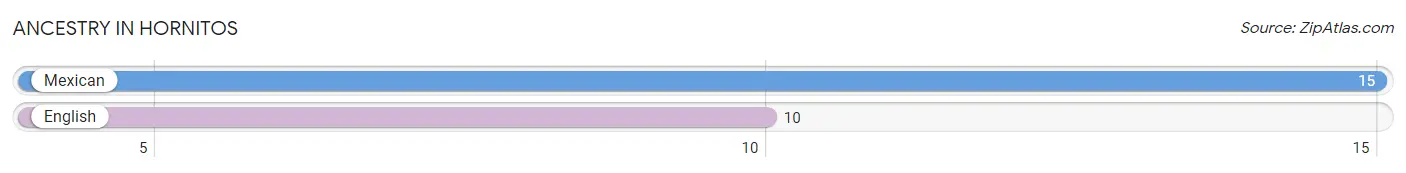
Ancestry in Hornitos
The most populous ancestries reported in Hornitos are Mexican (15 | 27.8%), and English (10 | 18.5%), together accounting for 46.3% of all Hornitos residents.
Ancestry
# Population
% Population
English
10
18.5%
Mexican
15
27.8%
View All 2 Rows
Immigrants in Hornitos
Immigration Origin
# Population
% Population
View All 0 Rows
Sex and Age in Hornitos
Sex and Age in Hornitos
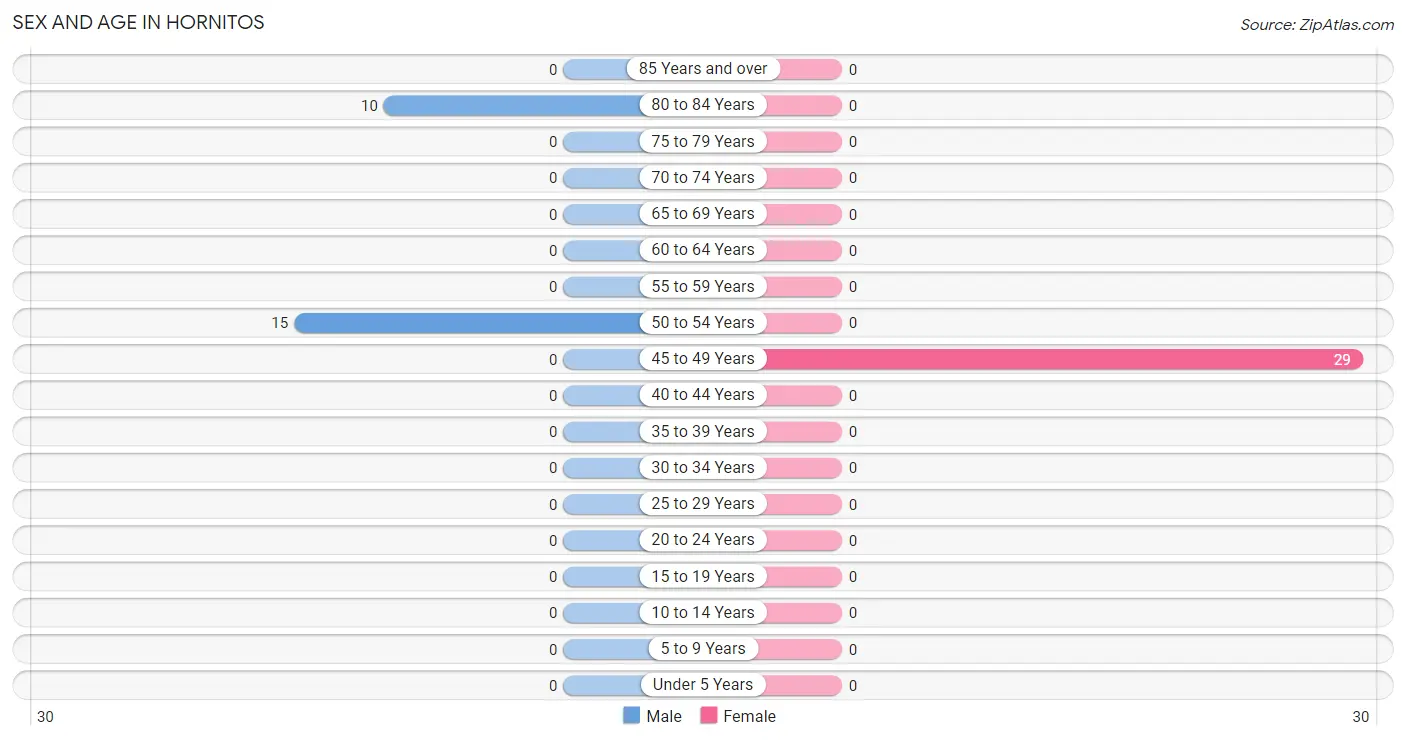
The most populous age groups in Hornitos are 50 to 54 Years (15 | 60.0%) for men and 45 to 49 Years (29 | 100.0%) for women.
Age Bracket
Male
Female
Under 5 Years
0 (0.0%)
0 (0.0%)
5 to 9 Years
0 (0.0%)
0 (0.0%)
10 to 14 Years
0 (0.0%)
0 (0.0%)
15 to 19 Years
0 (0.0%)
0 (0.0%)
20 to 24 Years
0 (0.0%)
0 (0.0%)
25 to 29 Years
0 (0.0%)
0 (0.0%)
30 to 34 Years
0 (0.0%)
0 (0.0%)
35 to 39 Years
0 (0.0%)
0 (0.0%)
40 to 44 Years
0 (0.0%)
0 (0.0%)
45 to 49 Years
0 (0.0%)
29 (100.0%)
50 to 54 Years
15 (60.0%)
0 (0.0%)
55 to 59 Years
0 (0.0%)
0 (0.0%)
60 to 64 Years
0 (0.0%)
0 (0.0%)
65 to 69 Years
0 (0.0%)
0 (0.0%)
70 to 74 Years
0 (0.0%)
0 (0.0%)
75 to 79 Years
0 (0.0%)
0 (0.0%)
80 to 84 Years
10 (40.0%)
0 (0.0%)
85 Years and over
0 (0.0%)
0 (0.0%)
Total
25 (100.0%)
29 (100.0%)
Families and Households in Hornitos
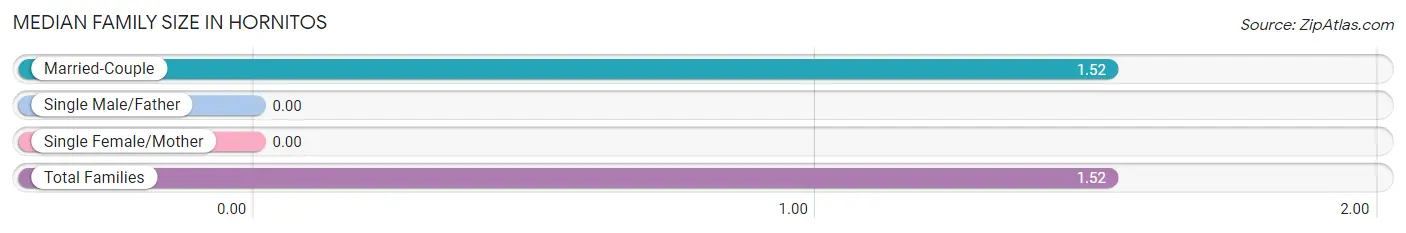
Median Family Size in Hornitos
Family Type
# Families
Family Size
Married-Couple
29 (100.0%)
1.52
Single Male/Father
0 (0.0%)
-
Single Female/Mother
0 (0.0%)
-
Total Families
29 (100.0%)
1.52
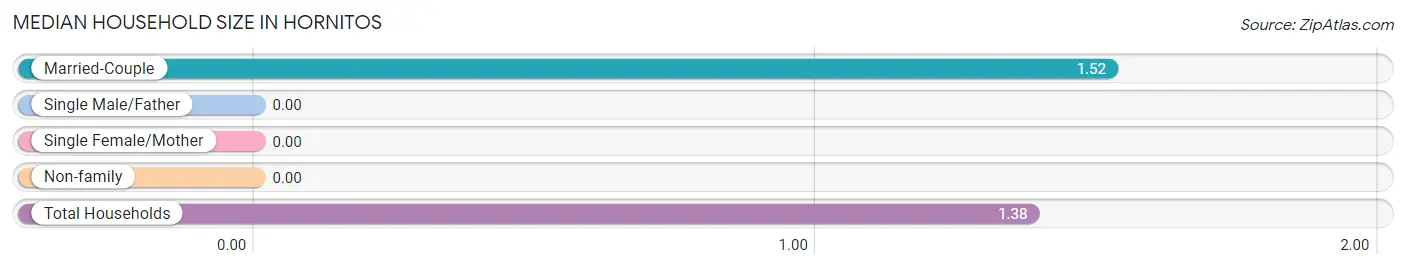
Median Household Size in Hornitos
Household Type
# Households
Household Size
Married-Couple
29 (74.4%)
1.52
Single Male/Father
0 (0.0%)
-
Single Female/Mother
0 (0.0%)
-
Non-family
10 (25.6%)
-
Total Households
39 (100.0%)
1.38
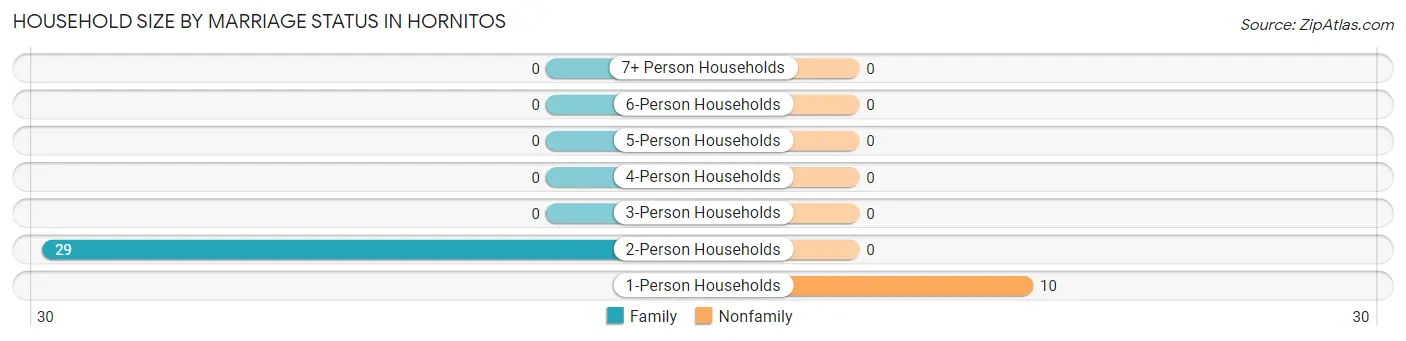
Household Size by Marriage Status in Hornitos
Out of a total of 39 households in Hornitos, 29 (74.4%) are family households, while 10 (25.6%) are nonfamily households. The most numerous type of family households are 2-person households, comprising 29, and the most common type of nonfamily households are 1-person households, comprising 10.
Household Size
Family Households
Nonfamily Households
1-Person Households
-
10 (25.6%)
2-Person Households
29 (74.4%)
0 (0.0%)
3-Person Households
0 (0.0%)
0 (0.0%)
4-Person Households
0 (0.0%)
0 (0.0%)
5-Person Households
0 (0.0%)
0 (0.0%)
6-Person Households
0 (0.0%)
0 (0.0%)
7+ Person Households
0 (0.0%)
0 (0.0%)
Total
29 (74.4%)
10 (25.6%)
Female Fertility in Hornitos
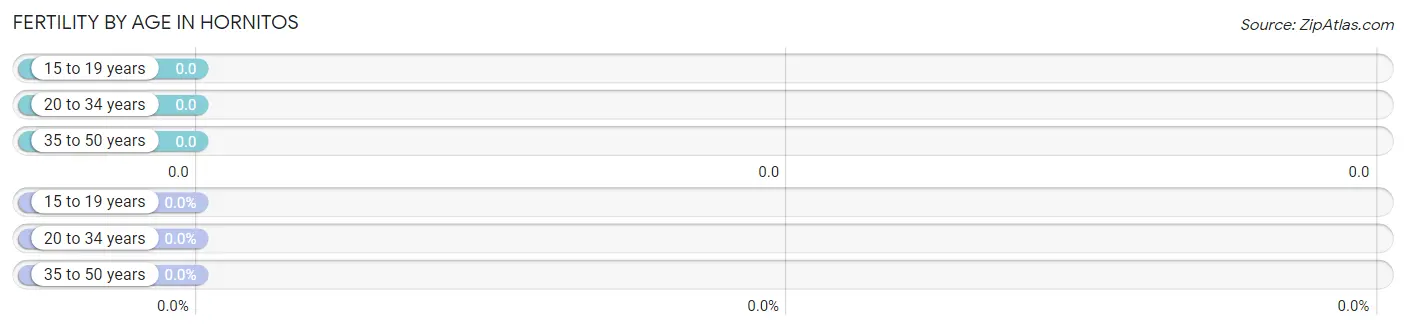
Fertility by Age in Hornitos
Age Bracket
Women with Births
Births / 1,000 Women
15 to 19 years
0 (0.0%)
0.0
20 to 34 years
0 (0.0%)
0.0
35 to 50 years
0 (0.0%)
0.0
Total
0 (0.0%)
0.0
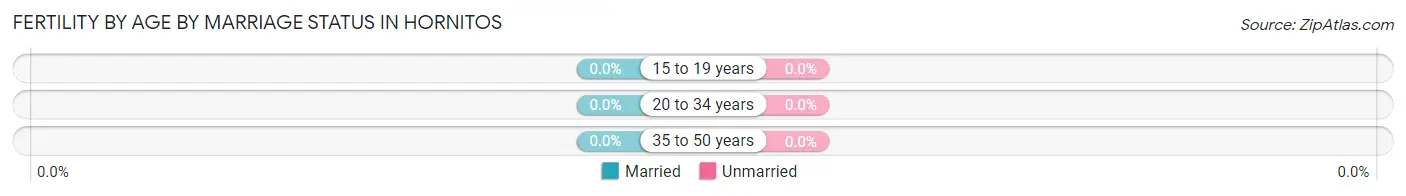
Fertility by Age by Marriage Status in Hornitos
Age Bracket
Married
Unmarried
15 to 19 years
0 (0.0%)
0 (0.0%)
20 to 34 years
0 (0.0%)
0 (0.0%)
35 to 50 years
0 (0.0%)
0 (0.0%)
Total
0 (0.0%)
0 (0.0%)
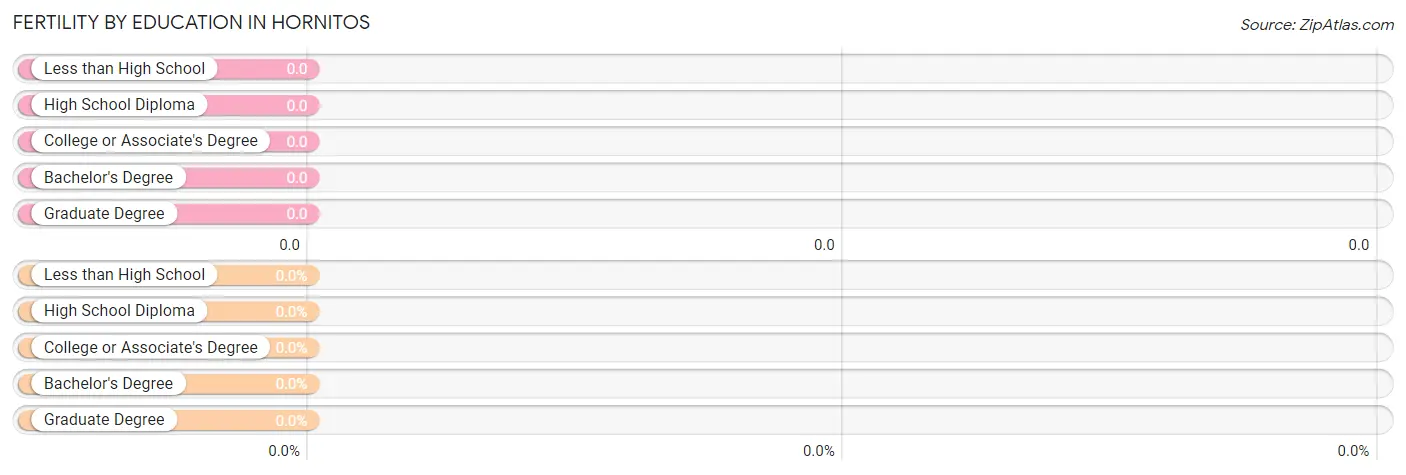
Fertility by Education in Hornitos
Educational Attainment
Women with Births
Births / 1,000 Women
Less than High School
0 (0.0%)
0.0
High School Diploma
0 (0.0%)
0.0
College or Associate's Degree
0 (0.0%)
0.0
Bachelor's Degree
0 (0.0%)
0.0
Graduate Degree
0 (0.0%)
0.0
Total
0 (0.0%)
0.0
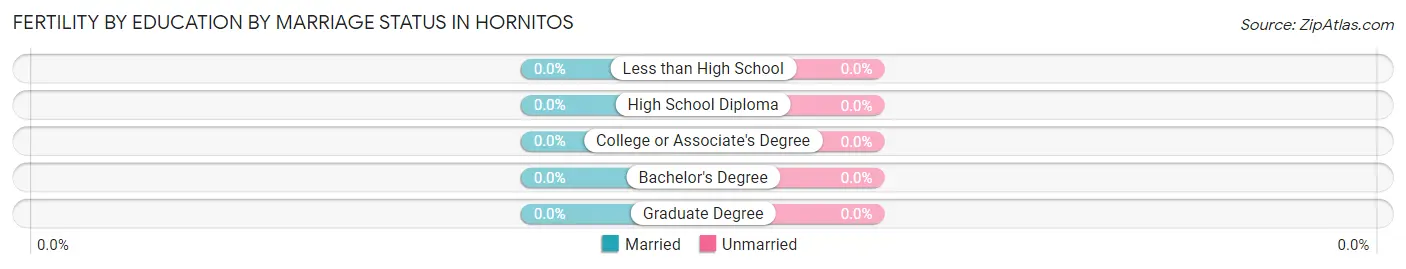
Fertility by Education by Marriage Status in Hornitos
Educational Attainment
Married
Unmarried
Less than High School
0 (0.0%)
0 (0.0%)
High School Diploma
0 (0.0%)
0 (0.0%)
College or Associate's Degree
0 (0.0%)
0 (0.0%)
Bachelor's Degree
0 (0.0%)
0 (0.0%)
Graduate Degree
0 (0.0%)
0 (0.0%)
Total
0 (0.0%)
0 (0.0%)
Employment Characteristics in Hornitos
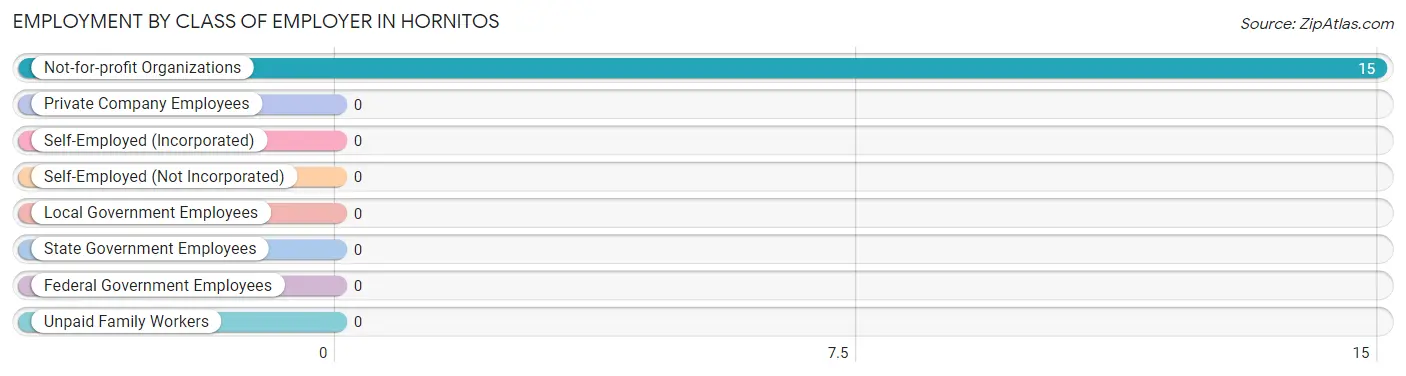
Employment by Class of Employer in Hornitos
Among the 15 employed individuals in Hornitos, , and not-for-profit organizations (15 | 100.0%) make up the most common classes of employment.
Employer Class
# Employees
% Employees
Private Company Employees
0
0.0%
Self-Employed (Incorporated)
0
0.0%
Self-Employed (Not Incorporated)
0
0.0%
Not-for-profit Organizations
15
100.0%
Local Government Employees
0
0.0%
State Government Employees
0
0.0%
Federal Government Employees
0
0.0%
Unpaid Family Workers
0
0.0%
Total
15
100.0%
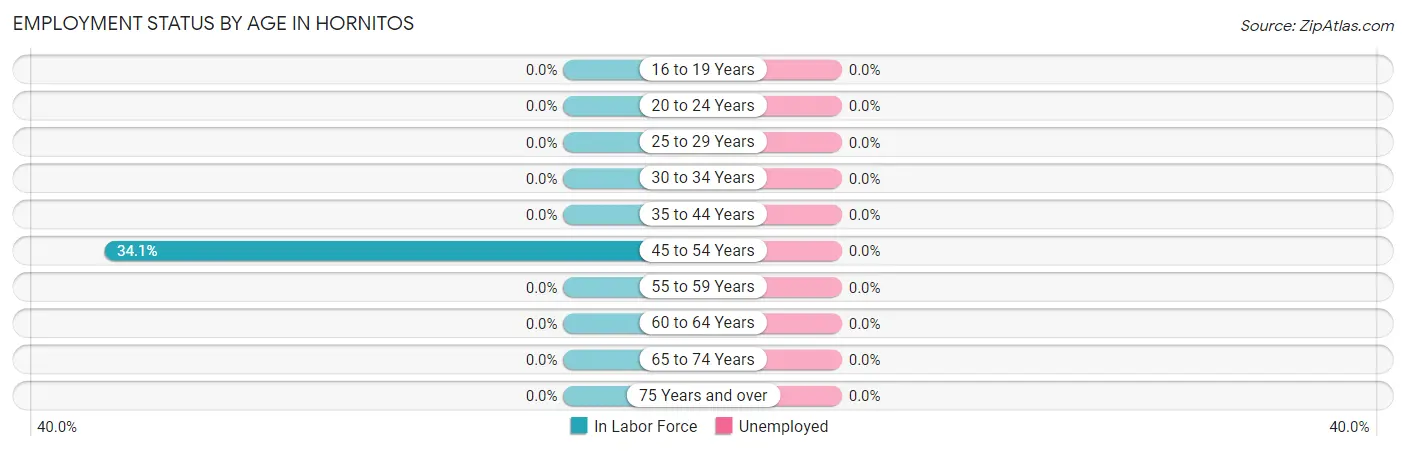
Employment Status by Age in Hornitos
Age Bracket
In Labor Force
Unemployed
16 to 19 Years
0 (0.0%)
0 (0.0%)
20 to 24 Years
0 (0.0%)
0 (0.0%)
25 to 29 Years
0 (0.0%)
0 (0.0%)
30 to 34 Years
0 (0.0%)
0 (0.0%)
35 to 44 Years
0 (0.0%)
0 (0.0%)
45 to 54 Years
15 (34.1%)
0 (0.0%)
55 to 59 Years
0 (0.0%)
0 (0.0%)
60 to 64 Years
0 (0.0%)
0 (0.0%)
65 to 74 Years
0 (0.0%)
0 (0.0%)
75 Years and over
0 (0.0%)
0 (0.0%)
Total
15 (27.8%)
0 (0.0%)
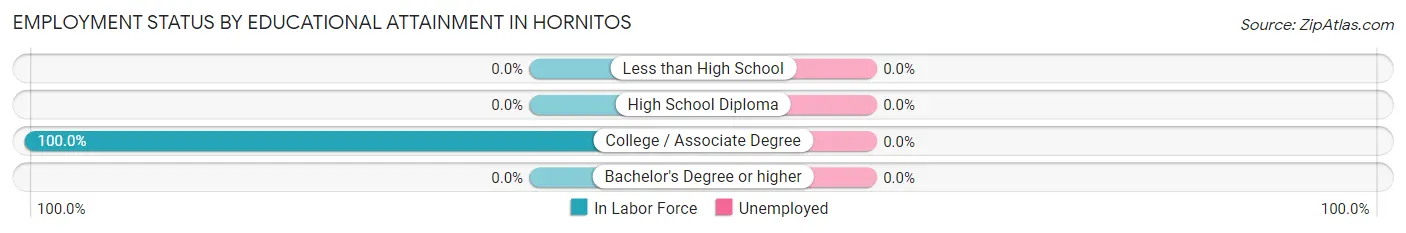
Employment Status by Educational Attainment in Hornitos
Educational Attainment
In Labor Force
Unemployed
Less than High School
0 (0.0%)
0 (0.0%)
High School Diploma
0 (0.0%)
0 (0.0%)
College / Associate Degree
15 (100.0%)
0 (0.0%)
Bachelor's Degree or higher
0 (0.0%)
0 (0.0%)
Total
15 (34.1%)
0 (0.0%)
Employment Occupations by Sex in Hornitos
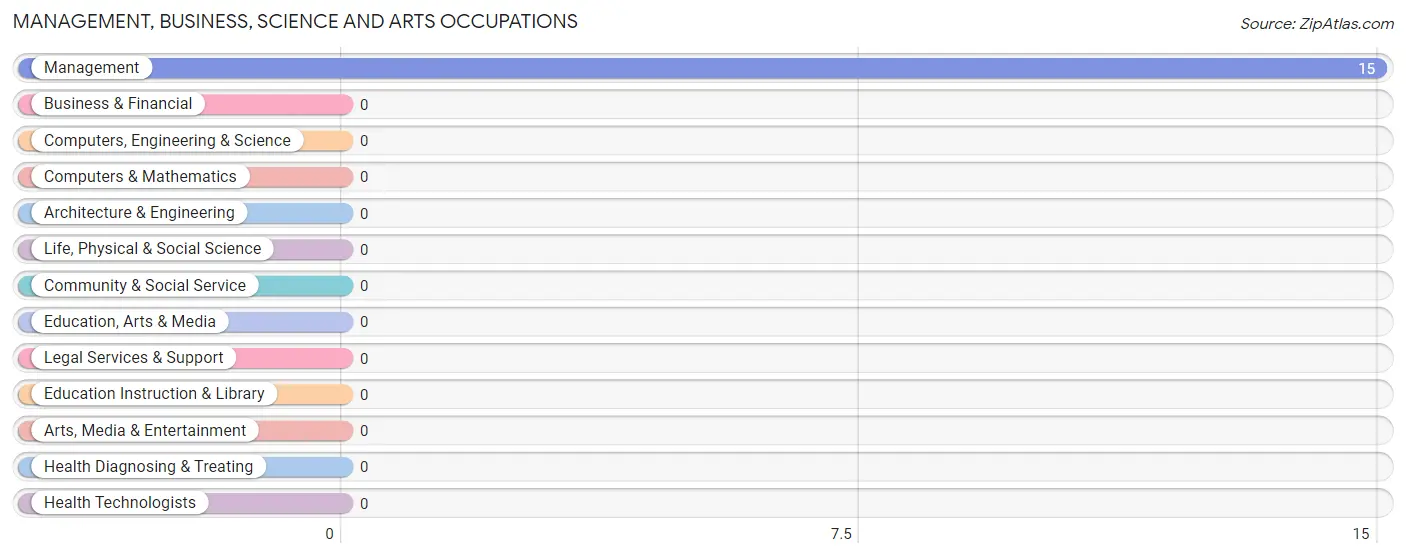
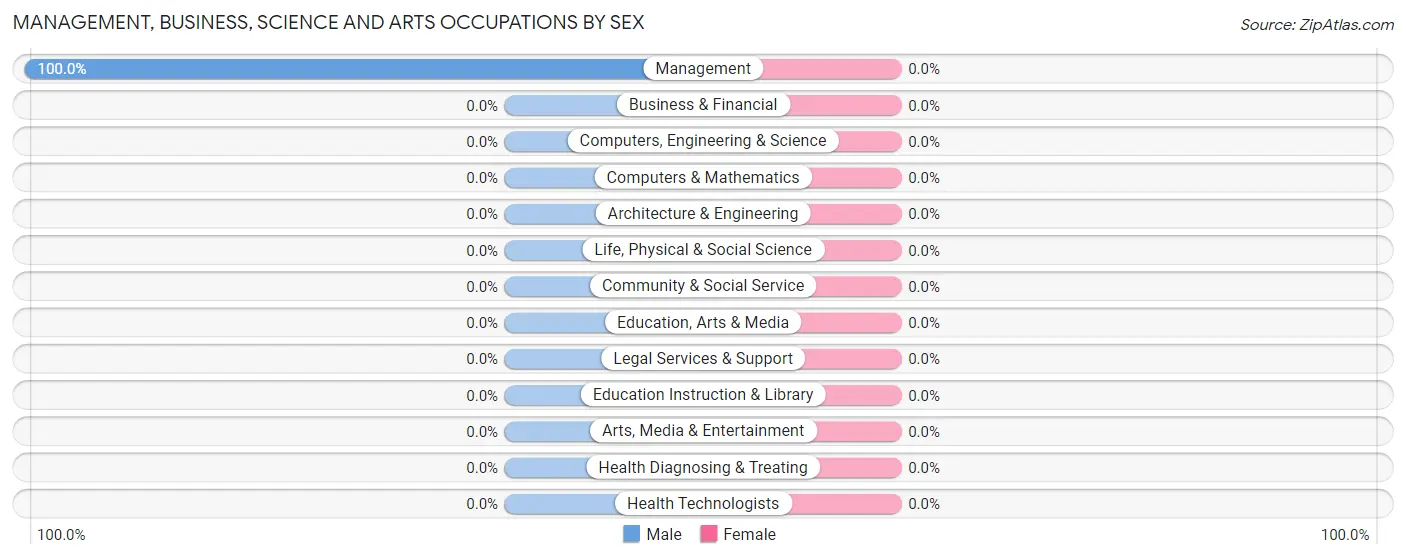
Management, Business, Science and Arts Occupations
The most common Management, Business, Science and Arts occupations in Hornitos are , and Management (15 | 100.0%).
Management, Business, Science and Arts Occupations by Sex
Occupation
Male
Female
Management
15 (100.0%)
0 (0.0%)
Business & Financial
0 (0.0%)
0 (0.0%)
Computers, Engineering & Science
0 (0.0%)
0 (0.0%)
Computers & Mathematics
0 (0.0%)
0 (0.0%)
Architecture & Engineering
0 (0.0%)
0 (0.0%)
Life, Physical & Social Science
0 (0.0%)
0 (0.0%)
Community & Social Service
0 (0.0%)
0 (0.0%)
Education, Arts & Media
0 (0.0%)
0 (0.0%)
Legal Services & Support
0 (0.0%)
0 (0.0%)
Education Instruction & Library
0 (0.0%)
0 (0.0%)
Arts, Media & Entertainment
0 (0.0%)
0 (0.0%)
Health Diagnosing & Treating
0 (0.0%)
0 (0.0%)
Health Technologists
0 (0.0%)
0 (0.0%)
Total (Category)
15 (100.0%)
0 (0.0%)
Total (Overall)
15 (100.0%)
0 (0.0%)
Services Occupations
Services Occupations by Sex
Occupation
Male
Female
Healthcare Support
0 (0.0%)
0 (0.0%)
Security & Protection
0 (0.0%)
0 (0.0%)
Firefighting & Prevention
0 (0.0%)
0 (0.0%)
Law Enforcement
0 (0.0%)
0 (0.0%)
Food Preparation & Serving
0 (0.0%)
0 (0.0%)
Cleaning & Maintenance
0 (0.0%)
0 (0.0%)
Personal Care & Service
0 (0.0%)
0 (0.0%)
Total (Category)
0 (0.0%)
0 (0.0%)
Total (Overall)
15 (100.0%)
0 (0.0%)
Sales and Office Occupations
Sales and Office Occupations by Sex
Occupation
Male
Female
Sales & Related
0 (0.0%)
0 (0.0%)
Office & Administration
0 (0.0%)
0 (0.0%)
Total (Category)
0 (0.0%)
0 (0.0%)
Total (Overall)
15 (100.0%)
0 (0.0%)
Natural Resources, Construction and Maintenance Occupations
Natural Resources, Construction and Maintenance Occupations by Sex
Occupation
Male
Female
Farming, Fishing & Forestry
0 (0.0%)
0 (0.0%)
Construction & Extraction
0 (0.0%)
0 (0.0%)
Installation, Maintenance & Repair
0 (0.0%)
0 (0.0%)
Total (Category)
0 (0.0%)
0 (0.0%)
Total (Overall)
15 (100.0%)
0 (0.0%)
Production, Transportation and Moving Occupations
Production, Transportation and Moving Occupations by Sex
Occupation
Male
Female
Production
0 (0.0%)
0 (0.0%)
Transportation
0 (0.0%)
0 (0.0%)
Material Moving
0 (0.0%)
0 (0.0%)
Total (Category)
0 (0.0%)
0 (0.0%)
Total (Overall)
15 (100.0%)
0 (0.0%)
Employment Industries by Sex in Hornitos
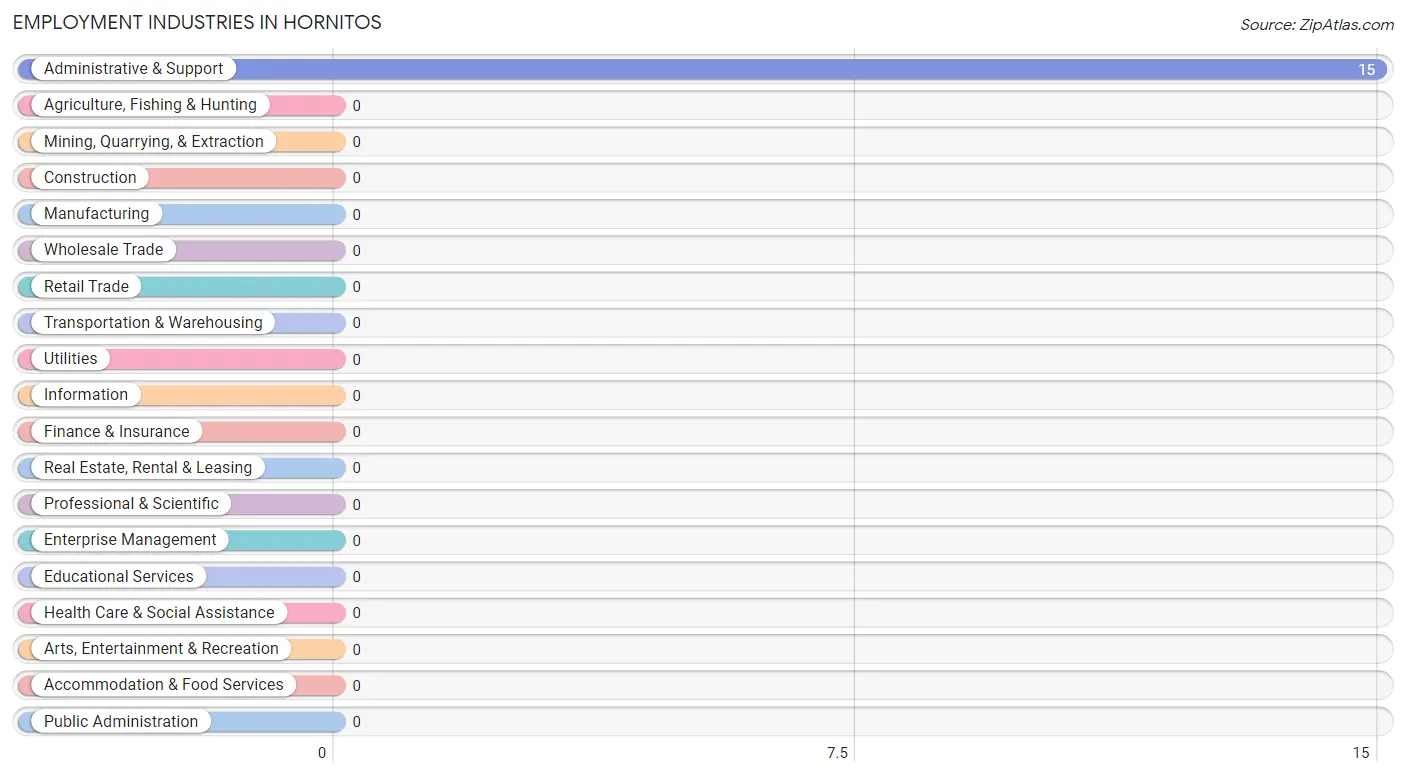
Employment Industries in Hornitos
The major employment industries in Hornitos include , and Administrative & Support (15 | 100.0%).
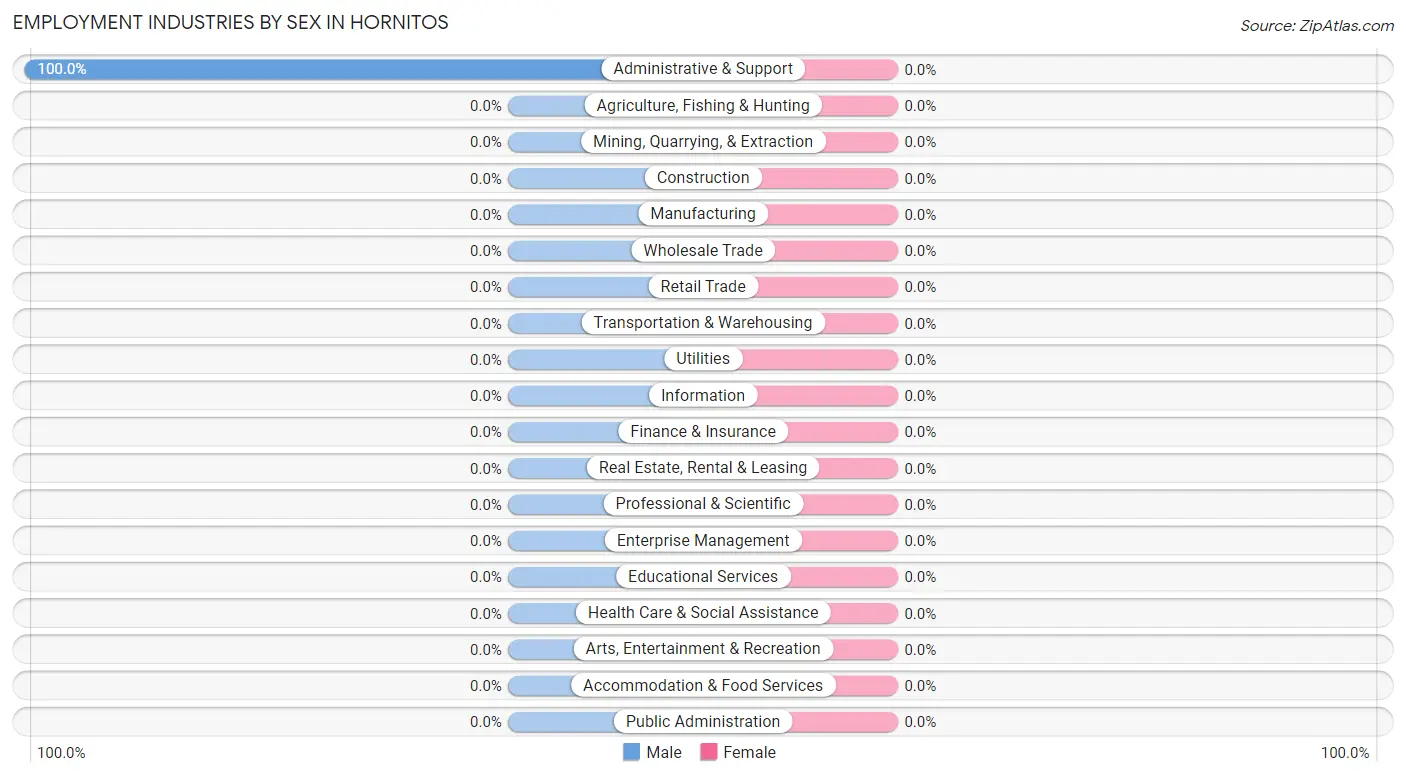
Employment Industries by Sex in Hornitos
Industry
Male
Female
Agriculture, Fishing & Hunting
0 (0.0%)
0 (0.0%)
Mining, Quarrying, & Extraction
0 (0.0%)
0 (0.0%)
Construction
0 (0.0%)
0 (0.0%)
Manufacturing
0 (0.0%)
0 (0.0%)
Wholesale Trade
0 (0.0%)
0 (0.0%)
Retail Trade
0 (0.0%)
0 (0.0%)
Transportation & Warehousing
0 (0.0%)
0 (0.0%)
Utilities
0 (0.0%)
0 (0.0%)
Information
0 (0.0%)
0 (0.0%)
Finance & Insurance
0 (0.0%)
0 (0.0%)
Real Estate, Rental & Leasing
0 (0.0%)
0 (0.0%)
Professional & Scientific
0 (0.0%)
0 (0.0%)
Enterprise Management
0 (0.0%)
0 (0.0%)
Administrative & Support
15 (100.0%)
0 (0.0%)
Educational Services
0 (0.0%)
0 (0.0%)
Health Care & Social Assistance
0 (0.0%)
0 (0.0%)
Arts, Entertainment & Recreation
0 (0.0%)
0 (0.0%)
Accommodation & Food Services
0 (0.0%)
0 (0.0%)
Public Administration
0 (0.0%)
0 (0.0%)
Total
15 (100.0%)
0 (0.0%)
Education in Hornitos
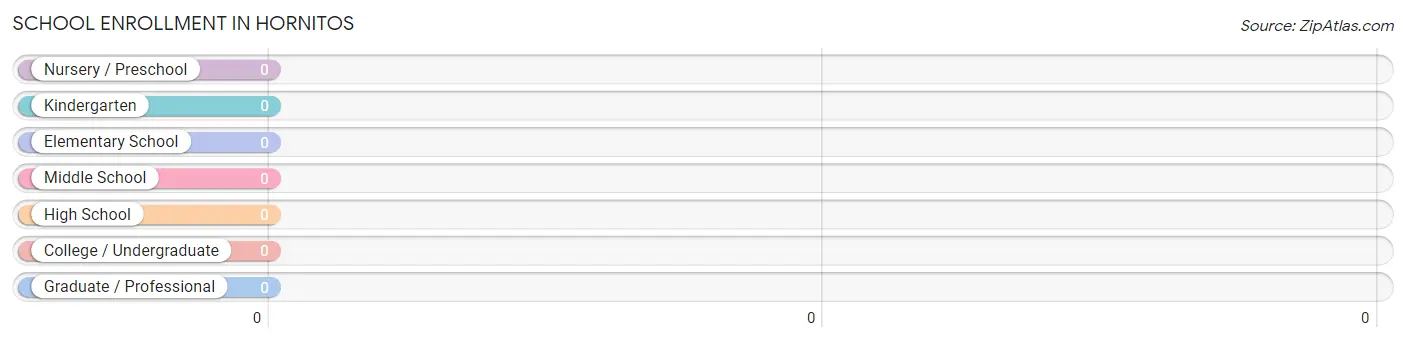
School Enrollment in Hornitos
School Level
# Students
% Students
Nursery / Preschool
0
0.0%
Kindergarten
0
0.0%
Elementary School
0
0.0%
Middle School
0
0.0%
High School
0
0.0%
College / Undergraduate
0
0.0%
Graduate / Professional
0
0.0%
Total
0
0.0%
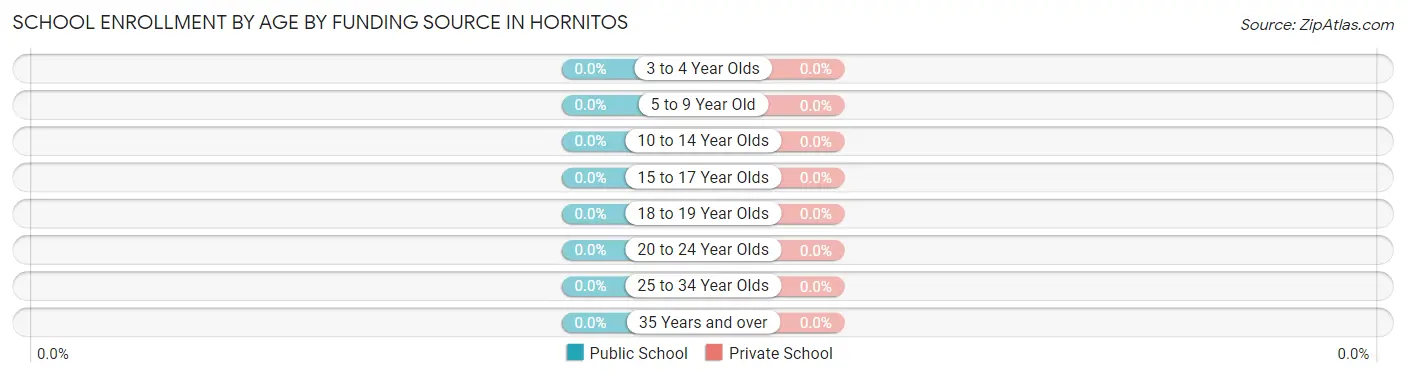
School Enrollment by Age by Funding Source in Hornitos
Age Bracket
Public School
Private School
3 to 4 Year Olds
0 (0.0%)
0 (0.0%)
5 to 9 Year Old
0 (0.0%)
0 (0.0%)
10 to 14 Year Olds
0 (0.0%)
0 (0.0%)
15 to 17 Year Olds
0 (0.0%)
0 (0.0%)
18 to 19 Year Olds
0 (0.0%)
0 (0.0%)
20 to 24 Year Olds
0 (0.0%)
0 (0.0%)
25 to 34 Year Olds
0 (0.0%)
0 (0.0%)
35 Years and over
0 (0.0%)
0 (0.0%)
Total
0 (0.0%)
0 (0.0%)
Educational Attainment by Field of Study in Hornitos
Field of Study
# Graduates
% Graduates
Computers & Mathematics
0
0.0%
Bio, Nature & Agricultural
0
0.0%
Physical & Health Sciences
0
0.0%
Psychology
0
0.0%
Social Sciences
0
0.0%
Engineering
0
0.0%
Multidisciplinary Studies
0
0.0%
Science & Technology
0
0.0%
Business
0
0.0%
Education
0
0.0%
Literature & Languages
0
0.0%
Liberal Arts & History
0
0.0%
Visual & Performing Arts
0
0.0%
Communications
0
0.0%
Arts & Humanities
0
0.0%
Total
0
0.0%
Transportation & Commute in Hornitos
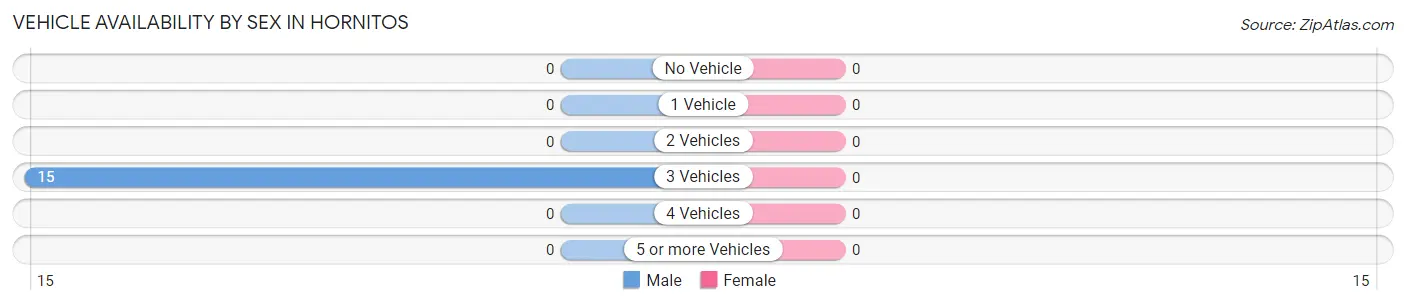
Vehicle Availability by Sex in Hornitos
Vehicles Available
Male
Female
No Vehicle
0 (0.0%)
0 (0.0%)
1 Vehicle
0 (0.0%)
0 (0.0%)
2 Vehicles
0 (0.0%)
0 (0.0%)
3 Vehicles
15 (100.0%)
0 (0.0%)
4 Vehicles
0 (0.0%)
0 (0.0%)
5 or more Vehicles
0 (0.0%)
0 (0.0%)
Total
15 (100.0%)
0 (0.0%)
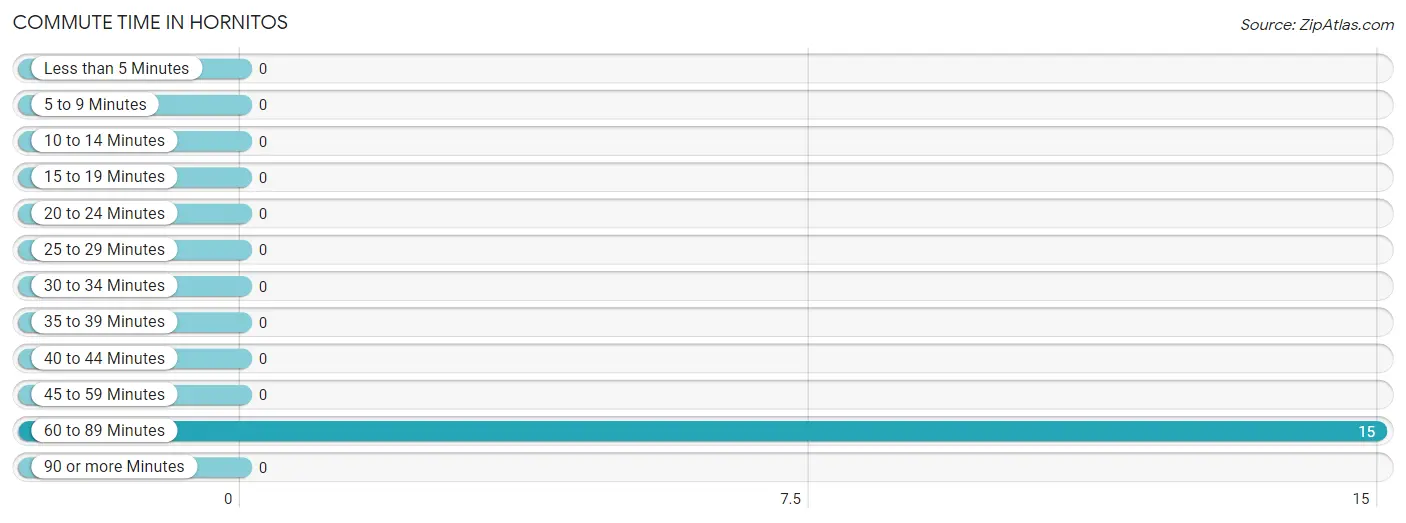
Commute Time in Hornitos
The most frequently occuring commute durations in Hornitos are 60 to 89 minutes (15 commuters, 100.0%), less than 5 minutes (0 commuters, 0.0%), and 5 to 9 minutes (0 commuters, 0.0%).
Commute Time
# Commuters
% Commuters
Less than 5 Minutes
0
0.0%
5 to 9 Minutes
0
0.0%
10 to 14 Minutes
0
0.0%
15 to 19 Minutes
0
0.0%
20 to 24 Minutes
0
0.0%
25 to 29 Minutes
0
0.0%
30 to 34 Minutes
0
0.0%
35 to 39 Minutes
0
0.0%
40 to 44 Minutes
0
0.0%
45 to 59 Minutes
0
0.0%
60 to 89 Minutes
15
100.0%
90 or more Minutes
0
0.0%
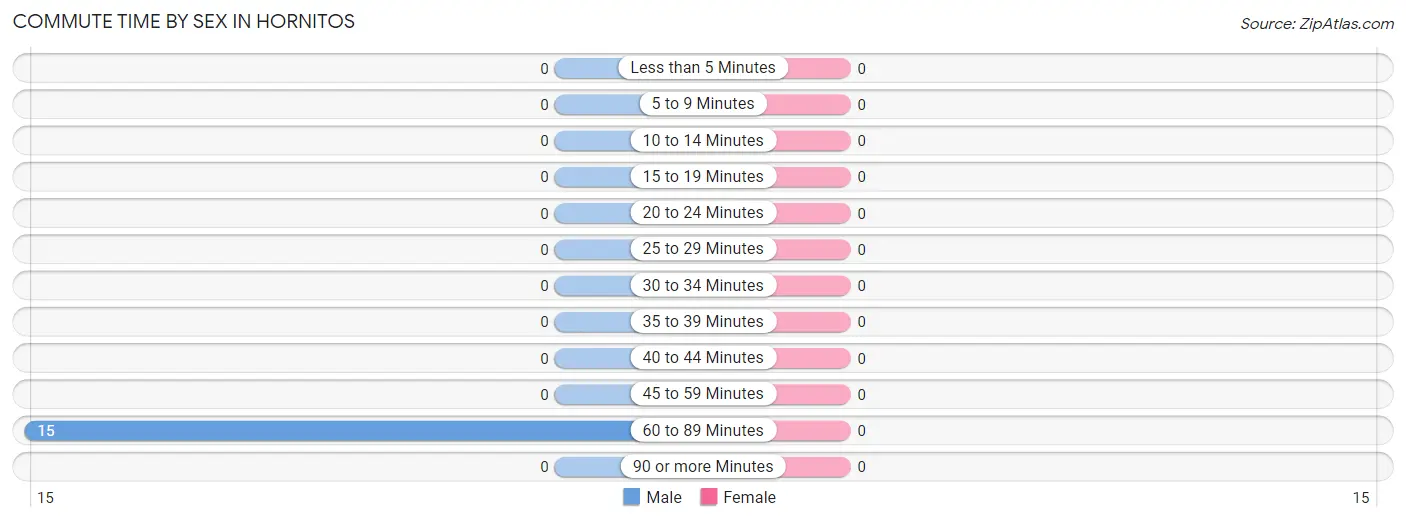
Commute Time by Sex in Hornitos
Commute Time
Male
Female
Less than 5 Minutes
0 (0.0%)
0 (0.0%)
5 to 9 Minutes
0 (0.0%)
0 (0.0%)
10 to 14 Minutes
0 (0.0%)
0 (0.0%)
15 to 19 Minutes
0 (0.0%)
0 (0.0%)
20 to 24 Minutes
0 (0.0%)
0 (0.0%)
25 to 29 Minutes
0 (0.0%)
0 (0.0%)
30 to 34 Minutes
0 (0.0%)
0 (0.0%)
35 to 39 Minutes
0 (0.0%)
0 (0.0%)
40 to 44 Minutes
0 (0.0%)
0 (0.0%)
45 to 59 Minutes
0 (0.0%)
0 (0.0%)
60 to 89 Minutes
15 (100.0%)
0 (0.0%)
90 or more Minutes
0 (0.0%)
0 (0.0%)
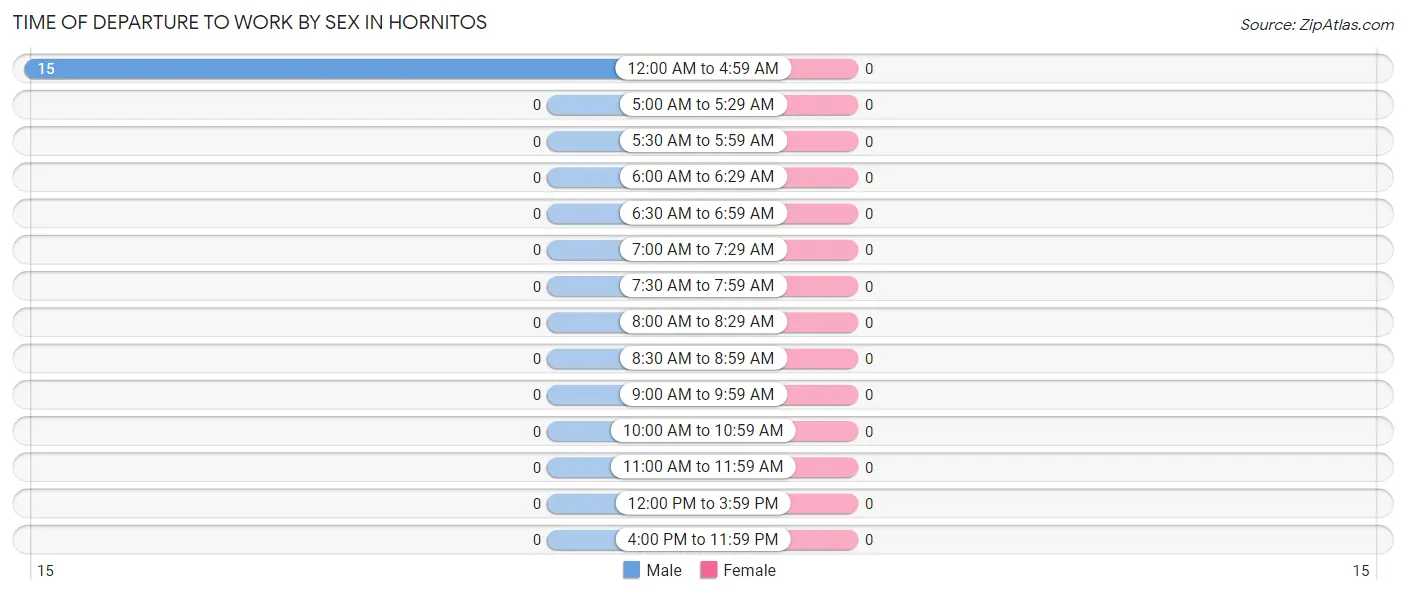
Time of Departure to Work by Sex in Hornitos
Time of Departure
Male
Female
12:00 AM to 4:59 AM
15 (100.0%)
0 (0.0%)
5:00 AM to 5:29 AM
0 (0.0%)
0 (0.0%)
5:30 AM to 5:59 AM
0 (0.0%)
0 (0.0%)
6:00 AM to 6:29 AM
0 (0.0%)
0 (0.0%)
6:30 AM to 6:59 AM
0 (0.0%)
0 (0.0%)
7:00 AM to 7:29 AM
0 (0.0%)
0 (0.0%)
7:30 AM to 7:59 AM
0 (0.0%)
0 (0.0%)
8:00 AM to 8:29 AM
0 (0.0%)
0 (0.0%)
8:30 AM to 8:59 AM
0 (0.0%)
0 (0.0%)
9:00 AM to 9:59 AM
0 (0.0%)
0 (0.0%)
10:00 AM to 10:59 AM
0 (0.0%)
0 (0.0%)
11:00 AM to 11:59 AM
0 (0.0%)
0 (0.0%)
12:00 PM to 3:59 PM
0 (0.0%)
0 (0.0%)
4:00 PM to 11:59 PM
0 (0.0%)
0 (0.0%)
Total
15 (100.0%)
0 (0.0%)
Housing Occupancy in Hornitos
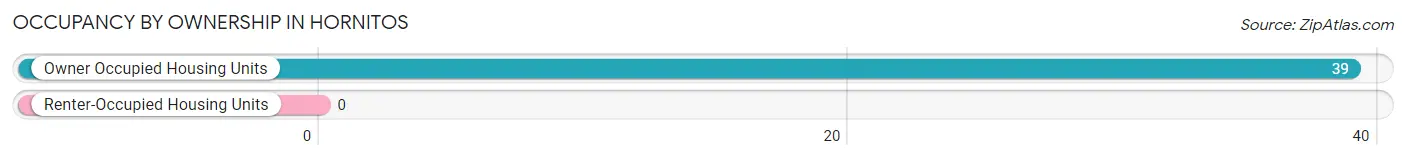
Occupancy by Ownership in Hornitos
Of the total 39 dwellings in Hornitos, owner-occupied units account for 39 (100.0%), while renter-occupied units make up 0 (0.0%).
Occupancy
# Housing Units
% Housing Units
Owner Occupied Housing Units
39
100.0%
Renter-Occupied Housing Units
0
0.0%
Total Occupied Housing Units
39
100.0%
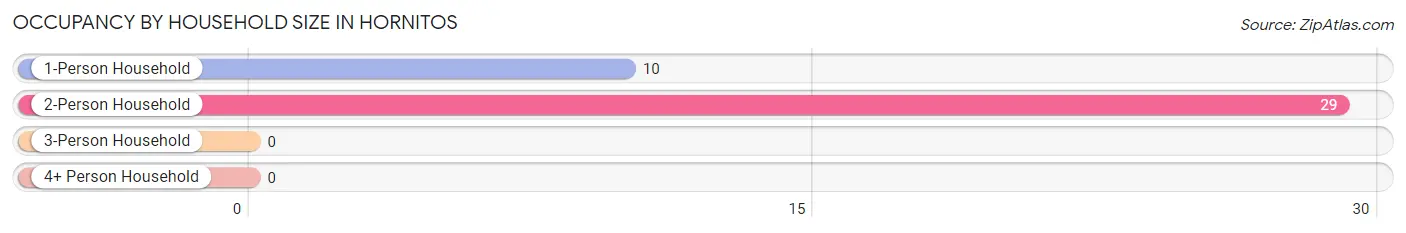
Occupancy by Household Size in Hornitos
Household Size
# Housing Units
% Housing Units
1-Person Household
10
25.6%
2-Person Household
29
74.4%
3-Person Household
0
0.0%
4+ Person Household
0
0.0%
Total Housing Units
39
100.0%
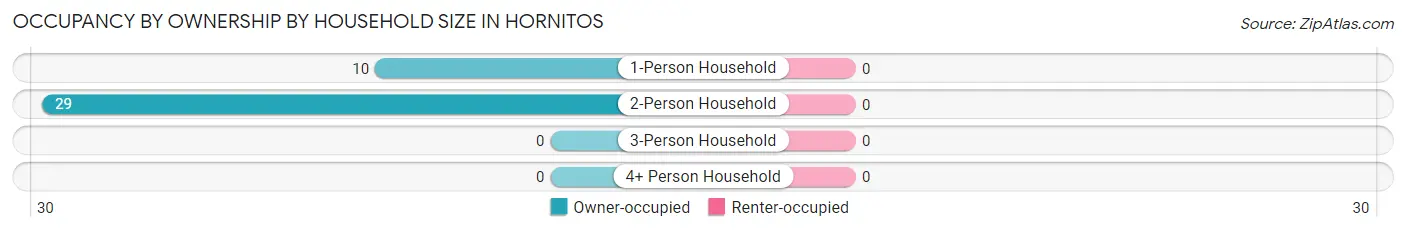
Occupancy by Ownership by Household Size in Hornitos
Household Size
Owner-occupied
Renter-occupied
1-Person Household
10 (100.0%)
0 (0.0%)
2-Person Household
29 (100.0%)
0 (0.0%)
3-Person Household
0 (0.0%)
0 (0.0%)
4+ Person Household
0 (0.0%)
0 (0.0%)
Total Housing Units
39 (100.0%)
0 (0.0%)
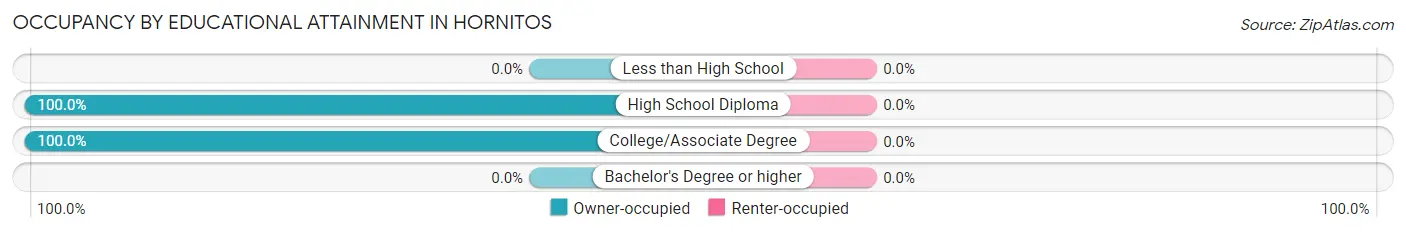
Occupancy by Educational Attainment in Hornitos
Household Size
Owner-occupied
Renter-occupied
Less than High School
0 (0.0%)
0 (0.0%)
High School Diploma
29 (100.0%)
0 (0.0%)
College/Associate Degree
10 (100.0%)
0 (0.0%)
Bachelor's Degree or higher
0 (0.0%)
0 (0.0%)
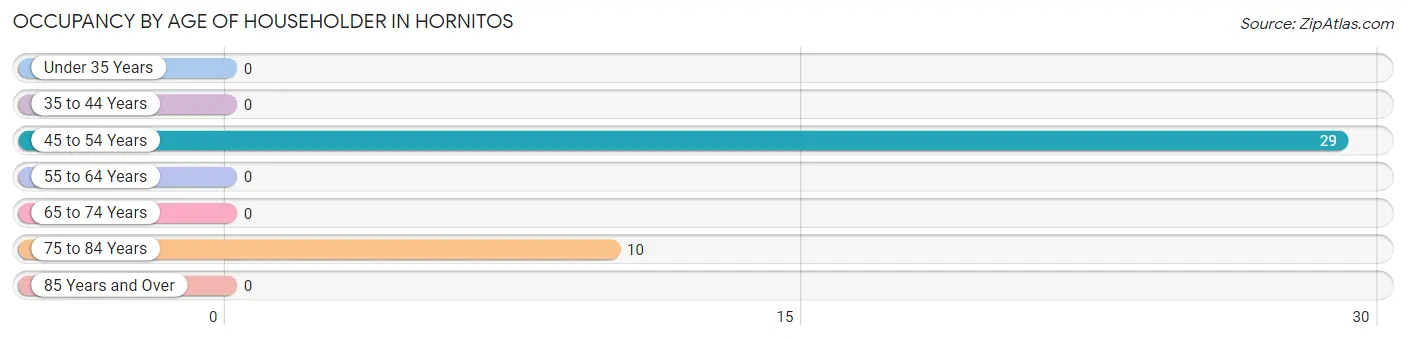
Occupancy by Age of Householder in Hornitos
Age Bracket
# Households
% Households
Under 35 Years
0
0.0%
35 to 44 Years
0
0.0%
45 to 54 Years
29
74.4%
55 to 64 Years
0
0.0%
65 to 74 Years
0
0.0%
75 to 84 Years
10
25.6%
85 Years and Over
0
0.0%
Total
39
100.0%
Housing Finances in Hornitos
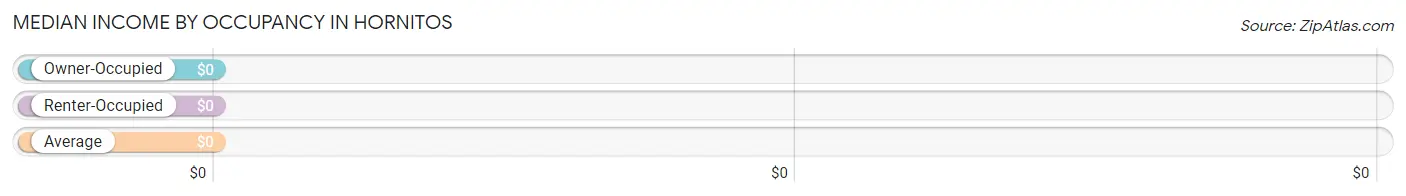
Median Income by Occupancy in Hornitos
Occupancy Type
# Households
Median Income
Owner-Occupied
39 (100.0%)
$0
Renter-Occupied
0 (0.0%)
$0
Average
39 (100.0%)
$0
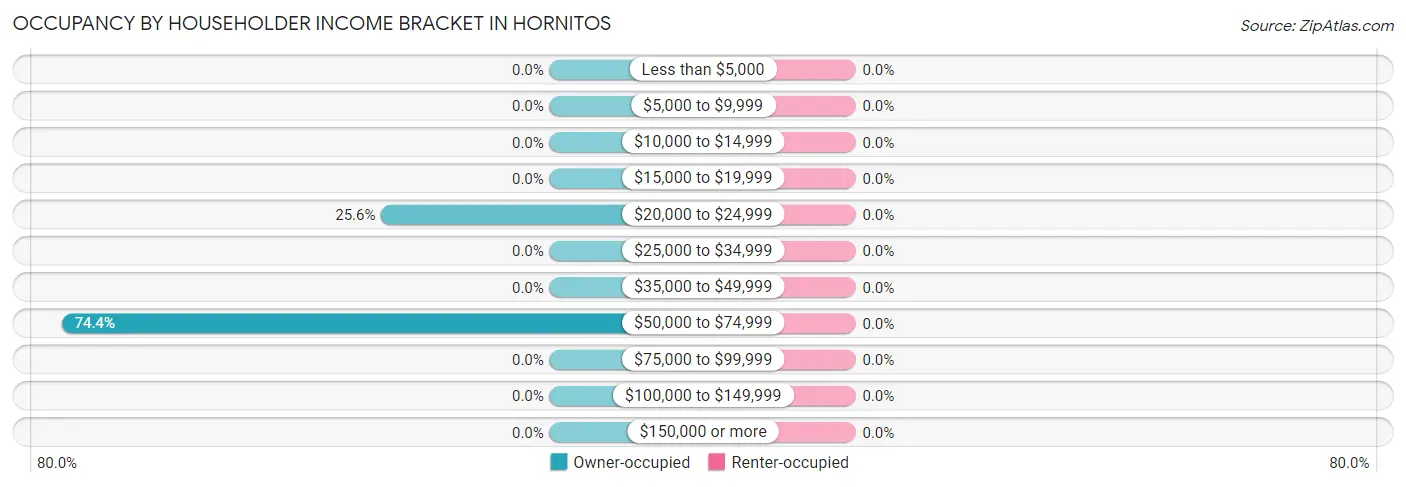
Occupancy by Householder Income Bracket in Hornitos
Income Bracket
Owner-occupied
Renter-occupied
Less than $5,000
0 (0.0%)
0 (0.0%)
$5,000 to $9,999
0 (0.0%)
0 (0.0%)
$10,000 to $14,999
0 (0.0%)
0 (0.0%)
$15,000 to $19,999
0 (0.0%)
0 (0.0%)
$20,000 to $24,999
10 (25.6%)
0 (0.0%)
$25,000 to $34,999
0 (0.0%)
0 (0.0%)
$35,000 to $49,999
0 (0.0%)
0 (0.0%)
$50,000 to $74,999
29 (74.4%)
0 (0.0%)
$75,000 to $99,999
0 (0.0%)
0 (0.0%)
$100,000 to $149,999
0 (0.0%)
0 (0.0%)
$150,000 or more
0 (0.0%)
0 (0.0%)
Total
39 (100.0%)
0 (0.0%)
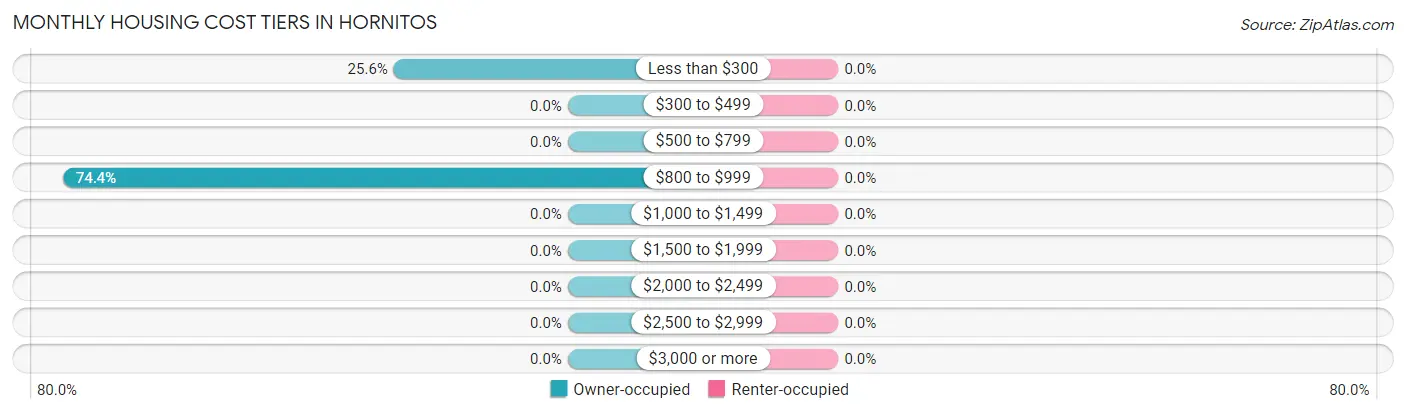
Monthly Housing Cost Tiers in Hornitos
Monthly Cost
Owner-occupied
Renter-occupied
Less than $300
10 (25.6%)
0 (0.0%)
$300 to $499
0 (0.0%)
0 (0.0%)
$500 to $799
0 (0.0%)
0 (0.0%)
$800 to $999
29 (74.4%)
0 (0.0%)
$1,000 to $1,499
0 (0.0%)
0 (0.0%)
$1,500 to $1,999
0 (0.0%)
0 (0.0%)
$2,000 to $2,499
0 (0.0%)
0 (0.0%)
$2,500 to $2,999
0 (0.0%)
0 (0.0%)
$3,000 or more
0 (0.0%)
0 (0.0%)
Total
39 (100.0%)
0 (0.0%)
Physical Housing Characteristics in Hornitos
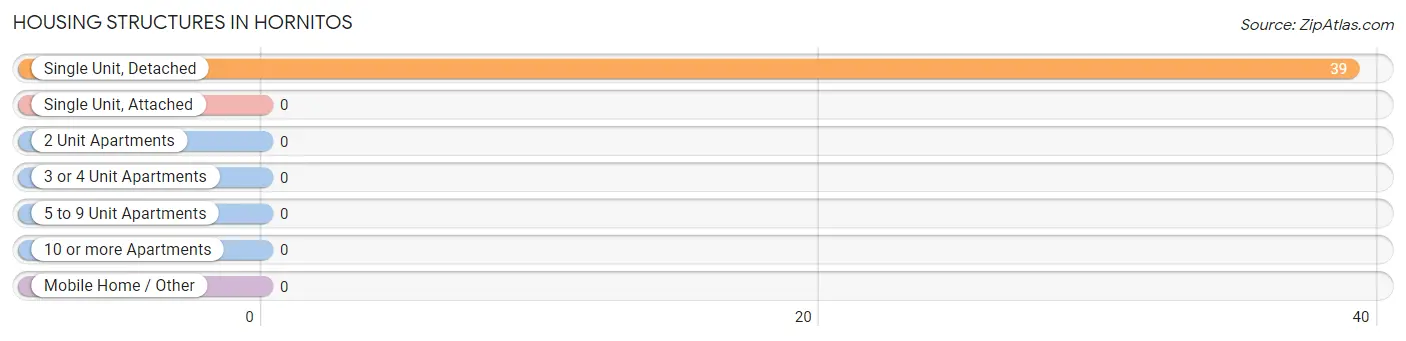
Housing Structures in Hornitos
Structure Type
# Housing Units
% Housing Units
Single Unit, Detached
39
100.0%
Single Unit, Attached
0
0.0%
2 Unit Apartments
0
0.0%
3 or 4 Unit Apartments
0
0.0%
5 to 9 Unit Apartments
0
0.0%
10 or more Apartments
0
0.0%
Mobile Home / Other
0
0.0%
Total
39
100.0%
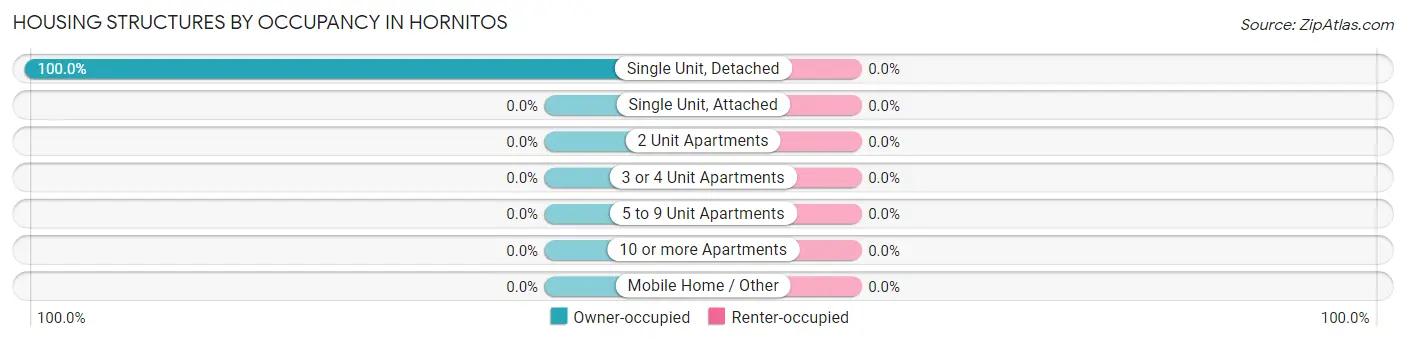
Housing Structures by Occupancy in Hornitos
Structure Type
Owner-occupied
Renter-occupied
Single Unit, Detached
39 (100.0%)
0 (0.0%)
Single Unit, Attached
0 (0.0%)
0 (0.0%)
2 Unit Apartments
0 (0.0%)
0 (0.0%)
3 or 4 Unit Apartments
0 (0.0%)
0 (0.0%)
5 to 9 Unit Apartments
0 (0.0%)
0 (0.0%)
10 or more Apartments
0 (0.0%)
0 (0.0%)
Mobile Home / Other
0 (0.0%)
0 (0.0%)
Total
39 (100.0%)
0 (0.0%)
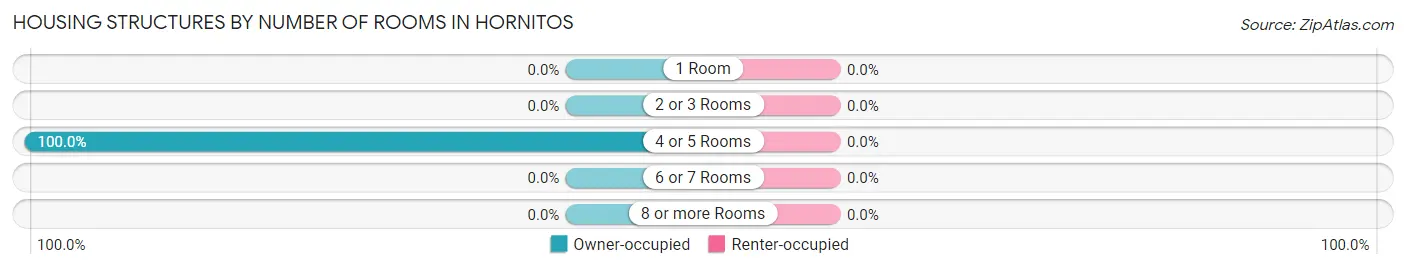
Housing Structures by Number of Rooms in Hornitos
Number of Rooms
Owner-occupied
Renter-occupied
1 Room
0 (0.0%)
0 (0.0%)
2 or 3 Rooms
0 (0.0%)
0 (0.0%)
4 or 5 Rooms
39 (100.0%)
0 (0.0%)
6 or 7 Rooms
0 (0.0%)
0 (0.0%)
8 or more Rooms
0 (0.0%)
0 (0.0%)
Total
39 (100.0%)
0 (0.0%)
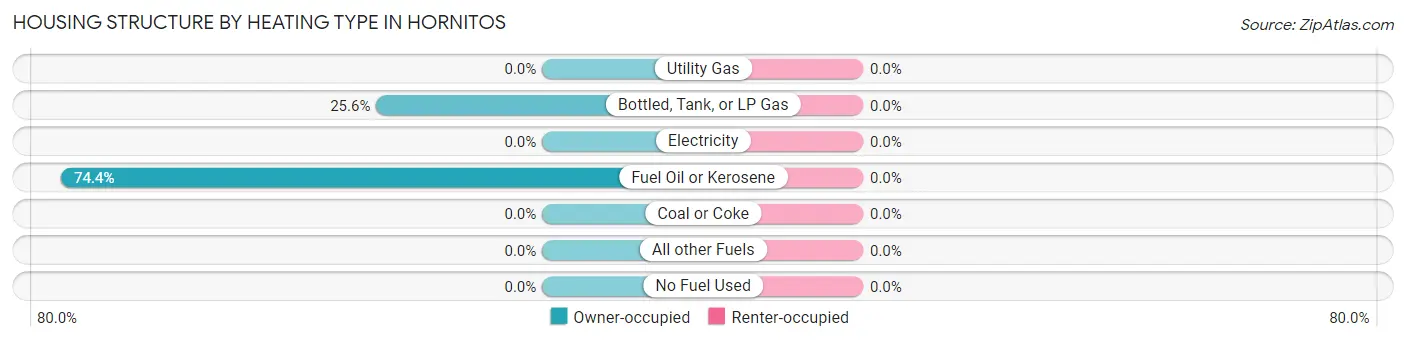
Housing Structure by Heating Type in Hornitos
Heating Type
Owner-occupied
Renter-occupied
Utility Gas
0 (0.0%)
0 (0.0%)
Bottled, Tank, or LP Gas
10 (25.6%)
0 (0.0%)
Electricity
0 (0.0%)
0 (0.0%)
Fuel Oil or Kerosene
29 (74.4%)
0 (0.0%)
Coal or Coke
0 (0.0%)
0 (0.0%)
All other Fuels
0 (0.0%)
0 (0.0%)
No Fuel Used
0 (0.0%)
0 (0.0%)
Total
39 (100.0%)
0 (0.0%)
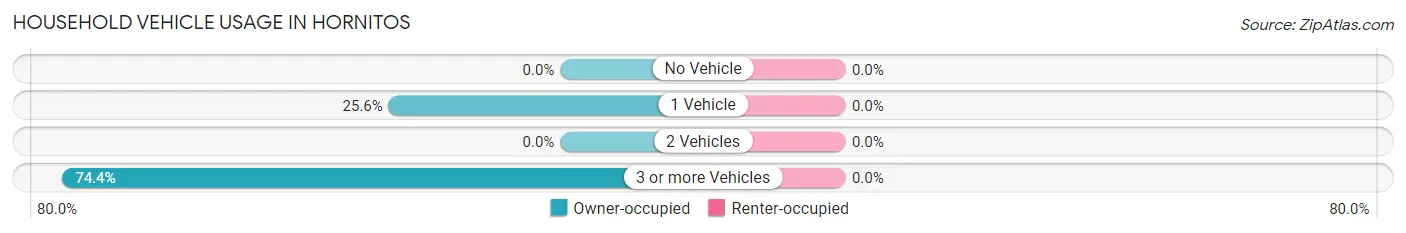
Household Vehicle Usage in Hornitos
Vehicles per Household
Owner-occupied
Renter-occupied
No Vehicle
0 (0.0%)
0 (0.0%)
1 Vehicle
10 (25.6%)
0 (0.0%)
2 Vehicles
0 (0.0%)
0 (0.0%)
3 or more Vehicles
29 (74.4%)
0 (0.0%)
Total
39 (100.0%)
0 (0.0%)
Real Estate & Mortgages in Hornitos
Real Estate and Mortgage Overview in Hornitos
Characteristic
Without Mortgage
With Mortgage
Housing Units
10
29
Median Property Value
-
-
Median Household Income
-
-
Monthly Housing Costs
-
-
Real Estate Taxes
-
-
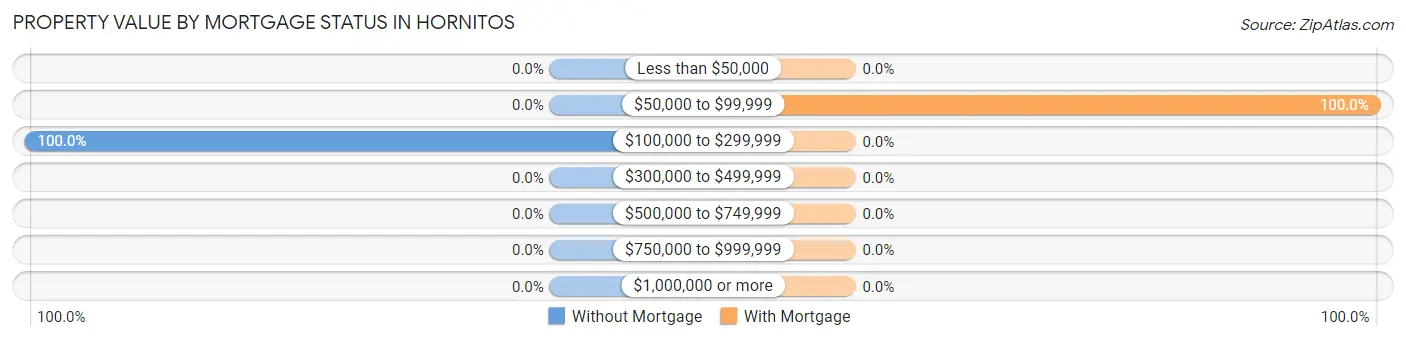
Property Value by Mortgage Status in Hornitos
Property Value
Without Mortgage
With Mortgage
Less than $50,000
0 (0.0%)
0 (0.0%)
$50,000 to $99,999
0 (0.0%)
29 (100.0%)
$100,000 to $299,999
10 (100.0%)
0 (0.0%)
$300,000 to $499,999
0 (0.0%)
0 (0.0%)
$500,000 to $749,999
0 (0.0%)
0 (0.0%)
$750,000 to $999,999
0 (0.0%)
0 (0.0%)
$1,000,000 or more
0 (0.0%)
0 (0.0%)
Total
10 (100.0%)
29 (100.0%)
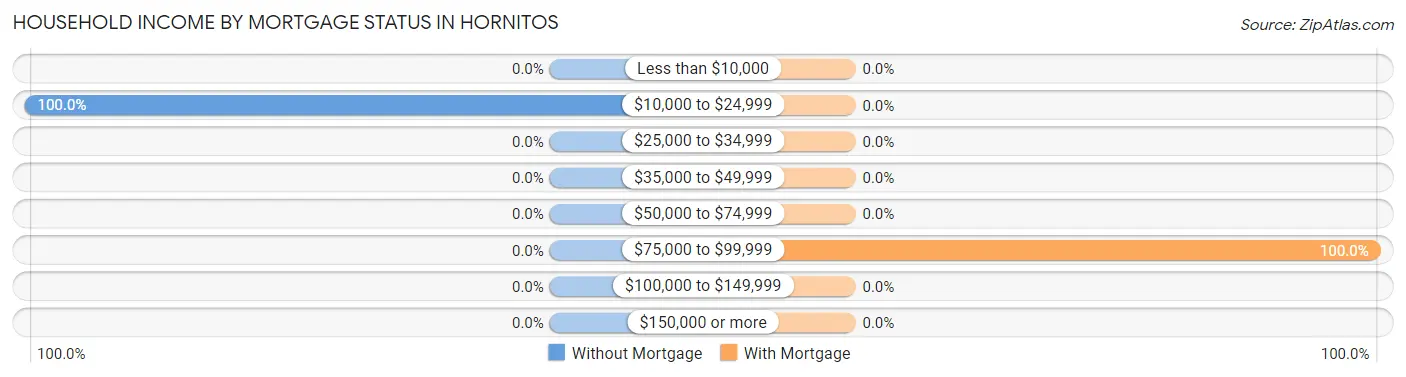
Household Income by Mortgage Status in Hornitos
Household Income
Without Mortgage
With Mortgage
Less than $10,000
0 (0.0%)
0 (0.0%)
$10,000 to $24,999
10 (100.0%)
0 (0.0%)
$25,000 to $34,999
0 (0.0%)
0 (0.0%)
$35,000 to $49,999
0 (0.0%)
0 (0.0%)
$50,000 to $74,999
0 (0.0%)
0 (0.0%)
$75,000 to $99,999
0 (0.0%)
29 (100.0%)
$100,000 to $149,999
0 (0.0%)
0 (0.0%)
$150,000 or more
0 (0.0%)
0 (0.0%)
Total
10 (100.0%)
29 (100.0%)
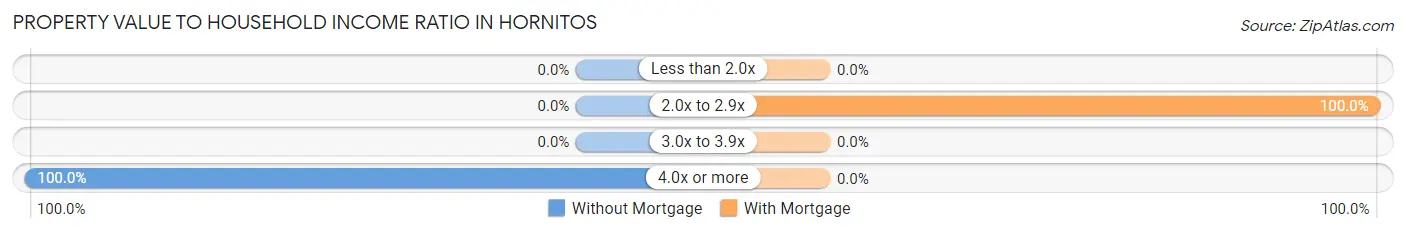
Property Value to Household Income Ratio in Hornitos
Value-to-Income Ratio
Without Mortgage
With Mortgage
Less than 2.0x
0 (0.0%)
0 (0.0%)
2.0x to 2.9x
0 (0.0%)
29 (100.0%)
3.0x to 3.9x
0 (0.0%)
0 (0.0%)
4.0x or more
10 (100.0%)
0 (0.0%)
Total
10 (100.0%)
29 (100.0%)
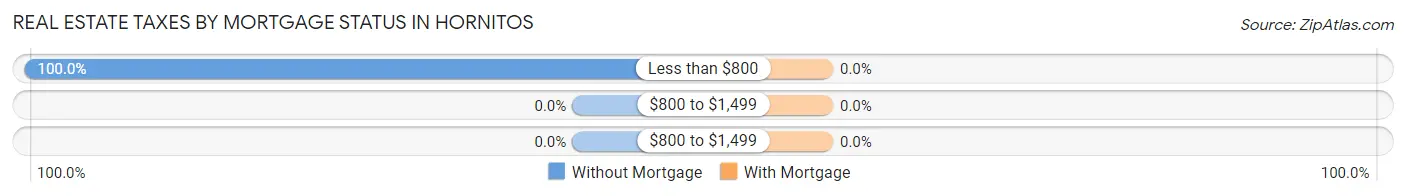
Real Estate Taxes by Mortgage Status in Hornitos
Property Taxes
Without Mortgage
With Mortgage
Less than $800
10 (100.0%)
0 (0.0%)
$800 to $1,499
0 (0.0%)
0 (0.0%)
$800 to $1,499
0 (0.0%)
0 (0.0%)
Total
10 (100.0%)
29 (100.0%)
Health & Disability in Hornitos
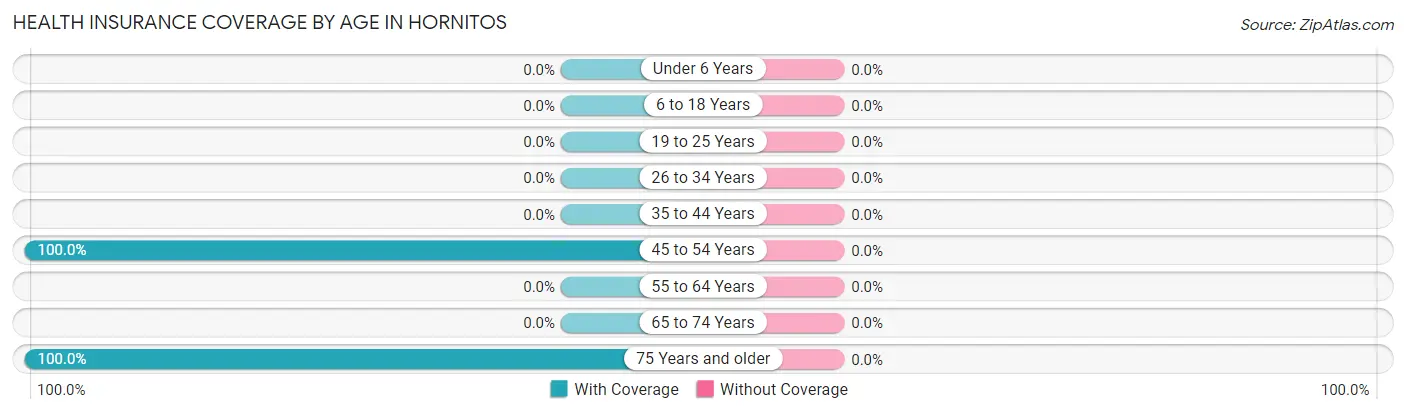
Health Insurance Coverage by Age in Hornitos
Age Bracket
With Coverage
Without Coverage
Under 6 Years
0 (0.0%)
0 (0.0%)
6 to 18 Years
0 (0.0%)
0 (0.0%)
19 to 25 Years
0 (0.0%)
0 (0.0%)
26 to 34 Years
0 (0.0%)
0 (0.0%)
35 to 44 Years
0 (0.0%)
0 (0.0%)
45 to 54 Years
44 (100.0%)
0 (0.0%)
55 to 64 Years
0 (0.0%)
0 (0.0%)
65 to 74 Years
0 (0.0%)
0 (0.0%)
75 Years and older
10 (100.0%)
0 (0.0%)
Total
54 (100.0%)
0 (0.0%)
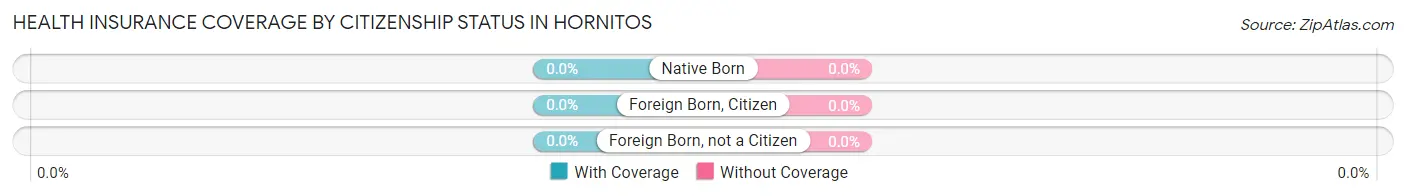
Health Insurance Coverage by Citizenship Status in Hornitos
Citizenship Status
With Coverage
Without Coverage
Native Born
0 (0.0%)
0 (0.0%)
Foreign Born, Citizen
0 (0.0%)
0 (0.0%)
Foreign Born, not a Citizen
0 (0.0%)
0 (0.0%)
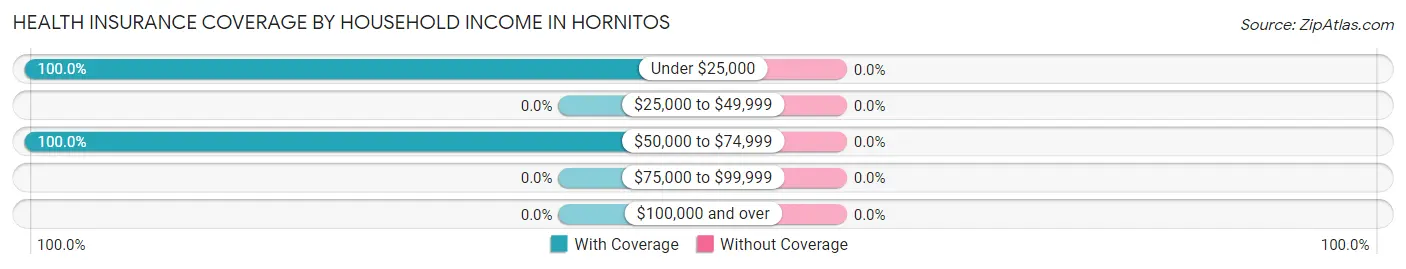
Health Insurance Coverage by Household Income in Hornitos
Household Income
With Coverage
Without Coverage
Under $25,000
10 (100.0%)
0 (0.0%)
$25,000 to $49,999
0 (0.0%)
0 (0.0%)
$50,000 to $74,999
44 (100.0%)
0 (0.0%)
$75,000 to $99,999
0 (0.0%)
0 (0.0%)
$100,000 and over
0 (0.0%)
0 (0.0%)
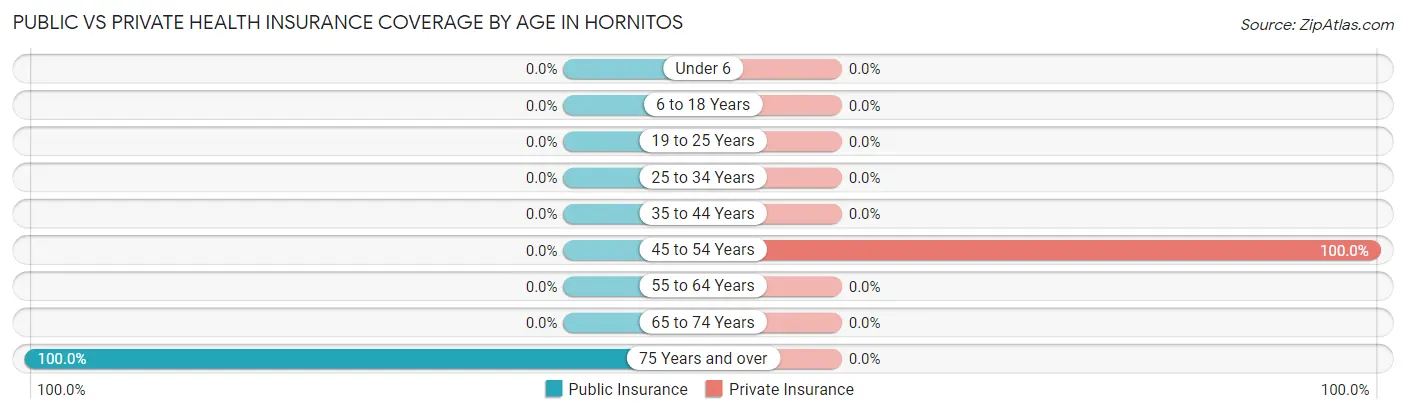
Public vs Private Health Insurance Coverage by Age in Hornitos
Age Bracket
Public Insurance
Private Insurance
Under 6
0 (0.0%)
0 (0.0%)
6 to 18 Years
0 (0.0%)
0 (0.0%)
19 to 25 Years
0 (0.0%)
0 (0.0%)
25 to 34 Years
0 (0.0%)
0 (0.0%)
35 to 44 Years
0 (0.0%)
0 (0.0%)
45 to 54 Years
0 (0.0%)
44 (100.0%)
55 to 64 Years
0 (0.0%)
0 (0.0%)
65 to 74 Years
0 (0.0%)
0 (0.0%)
75 Years and over
10 (100.0%)
0 (0.0%)
Total
10 (18.5%)
44 (81.5%)
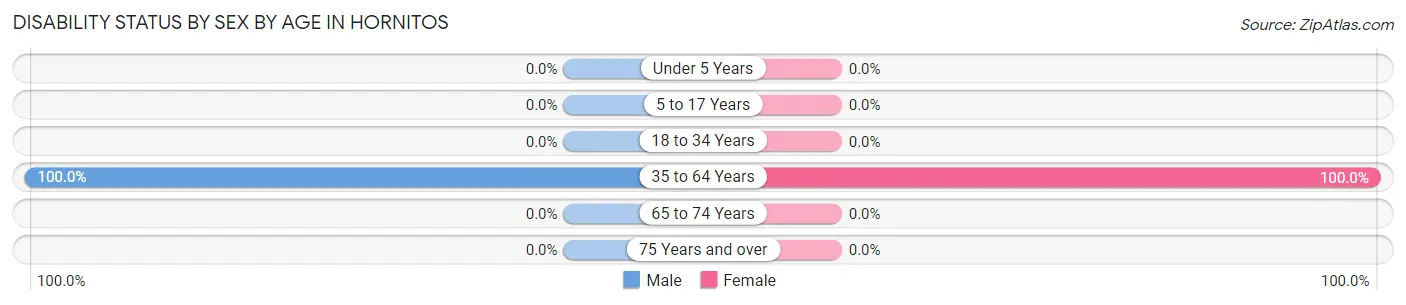
Disability Status by Sex by Age in Hornitos
Age Bracket
Male
Female
Under 5 Years
0 (0.0%)
0 (0.0%)
5 to 17 Years
0 (0.0%)
0 (0.0%)
18 to 34 Years
0 (0.0%)
0 (0.0%)
35 to 64 Years
15 (100.0%)
29 (100.0%)
65 to 74 Years
0 (0.0%)
0 (0.0%)
75 Years and over
0 (0.0%)
0 (0.0%)
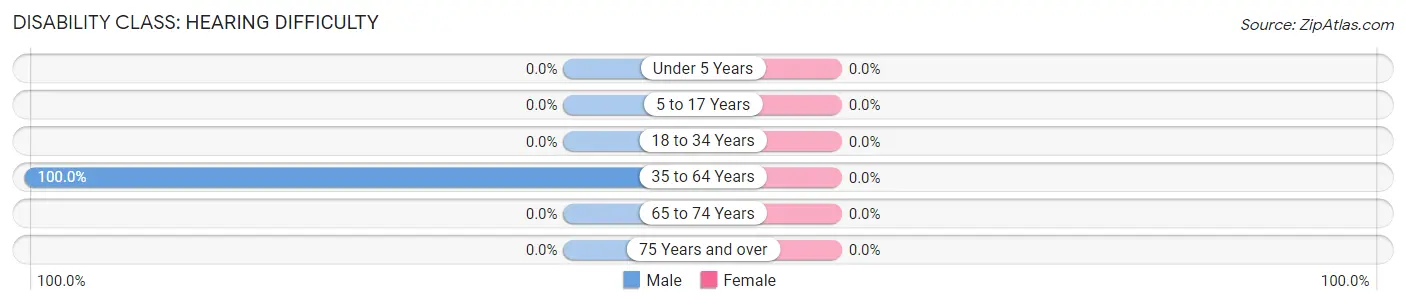
Disability Class by Sex by Age in Hornitos
Disability Class: Hearing Difficulty
Age Bracket
Male
Female
Under 5 Years
0 (0.0%)
0 (0.0%)
5 to 17 Years
0 (0.0%)
0 (0.0%)
18 to 34 Years
0 (0.0%)
0 (0.0%)
35 to 64 Years
15 (100.0%)
0 (0.0%)
65 to 74 Years
0 (0.0%)
0 (0.0%)
75 Years and over
0 (0.0%)
0 (0.0%)
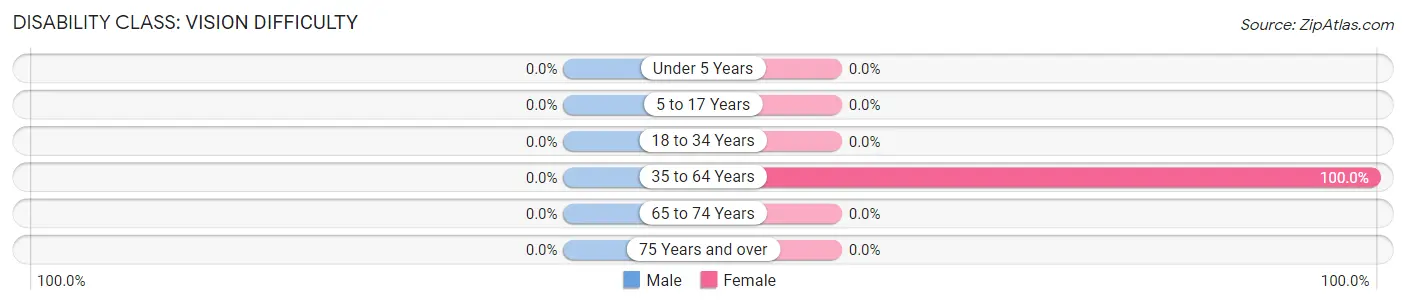
Disability Class: Vision Difficulty
Age Bracket
Male
Female
Under 5 Years
0 (0.0%)
0 (0.0%)
5 to 17 Years
0 (0.0%)
0 (0.0%)
18 to 34 Years
0 (0.0%)
0 (0.0%)
35 to 64 Years
0 (0.0%)
29 (100.0%)
65 to 74 Years
0 (0.0%)
0 (0.0%)
75 Years and over
0 (0.0%)
0 (0.0%)
Disability Class: Cognitive Difficulty
Age Bracket
Male
Female
5 to 17 Years
0 (0.0%)
0 (0.0%)
18 to 34 Years
0 (0.0%)
0 (0.0%)
35 to 64 Years
0 (0.0%)
0 (0.0%)
65 to 74 Years
0 (0.0%)
0 (0.0%)
75 Years and over
0 (0.0%)
0 (0.0%)
Disability Class: Ambulatory Difficulty
Age Bracket
Male
Female
5 to 17 Years
0 (0.0%)
0 (0.0%)
18 to 34 Years
0 (0.0%)
0 (0.0%)
35 to 64 Years
0 (0.0%)
0 (0.0%)
65 to 74 Years
0 (0.0%)
0 (0.0%)
75 Years and over
0 (0.0%)
0 (0.0%)
Disability Class: Self-Care Difficulty
Age Bracket
Male
Female
5 to 17 Years
0 (0.0%)
0 (0.0%)
18 to 34 Years
0 (0.0%)
0 (0.0%)
35 to 64 Years
0 (0.0%)
0 (0.0%)
65 to 74 Years
0 (0.0%)
0 (0.0%)
75 Years and over
0 (0.0%)
0 (0.0%)
Technology Access in Hornitos
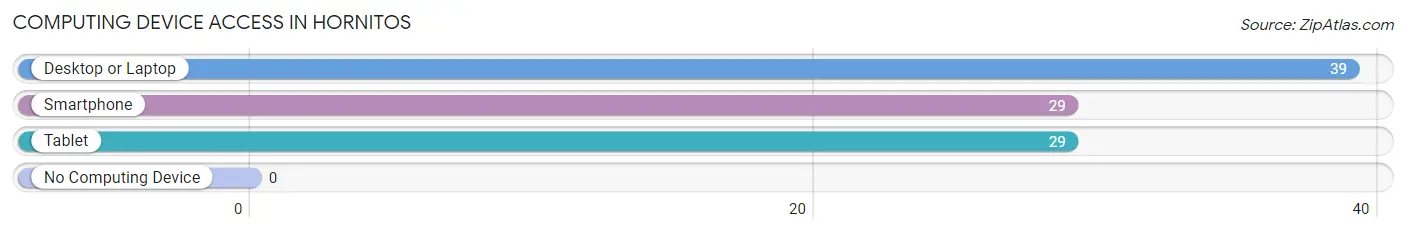
Computing Device Access in Hornitos
Device Type
# Households
% Households
Desktop or Laptop
39
100.0%
Smartphone
29
74.4%
Tablet
29
74.4%
No Computing Device
0
0.0%
Total
39
100.0%
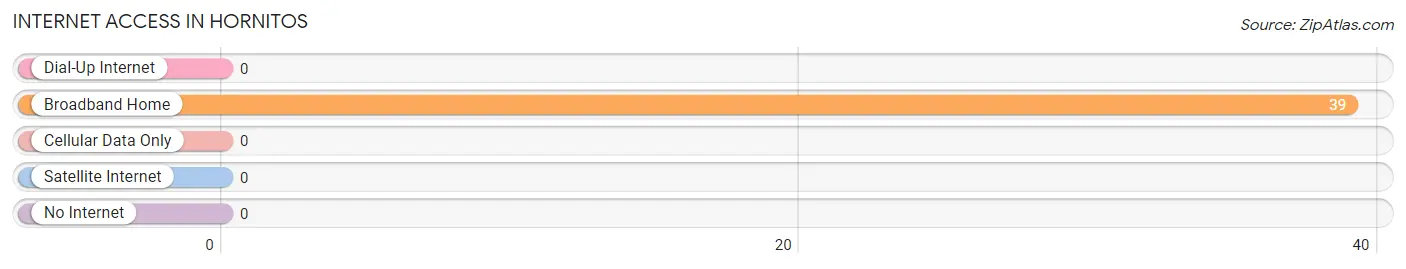
Internet Access in Hornitos
Internet Type
# Households
% Households
Dial-Up Internet
0
0.0%
Broadband Home
39
100.0%
Cellular Data Only
0
0.0%
Satellite Internet
0
0.0%
No Internet
0
0.0%
Total
39
100.0%
Hornitos Summary
Hornitos is a small unincorporated community located in Mariposa County, California. It is situated in the foothills of the Sierra Nevada Mountains, approximately 25 miles southeast of the county seat of Mariposa. The town is located along State Route 49, which is a major thoroughfare connecting the Central Valley to the Sierra Nevada. The population of Hornitos was estimated to be around 200 people in 2000.
History
Hornitos was founded in 1851 by Mexican miners who were searching for gold in the area. The town was named after the Spanish word for “little ovens”, which were used to roast ore in the area. The town quickly grew to become a bustling mining town, with a population of over 1,000 people by the late 1850s.
The town was home to several saloons, hotels, and stores, as well as a Wells Fargo office. The town was also home to a large Chinese population, who worked in the mines and on the railroads.
In the late 19th century, the town began to decline as the gold rush ended and the population dwindled. By the early 20th century, the town had become a ghost town, with only a few residents remaining.
Geography
Hornitos is located in the foothills of the Sierra Nevada Mountains, at an elevation of 1,890 feet. The town is situated along State Route 49, which is a major thoroughfare connecting the Central Valley to the Sierra Nevada.
The town is surrounded by rolling hills and oak woodlands, and is located near several creeks and rivers, including the Merced River and the Tuolumne River. The area is also home to several species of wildlife, including black bears, mountain lions, and deer.
Economy
The economy of Hornitos is largely based on tourism and agriculture. The town is home to several wineries, as well as a number of small businesses. The town is also home to a number of bed and breakfasts, as well as a few restaurants.
Agriculture is also an important part of the local economy, with the area being home to several farms and ranches. The area is also home to a number of fruit orchards, as well as vineyards.
Demographics
The population of Hornitos was estimated to be around 200 people in 2000. The town is predominantly white, with the majority of the population being of Hispanic or Latino descent. The town is also home to a small Native American population, as well as a few African American residents.
The median household income in Hornitos is around $35,000, and the median home value is around $150,000. The town has a high poverty rate, with around 25% of the population living below the poverty line.
Common Questions
What is Inequality or Gini Index in Hornitos?
Inequality or Gini Index in Hornitos is 0.15.
What is the Total Population of Hornitos?
Total Population of Hornitos is 54.
What is the Total Male Population of Hornitos?
Total Male Population of Hornitos is 25.
What is the Total Female Population of Hornitos?
Total Female Population of Hornitos is 29.
What is the Ratio of Males per 100 Females in Hornitos?
There are 86.21 Males per 100 Females in Hornitos.
What is the Ratio of Females per 100 Males in Hornitos?
There are 116.00 Females per 100 Males in Hornitos.
What is the Median Population Age in Hornitos?
Median Population Age in Hornitos is 48.9 Years.
What is the Average Family Size in Hornitos
Average Family Size in Hornitos is 1.5 People.
What is the Average Household Size in Hornitos
Average Household Size in Hornitos is 1.4 People.
How Large is the Labor Force in Hornitos?
There are 15 People in the Labor Forcein in Hornitos.
What is the Percentage of People in the Labor Force in Hornitos?
27.8% of People are in the Labor Force in Hornitos.
Report Title
Report Link
HTML Copy & Paste Link
Social Media
Copy and paste the folowing code into any webpage where you would like this interactive chart to display