Cities with the Highest Percentage of Households With Three or more Vehicles in Utah
RELATED REPORTS & OPTIONS
Households with 3 or more Cars
Utah
Compare Cities
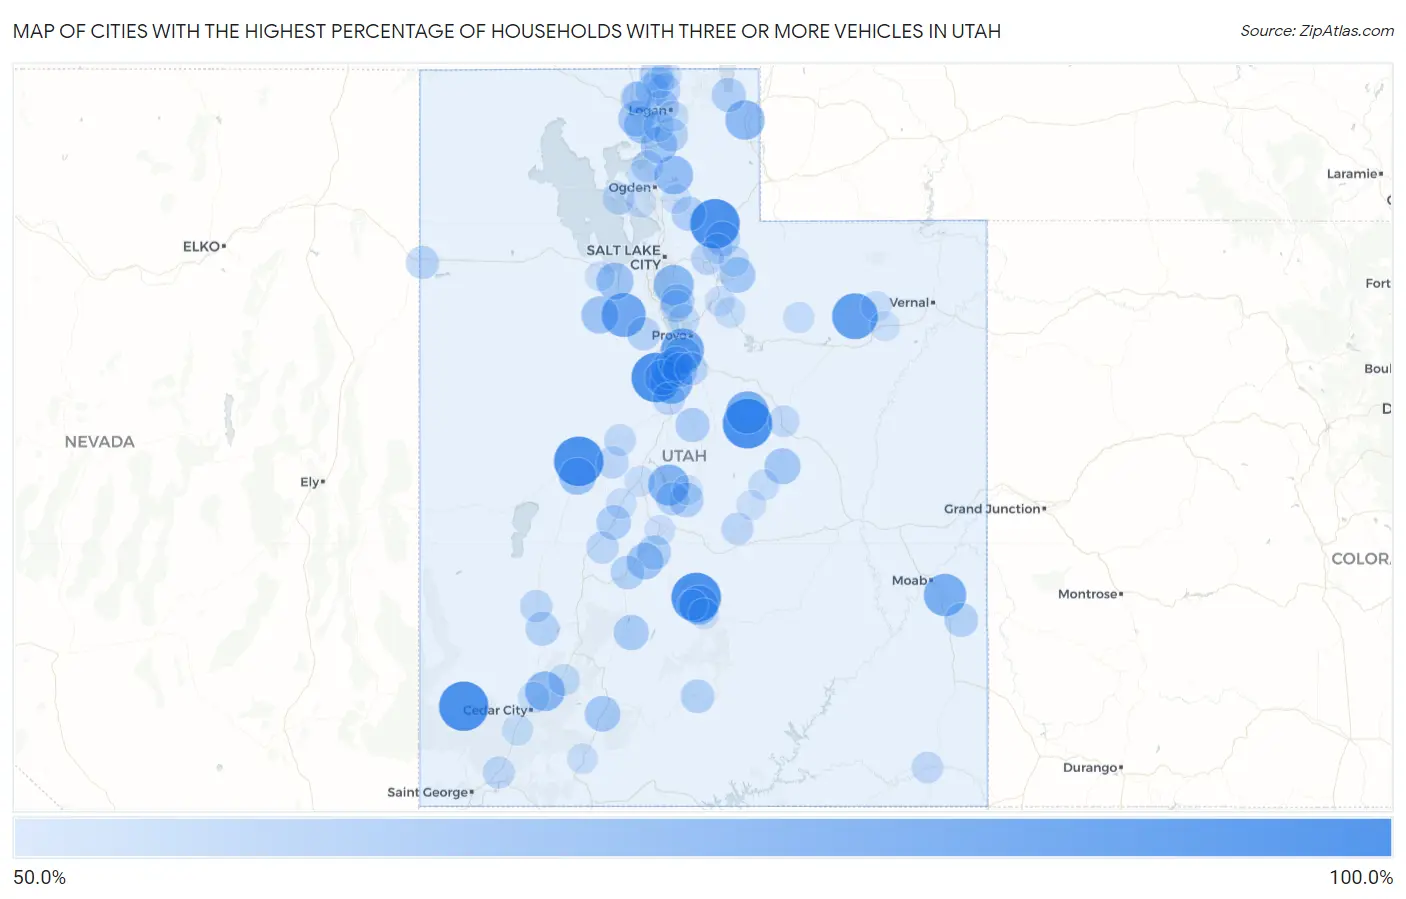
Map of Cities with the Highest Percentage of Households With Three or more Vehicles in Utah
0.0%
100.0%
Cities with the Highest Percentage of Households With Three or more Vehicles in Utah
| City | Housholds With 3+ Cars | vs State | vs National | |
| 1. | Elberta | 100.0% | 39.8%(+60.2)#1 | 29.0%(+71.0)#44 |
| 2. | Sutherland | 100.0% | 39.8%(+60.2)#2 | 29.0%(+71.0)#93 |
| 3. | Echo | 100.0% | 39.8%(+60.2)#3 | 29.0%(+71.0)#181 |
| 4. | Fremont | 100.0% | 39.8%(+60.2)#4 | 29.0%(+71.0)#235 |
| 5. | Clear Creek | 100.0% | 39.8%(+60.2)#5 | 29.0%(+71.0)#298 |
| 6. | Beryl Junction | 100.0% | 39.8%(+60.2)#6 | 29.0%(+71.0)#301 |
| 7. | Bluebell | 90.9% | 39.8%(+51.1)#7 | 29.0%(+61.9)#414 |
| 8. | Ophir | 86.7% | 39.8%(+46.9)#8 | 29.0%(+57.7)#467 |
| 9. | Lake Shore | 84.6% | 39.8%(+44.8)#9 | 29.0%(+55.6)#496 |
| 10. | Scofield | 83.3% | 39.8%(+43.5)#10 | 29.0%(+54.3)#519 |
| 11. | Rocky Ridge | 83.1% | 39.8%(+43.3)#11 | 29.0%(+54.1)#523 |
| 12. | Spanish Valley | 82.8% | 39.8%(+43.0)#12 | 29.0%(+53.8)#529 |
| 13. | Fayette | 79.0% | 39.8%(+39.2)#13 | 29.0%(+50.0)#612 |
| 14. | Granite | 77.3% | 39.8%(+37.5)#14 | 29.0%(+48.3)#657 |
| 15. | Summit | 76.2% | 39.8%(+36.4)#15 | 29.0%(+47.2)#691 |
| 16. | Randolph | 75.6% | 39.8%(+35.8)#16 | 29.0%(+46.6)#713 |
| 17. | Lyman | 75.0% | 39.8%(+35.2)#17 | 29.0%(+46.0)#727 |
| 18. | Eden | 73.6% | 39.8%(+33.8)#18 | 29.0%(+44.6)#786 |
| 19. | Genola | 73.4% | 39.8%(+33.6)#19 | 29.0%(+44.4)#791 |
| 20. | Benjamin | 71.9% | 39.8%(+32.1)#20 | 29.0%(+42.9)#832 |
| 21. | Rush Valley | 70.4% | 39.8%(+30.6)#21 | 29.0%(+41.4)#875 |
| 22. | Erda | 70.2% | 39.8%(+30.4)#22 | 29.0%(+41.2)#882 |
| 23. | Deseret | 70.1% | 39.8%(+30.3)#23 | 29.0%(+41.1)#888 |
| 24. | Honeyville | 69.4% | 39.8%(+29.6)#24 | 29.0%(+40.4)#915 |
| 25. | Mantua | 69.3% | 39.8%(+29.5)#25 | 29.0%(+40.3)#920 |
| 26. | Annabella | 68.5% | 39.8%(+28.7)#26 | 29.0%(+39.5)#955 |
| 27. | Elwood | 67.5% | 39.8%(+27.7)#27 | 29.0%(+38.5)#1,011 |
| 28. | Cleveland | 67.2% | 39.8%(+27.4)#28 | 29.0%(+38.2)#1,031 |
| 29. | Goshen | 66.8% | 39.8%(+27.0)#29 | 29.0%(+37.8)#1,046 |
| 30. | Hatch | 66.7% | 39.8%(+26.9)#30 | 29.0%(+37.7)#1,061 |
| 31. | Samak | 66.7% | 39.8%(+26.9)#31 | 29.0%(+37.7)#1,063 |
| 32. | Kingston | 65.6% | 39.8%(+25.8)#32 | 29.0%(+36.6)#1,142 |
| 33. | West Mountain | 64.5% | 39.8%(+24.7)#33 | 29.0%(+35.5)#1,217 |
| 34. | Spring Lake | 64.5% | 39.8%(+24.7)#34 | 29.0%(+35.5)#1,219 |
| 35. | Hoytsville | 64.4% | 39.8%(+24.6)#35 | 29.0%(+35.4)#1,221 |
| 36. | Mayfield | 64.2% | 39.8%(+24.4)#36 | 29.0%(+35.2)#1,241 |
| 37. | Fillmore | 64.0% | 39.8%(+24.2)#37 | 29.0%(+35.0)#1,246 |
| 38. | Morgan | 63.8% | 39.8%(+24.0)#38 | 29.0%(+34.8)#1,261 |
| 39. | Fountain Green | 63.6% | 39.8%(+23.8)#39 | 29.0%(+34.6)#1,274 |
| 40. | Glenwood | 63.6% | 39.8%(+23.8)#40 | 29.0%(+34.6)#1,275 |
| 41. | Alpine | 63.4% | 39.8%(+23.6)#41 | 29.0%(+34.4)#1,291 |
| 42. | Laketown | 63.4% | 39.8%(+23.6)#42 | 29.0%(+34.4)#1,296 |
| 43. | La Sal | 62.6% | 39.8%(+22.8)#43 | 29.0%(+33.6)#1,345 |
| 44. | Minersville | 62.4% | 39.8%(+22.6)#44 | 29.0%(+33.4)#1,376 |
| 45. | Escalante | 62.1% | 39.8%(+22.3)#45 | 29.0%(+33.1)#1,406 |
| 46. | Joseph | 62.1% | 39.8%(+22.3)#46 | 29.0%(+33.1)#1,409 |
| 47. | Paradise | 61.6% | 39.8%(+21.8)#47 | 29.0%(+32.6)#1,446 |
| 48. | Newton | 61.5% | 39.8%(+21.7)#48 | 29.0%(+32.5)#1,451 |
| 49. | Fairfield | 61.5% | 39.8%(+21.7)#49 | 29.0%(+32.5)#1,465 |
| 50. | Cornish | 61.1% | 39.8%(+21.3)#50 | 29.0%(+32.1)#1,507 |
| 51. | Centerfield | 61.0% | 39.8%(+21.2)#51 | 29.0%(+32.0)#1,517 |
| 52. | Amalga | 60.9% | 39.8%(+21.1)#52 | 29.0%(+31.9)#1,529 |
| 53. | Benson | 60.7% | 39.8%(+20.9)#53 | 29.0%(+31.7)#1,544 |
| 54. | Wendover | 60.6% | 39.8%(+20.8)#54 | 29.0%(+31.6)#1,553 |
| 55. | Woodland Hills | 60.4% | 39.8%(+20.6)#55 | 29.0%(+31.4)#1,575 |
| 56. | Silver Summit | 60.3% | 39.8%(+20.5)#56 | 29.0%(+31.3)#1,583 |
| 57. | Fielding | 59.7% | 39.8%(+19.9)#57 | 29.0%(+30.7)#1,671 |
| 58. | Mona | 59.6% | 39.8%(+19.8)#58 | 29.0%(+30.6)#1,679 |
| 59. | Milford | 59.2% | 39.8%(+19.4)#59 | 29.0%(+30.2)#1,728 |
| 60. | Oak City | 59.1% | 39.8%(+19.3)#60 | 29.0%(+30.1)#1,740 |
| 61. | Kanosh | 59.1% | 39.8%(+19.3)#61 | 29.0%(+30.1)#1,742 |
| 62. | Highland | 59.0% | 39.8%(+19.2)#62 | 29.0%(+30.0)#1,753 |
| 63. | Hooper | 58.8% | 39.8%(+19.0)#63 | 29.0%(+29.8)#1,770 |
| 64. | South Willard | 58.8% | 39.8%(+19.0)#64 | 29.0%(+29.8)#1,774 |
| 65. | Emery | 58.8% | 39.8%(+19.0)#65 | 29.0%(+29.8)#1,776 |
| 66. | Leeds | 58.4% | 39.8%(+18.6)#66 | 29.0%(+29.4)#1,823 |
| 67. | Hobble Creek | 58.1% | 39.8%(+18.3)#67 | 29.0%(+29.1)#1,871 |
| 68. | Leamington | 58.0% | 39.8%(+18.2)#68 | 29.0%(+29.0)#1,881 |
| 69. | Trenton | 57.8% | 39.8%(+18.0)#69 | 29.0%(+28.8)#1,898 |
| 70. | Riverside | 57.6% | 39.8%(+17.8)#70 | 29.0%(+28.6)#1,921 |
| 71. | Paragonah | 57.6% | 39.8%(+17.8)#71 | 29.0%(+28.6)#1,927 |
| 72. | Spring Glen | 57.5% | 39.8%(+17.7)#72 | 29.0%(+28.5)#1,933 |
| 73. | Bluff | 57.5% | 39.8%(+17.7)#73 | 29.0%(+28.5)#1,939 |
| 74. | Enoch | 57.0% | 39.8%(+17.2)#74 | 29.0%(+28.0)#1,994 |
| 75. | Lindon | 56.9% | 39.8%(+17.1)#75 | 29.0%(+27.9)#2,007 |
| 76. | Wellsville | 56.8% | 39.8%(+17.0)#76 | 29.0%(+27.8)#2,024 |
| 77. | Tabiona | 56.4% | 39.8%(+16.6)#77 | 29.0%(+27.4)#2,079 |
| 78. | Kanarraville | 56.3% | 39.8%(+16.5)#78 | 29.0%(+27.3)#2,091 |
| 79. | Plain City | 56.2% | 39.8%(+16.4)#79 | 29.0%(+27.2)#2,102 |
| 80. | Millville | 56.1% | 39.8%(+16.3)#80 | 29.0%(+27.1)#2,121 |
| 81. | Oakley | 56.1% | 39.8%(+16.3)#81 | 29.0%(+27.1)#2,122 |
| 82. | Castle Dale | 56.1% | 39.8%(+16.3)#82 | 29.0%(+27.1)#2,124 |
| 83. | Loa | 56.0% | 39.8%(+16.2)#83 | 29.0%(+27.0)#2,146 |
| 84. | Independence | 56.0% | 39.8%(+16.2)#84 | 29.0%(+27.0)#2,157 |
| 85. | Neola | 55.6% | 39.8%(+15.8)#85 | 29.0%(+26.6)#2,202 |
| 86. | Bicknell | 55.5% | 39.8%(+15.7)#86 | 29.0%(+26.5)#2,237 |
| 87. | Scipio | 55.4% | 39.8%(+15.6)#87 | 29.0%(+26.4)#2,247 |
| 88. | Holden | 55.2% | 39.8%(+15.4)#88 | 29.0%(+26.2)#2,276 |
| 89. | Glendale | 55.2% | 39.8%(+15.4)#89 | 29.0%(+26.2)#2,277 |
| 90. | West Point | 55.0% | 39.8%(+15.2)#90 | 29.0%(+26.0)#2,299 |
| 91. | Daniel | 54.9% | 39.8%(+15.1)#91 | 29.0%(+25.9)#2,321 |
| 92. | Aurora | 54.8% | 39.8%(+15.0)#92 | 29.0%(+25.8)#2,334 |
| 93. | Lewiston | 54.6% | 39.8%(+14.8)#93 | 29.0%(+25.6)#2,362 |
| 94. | Sterling | 54.5% | 39.8%(+14.7)#94 | 29.0%(+25.5)#2,373 |
| 95. | Wanship | 54.5% | 39.8%(+14.7)#95 | 29.0%(+25.5)#2,374 |
| 96. | Ferron | 54.3% | 39.8%(+14.5)#96 | 29.0%(+25.3)#2,407 |
| 97. | Brighton | 54.3% | 39.8%(+14.5)#97 | 29.0%(+25.3)#2,413 |
| 98. | Ballard | 54.2% | 39.8%(+14.4)#98 | 29.0%(+25.2)#2,423 |
| 99. | Mountain Green | 54.1% | 39.8%(+14.3)#99 | 29.0%(+25.1)#2,441 |
| 100. | Grantsville | 54.0% | 39.8%(+14.2)#100 | 29.0%(+25.0)#2,464 |
Common Questions
What are the Top 10 Cities with the Highest Percentage of Households With Three or more Vehicles in Utah?
Top 10 Cities with the Highest Percentage of Households With Three or more Vehicles in Utah are:
#1
100.0%
#2
100.0%
#3
100.0%
#4
100.0%
#5
100.0%
#6
100.0%
#7
90.9%
#8
86.7%
#9
84.6%
#10
83.3%
What city has the Highest Percentage of Households With Three or more Vehicles in Utah?
Elberta has the Highest Percentage of Households With Three or more Vehicles in Utah with 100.0%.
What is the Percentage of Households With Three or more Vehicles in the State of Utah?
Percentage of Households With Three or more Vehicles in Utah is 39.8%.
What is the Percentage of Households With Three or more Vehicles in the United States?
Percentage of Households With Three or more Vehicles in the United States is 29.0%.