Cities with the Highest Percentage of Households With Three or more Vehicles in Minnesota
RELATED REPORTS & OPTIONS
Households with 3 or more Cars
Minnesota
Compare Cities
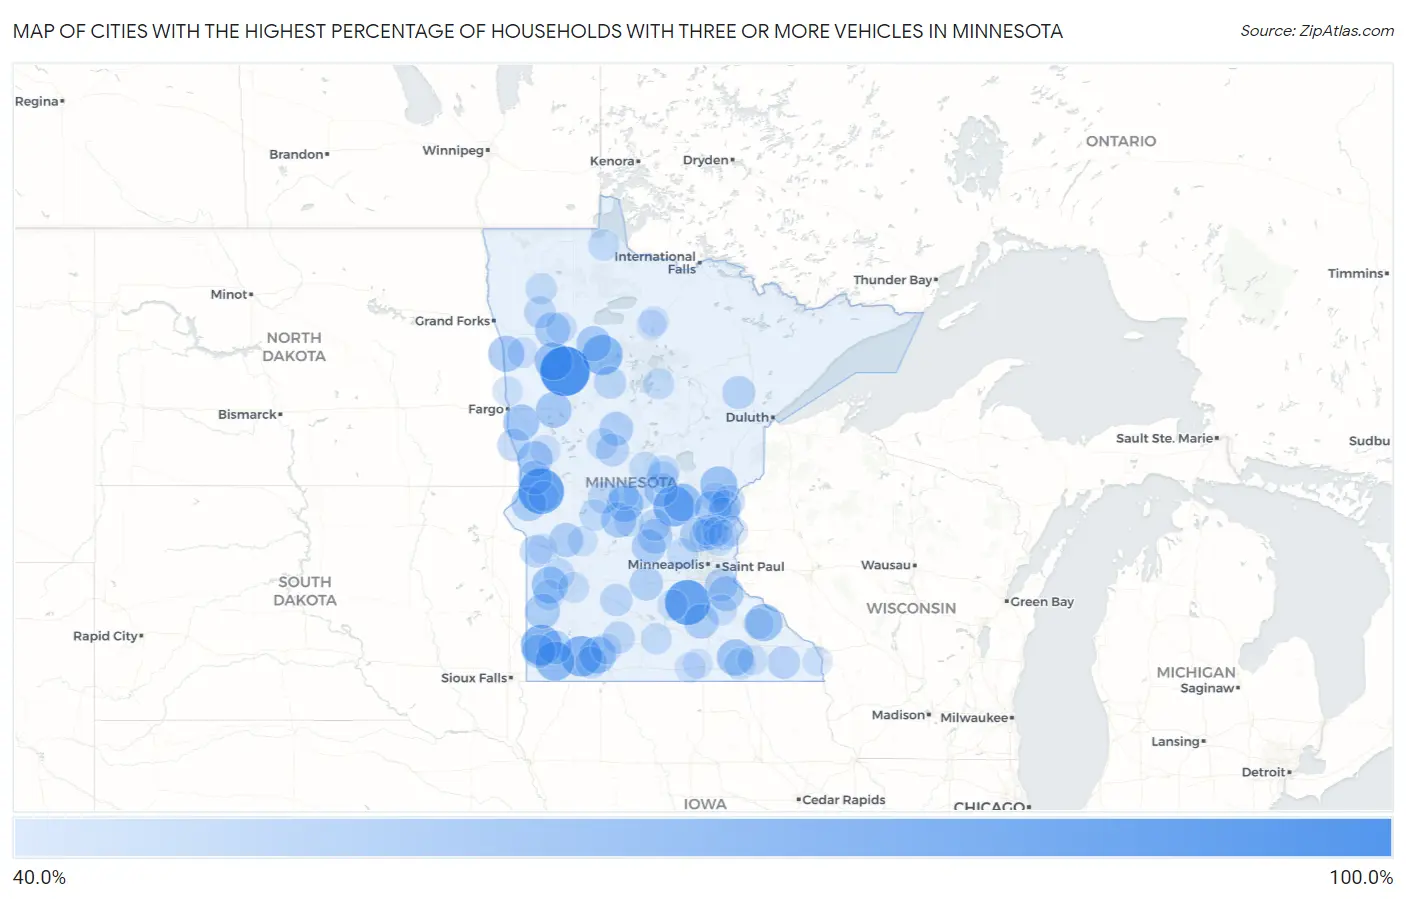
Map of Cities with the Highest Percentage of Households With Three or more Vehicles in Minnesota
0.0%
100.0%
Cities with the Highest Percentage of Households With Three or more Vehicles in Minnesota
| City | Housholds With 3+ Cars | vs State | vs National | |
| 1. | Midway | 100.0% | 29.4%(+70.6)#1 | 29.0%(+71.0)#271 |
| 2. | Norcross | 88.4% | 29.4%(+59.0)#2 | 29.0%(+59.4)#433 |
| 3. | Heidelberg | 87.3% | 29.4%(+57.9)#3 | 29.0%(+58.3)#456 |
| 4. | Essig | 80.0% | 29.4%(+50.6)#4 | 29.0%(+51.0)#582 |
| 5. | Ronneby | 75.0% | 29.4%(+45.6)#5 | 29.0%(+46.0)#737 |
| 6. | Hatfield | 75.0% | 29.4%(+45.6)#6 | 29.0%(+46.0)#741 |
| 7. | Kinbrae | 75.0% | 29.4%(+45.6)#7 | 29.0%(+46.0)#755 |
| 8. | Solway | 73.7% | 29.4%(+44.3)#8 | 29.0%(+44.7)#785 |
| 9. | Lismore | 70.8% | 29.4%(+41.4)#9 | 29.0%(+41.8)#863 |
| 10. | St. John's University | 70.0% | 29.4%(+40.6)#10 | 29.0%(+41.0)#889 |
| 11. | Bejou | 67.7% | 29.4%(+38.3)#11 | 29.0%(+38.7)#1,005 |
| 12. | Foreston | 67.1% | 29.4%(+37.7)#12 | 29.0%(+38.1)#1,037 |
| 13. | Millville | 65.5% | 29.4%(+36.1)#13 | 29.0%(+36.5)#1,147 |
| 14. | Brook Park | 65.5% | 29.4%(+36.1)#14 | 29.0%(+36.5)#1,149 |
| 15. | Wilder | 64.7% | 29.4%(+35.3)#15 | 29.0%(+35.7)#1,211 |
| 16. | St Leo | 63.8% | 29.4%(+34.4)#16 | 29.0%(+34.8)#1,269 |
| 17. | St Rosa | 63.6% | 29.4%(+34.2)#17 | 29.0%(+34.6)#1,282 |
| 18. | Sargeant | 63.2% | 29.4%(+33.8)#18 | 29.0%(+34.2)#1,313 |
| 19. | Nielsville | 62.5% | 29.4%(+33.1)#19 | 29.0%(+33.5)#1,360 |
| 20. | Baker | 62.5% | 29.4%(+33.1)#20 | 29.0%(+33.5)#1,368 |
| 21. | Audubon | 61.5% | 29.4%(+32.1)#21 | 29.0%(+32.5)#1,452 |
| 22. | Stanchfield | 61.1% | 29.4%(+31.7)#22 | 29.0%(+32.1)#1,511 |
| 23. | Brooks | 60.0% | 29.4%(+30.6)#24 | 29.0%(+31.0)#1,623 |
| 24. | Foxhome | 60.0% | 29.4%(+30.6)#25 | 29.0%(+31.0)#1,624 |
| 25. | Spring Hill | 60.0% | 29.4%(+30.6)#26 | 29.0%(+31.0)#1,626 |
| 26. | Leonard | 60.0% | 29.4%(+30.6)#27 | 29.0%(+31.0)#1,644 |
| 27. | Arco | 59.5% | 29.4%(+30.1)#28 | 29.0%(+30.5)#1,703 |
| 28. | Nowthen | 59.4% | 29.4%(+30.0)#29 | 29.0%(+30.4)#1,704 |
| 29. | New Trier | 59.3% | 29.4%(+29.9)#30 | 29.0%(+30.3)#1,724 |
| 30. | Dumont | 58.9% | 29.4%(+29.5)#31 | 29.0%(+29.9)#1,769 |
| 31. | Warsaw | 58.6% | 29.4%(+29.2)#32 | 29.0%(+29.6)#1,796 |
| 32. | Fairhaven | 58.3% | 29.4%(+28.9)#33 | 29.0%(+29.3)#1,837 |
| 33. | Danvers | 57.7% | 29.4%(+28.3)#34 | 29.0%(+28.7)#1,915 |
| 34. | Kingston | 57.1% | 29.4%(+27.7)#35 | 29.0%(+28.1)#1,971 |
| 35. | Nimrod | 57.1% | 29.4%(+27.7)#36 | 29.0%(+28.1)#1,980 |
| 36. | Nashua | 57.1% | 29.4%(+27.7)#37 | 29.0%(+28.1)#1,985 |
| 37. | Brownton | 56.2% | 29.4%(+26.8)#38 | 29.0%(+27.2)#2,113 |
| 38. | Chandler | 56.1% | 29.4%(+26.7)#39 | 29.0%(+27.1)#2,132 |
| 39. | Trosky | 55.6% | 29.4%(+26.2)#40 | 29.0%(+26.6)#2,219 |
| 40. | Buckman | 55.2% | 29.4%(+25.8)#41 | 29.0%(+26.2)#2,279 |
| 41. | Marion | 55.1% | 29.4%(+25.7)#42 | 29.0%(+26.1)#2,291 |
| 42. | Coates | 54.8% | 29.4%(+25.4)#43 | 29.0%(+25.8)#2,343 |
| 43. | Meadowlands | 54.5% | 29.4%(+25.1)#44 | 29.0%(+25.5)#2,380 |
| 44. | Aldrich | 53.8% | 29.4%(+24.4)#45 | 29.0%(+24.8)#2,509 |
| 45. | Kent | 53.8% | 29.4%(+24.4)#46 | 29.0%(+24.8)#2,512 |
| 46. | Whalan | 53.6% | 29.4%(+24.2)#47 | 29.0%(+24.6)#2,553 |
| 47. | Rock Creek | 53.1% | 29.4%(+23.7)#48 | 29.0%(+24.1)#2,644 |
| 48. | Bellingham | 53.1% | 29.4%(+23.7)#49 | 29.0%(+24.1)#2,654 |
| 49. | Lake George | 52.6% | 29.4%(+23.2)#50 | 29.0%(+23.6)#2,755 |
| 50. | Harris | 52.5% | 29.4%(+23.1)#51 | 29.0%(+23.5)#2,773 |
| 51. | Franklin | 52.5% | 29.4%(+23.1)#52 | 29.0%(+23.5)#2,777 |
| 52. | Rush City | 52.3% | 29.4%(+22.9)#53 | 29.0%(+23.3)#2,819 |
| 53. | East Bethel | 52.2% | 29.4%(+22.8)#54 | 29.0%(+23.2)#2,837 |
| 54. | Okabena | 52.1% | 29.4%(+22.7)#55 | 29.0%(+23.1)#2,877 |
| 55. | Darfur | 52.0% | 29.4%(+22.6)#56 | 29.0%(+23.0)#2,904 |
| 56. | West Union | 51.7% | 29.4%(+22.3)#57 | 29.0%(+22.7)#2,954 |
| 57. | St Hilaire | 51.6% | 29.4%(+22.2)#58 | 29.0%(+22.6)#2,973 |
| 58. | Lastrup | 51.4% | 29.4%(+22.0)#59 | 29.0%(+22.4)#3,014 |
| 59. | St Augusta | 51.2% | 29.4%(+21.8)#60 | 29.0%(+22.2)#3,035 |
| 60. | Oak Grove | 50.8% | 29.4%(+21.4)#61 | 29.0%(+21.8)#3,101 |
| 61. | Dexter | 50.5% | 29.4%(+21.1)#62 | 29.0%(+21.5)#3,181 |
| 62. | Columbus | 50.4% | 29.4%(+21.0)#63 | 29.0%(+21.4)#3,185 |
| 63. | Wadena | 50.1% | 29.4%(+20.7)#64 | 29.0%(+21.1)#3,235 |
| 64. | Boyd | 50.0% | 29.4%(+20.6)#65 | 29.0%(+21.0)#3,304 |
| 65. | Roosevelt | 50.0% | 29.4%(+20.6)#66 | 29.0%(+21.0)#3,310 |
| 66. | Harding | 50.0% | 29.4%(+20.6)#67 | 29.0%(+21.0)#3,327 |
| 67. | Fort Ripley | 50.0% | 29.4%(+20.6)#68 | 29.0%(+21.0)#3,352 |
| 68. | Holt | 50.0% | 29.4%(+20.6)#69 | 29.0%(+21.0)#3,373 |
| 69. | Sedan | 50.0% | 29.4%(+20.6)#70 | 29.0%(+21.0)#3,400 |
| 70. | Boy River | 50.0% | 29.4%(+20.6)#71 | 29.0%(+21.0)#3,427 |
| 71. | Greenfield | 49.7% | 29.4%(+20.3)#72 | 29.0%(+20.7)#3,463 |
| 72. | Garden City | 49.4% | 29.4%(+20.0)#73 | 29.0%(+20.4)#3,526 |
| 73. | Dennison | 49.3% | 29.4%(+19.9)#74 | 29.0%(+20.3)#3,548 |
| 74. | Taunton | 49.3% | 29.4%(+19.9)#75 | 29.0%(+20.3)#3,551 |
| 75. | Elmdale | 49.1% | 29.4%(+19.7)#76 | 29.0%(+20.1)#3,606 |
| 76. | Oklee | 48.8% | 29.4%(+19.4)#77 | 29.0%(+19.8)#3,672 |
| 77. | Hanley Falls | 48.8% | 29.4%(+19.4)#78 | 29.0%(+19.8)#3,673 |
| 78. | Bingham Lake | 48.8% | 29.4%(+19.4)#79 | 29.0%(+19.8)#3,681 |
| 79. | Le Sueur | 48.4% | 29.4%(+19.0)#80 | 29.0%(+19.4)#3,771 |
| 80. | Lindstrom | 48.3% | 29.4%(+18.9)#81 | 29.0%(+19.3)#3,801 |
| 81. | Hammond | 48.1% | 29.4%(+18.7)#82 | 29.0%(+19.1)#3,871 |
| 82. | Bethel | 48.0% | 29.4%(+18.6)#83 | 29.0%(+19.0)#3,890 |
| 83. | Elizabeth | 47.8% | 29.4%(+18.4)#84 | 29.0%(+18.8)#3,952 |
| 84. | Beltrami | 47.8% | 29.4%(+18.4)#85 | 29.0%(+18.8)#3,955 |
| 85. | Alden | 47.7% | 29.4%(+18.3)#86 | 29.0%(+18.7)#3,976 |
| 86. | Herman | 47.7% | 29.4%(+18.3)#87 | 29.0%(+18.7)#3,981 |
| 87. | St Martin | 47.7% | 29.4%(+18.3)#88 | 29.0%(+18.7)#3,989 |
| 88. | St Anthony City Stearns County | 47.6% | 29.4%(+18.2)#89 | 29.0%(+18.6)#4,018 |
| 89. | Racine | 47.2% | 29.4%(+17.8)#90 | 29.0%(+18.2)#4,110 |
| 90. | De Graff | 47.1% | 29.4%(+17.7)#91 | 29.0%(+18.1)#4,161 |
| 91. | Georgetown | 47.1% | 29.4%(+17.7)#92 | 29.0%(+18.1)#4,163 |
| 92. | Wyoming | 46.8% | 29.4%(+17.4)#93 | 29.0%(+17.8)#4,222 |
| 93. | Martin Lake | 46.8% | 29.4%(+17.4)#94 | 29.0%(+17.8)#4,236 |
| 94. | Grey Eagle | 46.8% | 29.4%(+17.4)#95 | 29.0%(+17.8)#4,248 |
| 95. | Northome | 46.7% | 29.4%(+17.3)#96 | 29.0%(+17.7)#4,274 |
| 96. | Grasston | 46.7% | 29.4%(+17.3)#97 | 29.0%(+17.7)#4,281 |
| 97. | Mizpah | 46.7% | 29.4%(+17.3)#98 | 29.0%(+17.7)#4,287 |
| 98. | Manchester | 46.7% | 29.4%(+17.3)#99 | 29.0%(+17.7)#4,289 |
| 99. | Louisburg | 46.7% | 29.4%(+17.3)#100 | 29.0%(+17.7)#4,292 |
| 100. | Hokah | 46.6% | 29.4%(+17.2)#101 | 29.0%(+17.6)#4,306 |
Common Questions
What are the Top 10 Cities with the Highest Percentage of Households With Three or more Vehicles in Minnesota?
Top 10 Cities with the Highest Percentage of Households With Three or more Vehicles in Minnesota are:
What city has the Highest Percentage of Households With Three or more Vehicles in Minnesota?
Midway has the Highest Percentage of Households With Three or more Vehicles in Minnesota with 100.0%.
What is the Percentage of Households With Three or more Vehicles in the State of Minnesota?
Percentage of Households With Three or more Vehicles in Minnesota is 29.4%.
What is the Percentage of Households With Three or more Vehicles in the United States?
Percentage of Households With Three or more Vehicles in the United States is 29.0%.