Cities with the Highest Percentage of Households With Three or more Vehicles in Massachusetts
RELATED REPORTS & OPTIONS
Households with 3 or more Cars
Massachusetts
Compare Cities
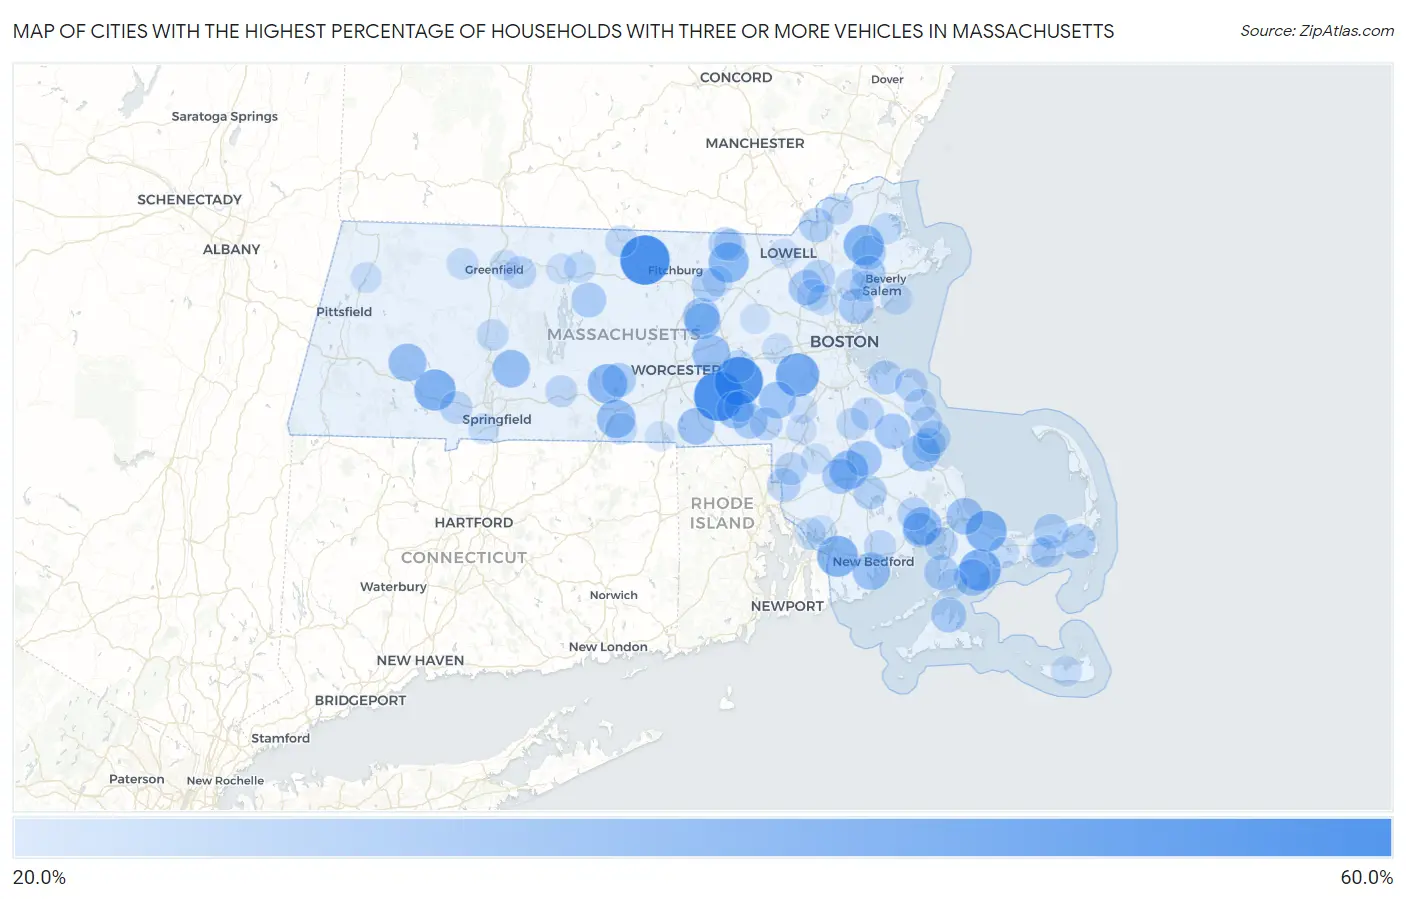
Map of Cities with the Highest Percentage of Households With Three or more Vehicles in Massachusetts
0.0%
60.0%
Cities with the Highest Percentage of Households With Three or more Vehicles in Massachusetts
| City | Housholds With 3+ Cars | vs State | vs National | |
| 1. | South Ashburnham | 54.4% | 23.7%(+30.7)#1 | 29.0%(+25.4)#2,398 |
| 2. | Upton | 54.2% | 23.7%(+30.5)#2 | 29.0%(+25.2)#2,420 |
| 3. | Hopkinton | 52.6% | 23.7%(+28.9)#3 | 29.0%(+23.6)#2,741 |
| 4. | Dover | 44.5% | 23.7%(+20.8)#4 | 29.0%(+15.5)#5,012 |
| 5. | Green Harbor | 43.1% | 23.7%(+19.4)#5 | 29.0%(+14.1)#5,601 |
| 6. | Mashpee Neck | 41.9% | 23.7%(+18.2)#6 | 29.0%(+12.9)#6,126 |
| 7. | Russell | 41.4% | 23.7%(+17.7)#7 | 29.0%(+12.4)#6,393 |
| 8. | North Westport | 41.0% | 23.7%(+17.3)#8 | 29.0%(+12.0)#6,580 |
| 9. | East Sandwich | 40.9% | 23.7%(+17.2)#9 | 29.0%(+11.9)#6,627 |
| 10. | Boxford | 39.8% | 23.7%(+16.1)#10 | 29.0%(+10.8)#7,220 |
| 11. | Groton | 39.5% | 23.7%(+15.8)#11 | 29.0%(+10.5)#7,401 |
| 12. | Brookfield | 38.7% | 23.7%(+15.0)#12 | 29.0%(+9.70)#7,879 |
| 13. | Cedar Crest | 38.0% | 23.7%(+14.3)#13 | 29.0%(+9.00)#8,284 |
| 14. | Raynham Center | 37.3% | 23.7%(+13.6)#14 | 29.0%(+8.30)#8,697 |
| 15. | Sturbridge | 37.0% | 23.7%(+13.3)#15 | 29.0%(+8.00)#8,898 |
| 16. | Wareham Center | 36.8% | 23.7%(+13.1)#16 | 29.0%(+7.80)#9,021 |
| 17. | Chester | 36.2% | 23.7%(+12.5)#17 | 29.0%(+7.20)#9,451 |
| 18. | Northborough | 35.8% | 23.7%(+12.1)#18 | 29.0%(+6.80)#9,669 |
| 19. | Granby | 35.8% | 23.7%(+12.1)#19 | 29.0%(+6.80)#9,686 |
| 20. | Kingston | 35.6% | 23.7%(+11.9)#20 | 29.0%(+6.60)#9,808 |
| 21. | Bliss Corner | 35.5% | 23.7%(+11.8)#21 | 29.0%(+6.50)#9,874 |
| 22. | Hopedale | 34.9% | 23.7%(+11.2)#22 | 29.0%(+5.90)#10,300 |
| 23. | East Douglas | 34.6% | 23.7%(+10.9)#23 | 29.0%(+5.60)#10,516 |
| 24. | Sagamore | 34.5% | 23.7%(+10.8)#24 | 29.0%(+5.50)#10,604 |
| 25. | Millis Clicquot | 34.4% | 23.7%(+10.7)#25 | 29.0%(+5.40)#10,687 |
| 26. | Seabrook | 34.2% | 23.7%(+10.5)#26 | 29.0%(+5.20)#10,881 |
| 27. | South Lancaster | 34.1% | 23.7%(+10.4)#27 | 29.0%(+5.10)#10,934 |
| 28. | Clinton | 33.6% | 23.7%(+9.90)#28 | 29.0%(+4.60)#11,373 |
| 29. | Bridgewater Town | 33.3% | 23.7%(+9.60)#29 | 29.0%(+4.30)#11,532 |
| 30. | Saugus | 32.4% | 23.7%(+8.70)#30 | 29.0%(+3.40)#12,312 |
| 31. | Hanson | 32.4% | 23.7%(+8.70)#31 | 29.0%(+3.40)#12,357 |
| 32. | Taunton | 32.3% | 23.7%(+8.60)#32 | 29.0%(+3.30)#12,406 |
| 33. | Pinehurst | 32.1% | 23.7%(+8.40)#33 | 29.0%(+3.10)#12,598 |
| 34. | Vineyard Haven | 31.7% | 23.7%(+8.00)#34 | 29.0%(+2.70)#12,961 |
| 35. | Bellingham | 31.5% | 23.7%(+7.80)#35 | 29.0%(+2.50)#13,128 |
| 36. | Weweantic | 31.4% | 23.7%(+7.70)#36 | 29.0%(+2.40)#13,224 |
| 37. | Petersham | 31.4% | 23.7%(+7.70)#37 | 29.0%(+2.40)#13,257 |
| 38. | East Dennis | 31.0% | 23.7%(+7.30)#38 | 29.0%(+2.00)#13,583 |
| 39. | East Harwich | 30.9% | 23.7%(+7.20)#39 | 29.0%(+1.90)#13,664 |
| 40. | West Falmouth | 30.8% | 23.7%(+7.10)#40 | 29.0%(+1.80)#13,762 |
| 41. | Topsfield | 30.7% | 23.7%(+7.00)#41 | 29.0%(+1.70)#13,859 |
| 42. | East Brookfield | 30.6% | 23.7%(+6.90)#42 | 29.0%(+1.60)#13,960 |
| 43. | Methuen Town | 30.5% | 23.7%(+6.80)#43 | 29.0%(+1.50)#14,010 |
| 44. | Shirley | 30.3% | 23.7%(+6.60)#44 | 29.0%(+1.30)#14,257 |
| 45. | Hingham | 30.2% | 23.7%(+6.50)#45 | 29.0%(+1.20)#14,331 |
| 46. | South Duxbury | 29.9% | 23.7%(+6.20)#46 | 29.0%(+0.900)#14,604 |
| 47. | Danvers | 29.7% | 23.7%(+6.00)#47 | 29.0%(+0.700)#14,763 |
| 48. | North Lakeville | 29.7% | 23.7%(+6.00)#48 | 29.0%(+0.700)#14,792 |
| 49. | North Seekonk | 29.5% | 23.7%(+5.80)#49 | 29.0%(+0.500)#14,968 |
| 50. | Duxbury | 29.5% | 23.7%(+5.80)#50 | 29.0%(+0.500)#14,974 |
| 51. | Pocasset | 29.1% | 23.7%(+5.40)#51 | 29.0%(+0.100)#15,339 |
| 52. | Pepperell | 29.0% | 23.7%(+5.30)#52 | 29.0%(=0.000)#15,437 |
| 53. | North Scituate | 28.8% | 23.7%(+5.10)#53 | 29.0%(-0.200)#15,600 |
| 54. | Wilmington | 28.7% | 23.7%(+5.00)#54 | 29.0%(-0.300)#15,681 |
| 55. | West Wareham | 28.6% | 23.7%(+4.90)#55 | 29.0%(-0.400)#15,819 |
| 56. | Franklin Town | 28.5% | 23.7%(+4.80)#56 | 29.0%(-0.500)#15,935 |
| 57. | Abington | 28.5% | 23.7%(+4.80)#57 | 29.0%(-0.500)#15,950 |
| 58. | Attleboro | 28.3% | 23.7%(+4.60)#58 | 29.0%(-0.700)#16,109 |
| 59. | West Dennis | 28.3% | 23.7%(+4.60)#59 | 29.0%(-0.700)#16,153 |
| 60. | Westfield | 28.1% | 23.7%(+4.40)#60 | 29.0%(-0.900)#16,308 |
| 61. | Millers Falls | 27.9% | 23.7%(+4.20)#61 | 29.0%(-1.10)#16,550 |
| 62. | North Attleborough | 27.7% | 23.7%(+4.00)#62 | 29.0%(-1.30)#16,680 |
| 63. | Marshfield Hills | 27.7% | 23.7%(+4.00)#63 | 29.0%(-1.30)#16,723 |
| 64. | Cordaville | 27.6% | 23.7%(+3.90)#64 | 29.0%(-1.40)#16,808 |
| 65. | Acushnet Center | 27.4% | 23.7%(+3.70)#65 | 29.0%(-1.60)#17,003 |
| 66. | East Pepperell | 27.4% | 23.7%(+3.70)#66 | 29.0%(-1.60)#17,012 |
| 67. | Palmer Town | 27.2% | 23.7%(+3.50)#67 | 29.0%(-1.80)#17,199 |
| 68. | Brockton | 27.1% | 23.7%(+3.40)#68 | 29.0%(-1.90)#17,248 |
| 69. | Southbridge Town | 27.1% | 23.7%(+3.40)#69 | 29.0%(-1.90)#17,254 |
| 70. | Marshfield | 27.1% | 23.7%(+3.40)#70 | 29.0%(-1.90)#17,277 |
| 71. | Burlington | 27.0% | 23.7%(+3.30)#71 | 29.0%(-2.00)#17,346 |
| 72. | Winchendon | 27.0% | 23.7%(+3.30)#72 | 29.0%(-2.00)#17,369 |
| 73. | Milford | 26.9% | 23.7%(+3.20)#73 | 29.0%(-2.10)#17,446 |
| 74. | Ocean Grove | 26.9% | 23.7%(+3.20)#74 | 29.0%(-2.10)#17,473 |
| 75. | Hatfield | 26.9% | 23.7%(+3.20)#75 | 29.0%(-2.10)#17,487 |
| 76. | Haverhill | 26.8% | 23.7%(+3.10)#76 | 29.0%(-2.20)#17,532 |
| 77. | Marblehead | 26.8% | 23.7%(+3.10)#77 | 29.0%(-2.20)#17,537 |
| 78. | Lynnfield | 26.7% | 23.7%(+3.00)#78 | 29.0%(-2.30)#17,632 |
| 79. | Shelburne Falls | 26.5% | 23.7%(+2.80)#79 | 29.0%(-2.50)#17,854 |
| 80. | Peabody | 26.1% | 23.7%(+2.40)#80 | 29.0%(-2.90)#18,185 |
| 81. | Athol | 26.1% | 23.7%(+2.40)#81 | 29.0%(-2.90)#18,202 |
| 82. | Rowley | 26.1% | 23.7%(+2.40)#82 | 29.0%(-2.90)#18,243 |
| 83. | Barnstable Town | 26.0% | 23.7%(+2.30)#83 | 29.0%(-3.00)#18,297 |
| 84. | Agawam Town | 25.9% | 23.7%(+2.20)#84 | 29.0%(-3.10)#18,388 |
| 85. | Devens | 25.8% | 23.7%(+2.10)#85 | 29.0%(-3.20)#18,518 |
| 86. | Woburn | 25.7% | 23.7%(+2.00)#86 | 29.0%(-3.30)#18,571 |
| 87. | Cheshire | 25.5% | 23.7%(+1.80)#87 | 29.0%(-3.50)#18,838 |
| 88. | Nantucket | 25.3% | 23.7%(+1.60)#88 | 29.0%(-3.70)#18,966 |
| 89. | Cochituate | 25.3% | 23.7%(+1.60)#89 | 29.0%(-3.70)#18,968 |
| 90. | Norton Center | 25.2% | 23.7%(+1.50)#90 | 29.0%(-3.80)#19,095 |
| 91. | Turners Falls | 25.1% | 23.7%(+1.40)#91 | 29.0%(-3.90)#19,179 |
| 92. | Foxborough | 25.0% | 23.7%(+1.30)#92 | 29.0%(-4.00)#19,240 |
| 93. | Orange | 25.0% | 23.7%(+1.30)#93 | 29.0%(-4.00)#19,248 |
| 94. | Teaticket | 24.6% | 23.7%(+0.900)#94 | 29.0%(-4.40)#19,690 |
| 95. | Webster | 24.5% | 23.7%(+0.800)#95 | 29.0%(-4.50)#19,748 |
| 96. | Maynard | 24.5% | 23.7%(+0.800)#96 | 29.0%(-4.50)#19,751 |
| 97. | Lowell | 24.3% | 23.7%(+0.600)#97 | 29.0%(-4.70)#19,927 |
| 98. | Somerset | 24.3% | 23.7%(+0.600)#98 | 29.0%(-4.70)#19,938 |
| 99. | South Yarmouth | 24.3% | 23.7%(+0.600)#99 | 29.0%(-4.70)#19,947 |
| 100. | Walpole | 24.3% | 23.7%(+0.600)#100 | 29.0%(-4.70)#19,956 |
Common Questions
What are the Top 10 Cities with the Highest Percentage of Households With Three or more Vehicles in Massachusetts?
Top 10 Cities with the Highest Percentage of Households With Three or more Vehicles in Massachusetts are:
#1
54.4%
#2
54.2%
#3
52.6%
#4
44.5%
#5
41.9%
#6
41.4%
#7
41.0%
#8
40.9%
#9
39.8%
#10
39.5%
What city has the Highest Percentage of Households With Three or more Vehicles in Massachusetts?
South Ashburnham has the Highest Percentage of Households With Three or more Vehicles in Massachusetts with 54.4%.
What is the Percentage of Households With Three or more Vehicles in the State of Massachusetts?
Percentage of Households With Three or more Vehicles in Massachusetts is 23.7%.
What is the Percentage of Households With Three or more Vehicles in the United States?
Percentage of Households With Three or more Vehicles in the United States is 29.0%.