Cities with the Highest Percentage of Households With Three or more Vehicles in Ohio
RELATED REPORTS & OPTIONS
Households with 3 or more Cars
Ohio
Compare Cities
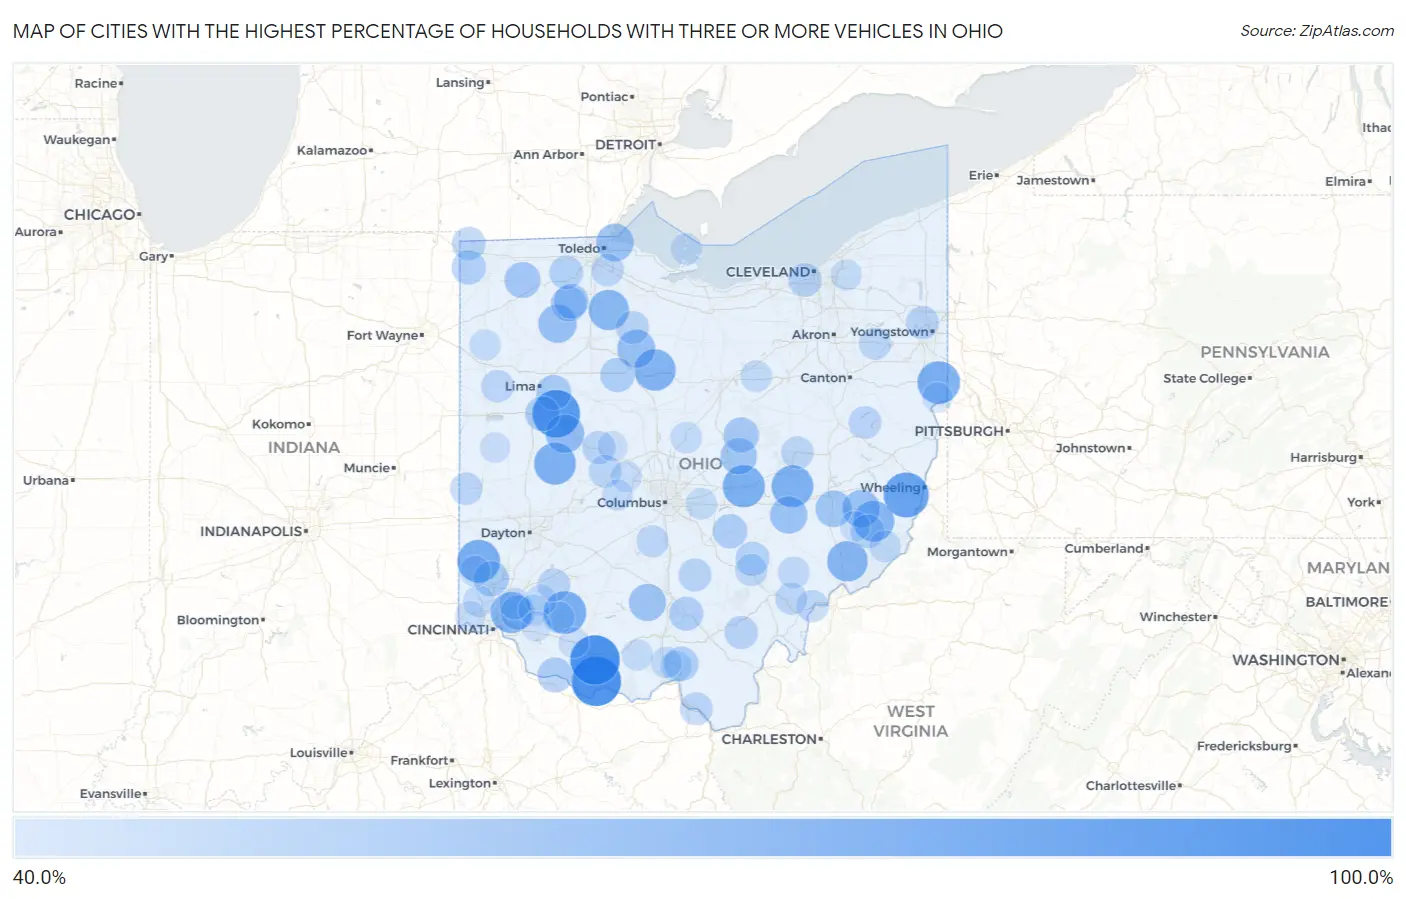
Map of Cities with the Highest Percentage of Households With Three or more Vehicles in Ohio
0.0%
100.0%
Cities with the Highest Percentage of Households With Three or more Vehicles in Ohio
| City | Housholds With 3+ Cars | vs State | vs National | |
| 1. | Bentonville | 100.0% | 28.1%(+71.9)#1 | 29.0%(+71.0)#89 |
| 2. | Cherry Fork | 100.0% | 28.1%(+71.9)#2 | 29.0%(+71.0)#264 |
| 3. | New Hampshire | 94.6% | 28.1%(+66.5)#3 | 29.0%(+65.6)#395 |
| 4. | Glencoe | 87.9% | 28.1%(+59.8)#4 | 29.0%(+58.9)#447 |
| 5. | Sullivan | 85.3% | 28.1%(+57.2)#5 | 29.0%(+56.3)#484 |
| 6. | Somerville | 82.0% | 28.1%(+53.9)#6 | 29.0%(+53.0)#544 |
| 7. | Lake Tomahawk | 81.5% | 28.1%(+53.4)#7 | 29.0%(+52.5)#552 |
| 8. | St Martin | 81.3% | 28.1%(+53.2)#8 | 29.0%(+52.3)#556 |
| 9. | Marne | 80.2% | 28.1%(+52.1)#9 | 29.0%(+51.2)#573 |
| 10. | Rosewood | 79.5% | 28.1%(+51.4)#10 | 29.0%(+50.5)#598 |
| 11. | Adamsville | 79.3% | 28.1%(+51.2)#11 | 29.0%(+50.3)#602 |
| 12. | Oceola | 78.4% | 28.1%(+50.3)#12 | 29.0%(+49.4)#631 |
| 13. | Concorde Hills | 77.5% | 28.1%(+49.4)#13 | 29.0%(+48.5)#651 |
| 14. | Miltonsburg | 76.5% | 28.1%(+48.4)#14 | 29.0%(+47.5)#680 |
| 15. | Lower Salem | 76.2% | 28.1%(+48.1)#15 | 29.0%(+47.2)#694 |
| 16. | Woodsdale | 75.9% | 28.1%(+47.8)#16 | 29.0%(+46.9)#705 |
| 17. | West Millgrove | 75.7% | 28.1%(+47.6)#17 | 29.0%(+46.7)#712 |
| 18. | Maria Stein | 71.2% | 28.1%(+43.1)#18 | 29.0%(+42.2)#854 |
| 19. | Lewistown | 71.1% | 28.1%(+43.0)#19 | 29.0%(+42.1)#857 |
| 20. | Belmore | 70.0% | 28.1%(+41.9)#20 | 29.0%(+41.0)#894 |
| 21. | Mccutchenville | 69.7% | 28.1%(+41.6)#21 | 29.0%(+40.7)#904 |
| 22. | Harbor View | 68.4% | 28.1%(+40.3)#22 | 29.0%(+39.4)#963 |
| 23. | Batesville | 68.4% | 28.1%(+40.3)#23 | 29.0%(+39.4)#966 |
| 24. | Duncan Falls | 67.9% | 28.1%(+39.8)#24 | 29.0%(+38.9)#991 |
| 25. | Bourneville | 67.1% | 28.1%(+39.0)#25 | 29.0%(+38.1)#1,038 |
| 26. | Buffalo | 65.6% | 28.1%(+37.5)#26 | 29.0%(+36.6)#1,140 |
| 27. | Martinsburg | 65.4% | 28.1%(+37.3)#27 | 29.0%(+36.4)#1,158 |
| 28. | Ridgeville Corners | 64.3% | 28.1%(+36.2)#28 | 29.0%(+35.3)#1,228 |
| 29. | Jacksontown | 63.5% | 28.1%(+35.4)#29 | 29.0%(+34.5)#1,290 |
| 30. | Custar | 63.2% | 28.1%(+35.1)#30 | 29.0%(+34.2)#1,307 |
| 31. | Howard | 62.4% | 28.1%(+34.3)#31 | 29.0%(+33.4)#1,377 |
| 32. | Williamsdale | 62.1% | 28.1%(+34.0)#32 | 29.0%(+33.1)#1,405 |
| 33. | Westminster | 61.9% | 28.1%(+33.8)#33 | 29.0%(+32.9)#1,421 |
| 34. | Higginsport | 61.4% | 28.1%(+33.3)#34 | 29.0%(+32.4)#1,472 |
| 35. | Nankin | 61.3% | 28.1%(+33.2)#35 | 29.0%(+32.3)#1,478 |
| 36. | Milton Center | 61.1% | 28.1%(+33.0)#36 | 29.0%(+32.1)#1,510 |
| 37. | St Johns | 60.9% | 28.1%(+32.8)#37 | 29.0%(+31.9)#1,531 |
| 38. | Brandt | 60.4% | 28.1%(+32.3)#38 | 29.0%(+31.4)#1,578 |
| 39. | Rushville | 60.2% | 28.1%(+32.1)#39 | 29.0%(+31.2)#1,593 |
| 40. | Minford | 60.0% | 28.1%(+31.9)#40 | 29.0%(+31.0)#1,606 |
| 41. | Miamiville | 60.0% | 28.1%(+31.9)#41 | 29.0%(+31.0)#1,617 |
| 42. | Kirby | 60.0% | 28.1%(+31.9)#42 | 29.0%(+31.0)#1,638 |
| 43. | Ai | 59.4% | 28.1%(+31.3)#43 | 29.0%(+30.4)#1,707 |
| 44. | Richmond Dale | 59.1% | 28.1%(+31.0)#44 | 29.0%(+30.1)#1,743 |
| 45. | Blakeslee | 59.1% | 28.1%(+31.0)#45 | 29.0%(+30.1)#1,752 |
| 46. | New Straitsville | 59.0% | 28.1%(+30.9)#46 | 29.0%(+30.0)#1,759 |
| 47. | Neapolis | 58.6% | 28.1%(+30.5)#47 | 29.0%(+29.6)#1,800 |
| 48. | Newport Cdp Washington County | 58.3% | 28.1%(+30.2)#48 | 29.0%(+29.3)#1,832 |
| 49. | Nettle Lake | 58.1% | 28.1%(+30.0)#49 | 29.0%(+29.1)#1,872 |
| 50. | Lewisville | 57.9% | 28.1%(+29.8)#50 | 29.0%(+28.9)#1,887 |
| 51. | Linndale | 57.7% | 28.1%(+29.6)#51 | 29.0%(+28.7)#1,912 |
| 52. | Bascom | 57.1% | 28.1%(+29.0)#52 | 29.0%(+28.1)#1,968 |
| 53. | East Liberty | 57.0% | 28.1%(+28.9)#53 | 29.0%(+28.0)#2,001 |
| 54. | Wilkesville | 57.0% | 28.1%(+28.9)#54 | 29.0%(+28.0)#2,004 |
| 55. | Hilltop | 56.9% | 28.1%(+28.8)#55 | 29.0%(+27.9)#2,015 |
| 56. | Laurelville | 56.6% | 28.1%(+28.5)#56 | 29.0%(+27.6)#2,054 |
| 57. | Clarksville | 56.4% | 28.1%(+28.3)#57 | 29.0%(+27.4)#2,077 |
| 58. | Sherrodsville | 56.0% | 28.1%(+27.9)#58 | 29.0%(+27.0)#2,150 |
| 59. | Hanging Rock | 56.0% | 28.1%(+27.9)#59 | 29.0%(+27.0)#2,153 |
| 60. | Birmingham | 56.0% | 28.1%(+27.9)#60 | 29.0%(+27.0)#2,156 |
| 61. | Woodstock | 55.6% | 28.1%(+27.5)#61 | 29.0%(+26.6)#2,207 |
| 62. | Elgin | 55.6% | 28.1%(+27.5)#62 | 29.0%(+26.6)#2,212 |
| 63. | Stony Ridge | 55.4% | 28.1%(+27.3)#63 | 29.0%(+26.4)#2,244 |
| 64. | Palestine | 55.4% | 28.1%(+27.3)#64 | 29.0%(+26.4)#2,252 |
| 65. | Bass Lake | 55.2% | 28.1%(+27.1)#65 | 29.0%(+26.2)#2,274 |
| 66. | Canal Lewisville | 55.1% | 28.1%(+27.0)#66 | 29.0%(+26.1)#2,289 |
| 67. | Carbon Hill | 54.5% | 28.1%(+26.4)#67 | 29.0%(+25.5)#2,382 |
| 68. | Atwater | 54.3% | 28.1%(+26.2)#68 | 29.0%(+25.3)#2,410 |
| 69. | Little Hocking | 54.3% | 28.1%(+26.2)#69 | 29.0%(+25.3)#2,411 |
| 70. | Stewart | 54.1% | 28.1%(+26.0)#70 | 29.0%(+25.1)#2,451 |
| 71. | Darbyville | 54.1% | 28.1%(+26.0)#71 | 29.0%(+25.1)#2,454 |
| 72. | Medway | 53.8% | 28.1%(+25.7)#72 | 29.0%(+24.8)#2,490 |
| 73. | Chesterhill | 53.5% | 28.1%(+25.4)#73 | 29.0%(+24.5)#2,568 |
| 74. | Antioch | 53.3% | 28.1%(+25.2)#74 | 29.0%(+24.3)#2,610 |
| 75. | Roachester | 53.2% | 28.1%(+25.1)#75 | 29.0%(+24.2)#2,629 |
| 76. | Fayetteville | 53.2% | 28.1%(+25.1)#76 | 29.0%(+24.2)#2,637 |
| 77. | Jeromesville | 53.0% | 28.1%(+24.9)#77 | 29.0%(+24.0)#2,670 |
| 78. | Marengo | 52.8% | 28.1%(+24.7)#78 | 29.0%(+23.8)#2,722 |
| 79. | Dunlap | 52.7% | 28.1%(+24.6)#79 | 29.0%(+23.7)#2,731 |
| 80. | Clarktown | 52.7% | 28.1%(+24.6)#80 | 29.0%(+23.7)#2,733 |
| 81. | Lucasville | 52.5% | 28.1%(+24.4)#81 | 29.0%(+23.5)#2,767 |
| 82. | Sixteen Mile Stand | 52.4% | 28.1%(+24.3)#82 | 29.0%(+23.4)#2,792 |
| 83. | Etna | 52.3% | 28.1%(+24.2)#83 | 29.0%(+23.3)#2,821 |
| 84. | Put In Bay | 52.2% | 28.1%(+24.1)#84 | 29.0%(+23.2)#2,857 |
| 85. | Hunting Valley | 52.1% | 28.1%(+24.0)#85 | 29.0%(+23.1)#2,866 |
| 86. | Haviland | 52.1% | 28.1%(+24.0)#86 | 29.0%(+23.1)#2,875 |
| 87. | Rarden | 52.1% | 28.1%(+24.0)#87 | 29.0%(+23.1)#2,878 |
| 88. | Unionville Center | 52.0% | 28.1%(+23.9)#88 | 29.0%(+23.0)#2,898 |
| 89. | Butlerville | 52.0% | 28.1%(+23.9)#89 | 29.0%(+23.0)#2,900 |
| 90. | Goshen | 51.8% | 28.1%(+23.7)#90 | 29.0%(+22.8)#2,930 |
| 91. | Darrtown | 51.7% | 28.1%(+23.6)#91 | 29.0%(+22.7)#2,948 |
| 92. | Plumwood | 51.5% | 28.1%(+23.4)#92 | 29.0%(+22.5)#2,991 |
| 93. | Sardinia | 50.4% | 28.1%(+22.3)#93 | 29.0%(+21.4)#3,189 |
| 94. | Glenmoor | 50.3% | 28.1%(+22.2)#94 | 29.0%(+21.3)#3,202 |
| 95. | Grandview | 50.2% | 28.1%(+22.1)#95 | 29.0%(+21.2)#3,222 |
| 96. | South Mount Vernon | 50.0% | 28.1%(+21.9)#96 | 29.0%(+21.0)#3,253 |
| 97. | Summerfield | 50.0% | 28.1%(+21.9)#97 | 29.0%(+21.0)#3,301 |
| 98. | Raymond | 50.0% | 28.1%(+21.9)#98 | 29.0%(+21.0)#3,321 |
| 99. | Yorkshire | 50.0% | 28.1%(+21.9)#99 | 29.0%(+21.0)#3,369 |
| 100. | Owensville | 49.3% | 28.1%(+21.2)#100 | 29.0%(+20.3)#3,540 |
Common Questions
What are the Top 10 Cities with the Highest Percentage of Households With Three or more Vehicles in Ohio?
Top 10 Cities with the Highest Percentage of Households With Three or more Vehicles in Ohio are:
#1
100.0%
#2
100.0%
#3
94.6%
#4
87.9%
#5
82.0%
#6
81.5%
#7
81.3%
#8
80.2%
#9
79.5%
#10
79.3%
What city has the Highest Percentage of Households With Three or more Vehicles in Ohio?
Bentonville has the Highest Percentage of Households With Three or more Vehicles in Ohio with 100.0%.
What is the Percentage of Households With Three or more Vehicles in the State of Ohio?
Percentage of Households With Three or more Vehicles in Ohio is 28.1%.
What is the Percentage of Households With Three or more Vehicles in the United States?
Percentage of Households With Three or more Vehicles in the United States is 29.0%.