Cities with the Highest Percentage of Households With Three or more Vehicles in Indiana
RELATED REPORTS & OPTIONS
Households with 3 or more Cars
Indiana
Compare Cities
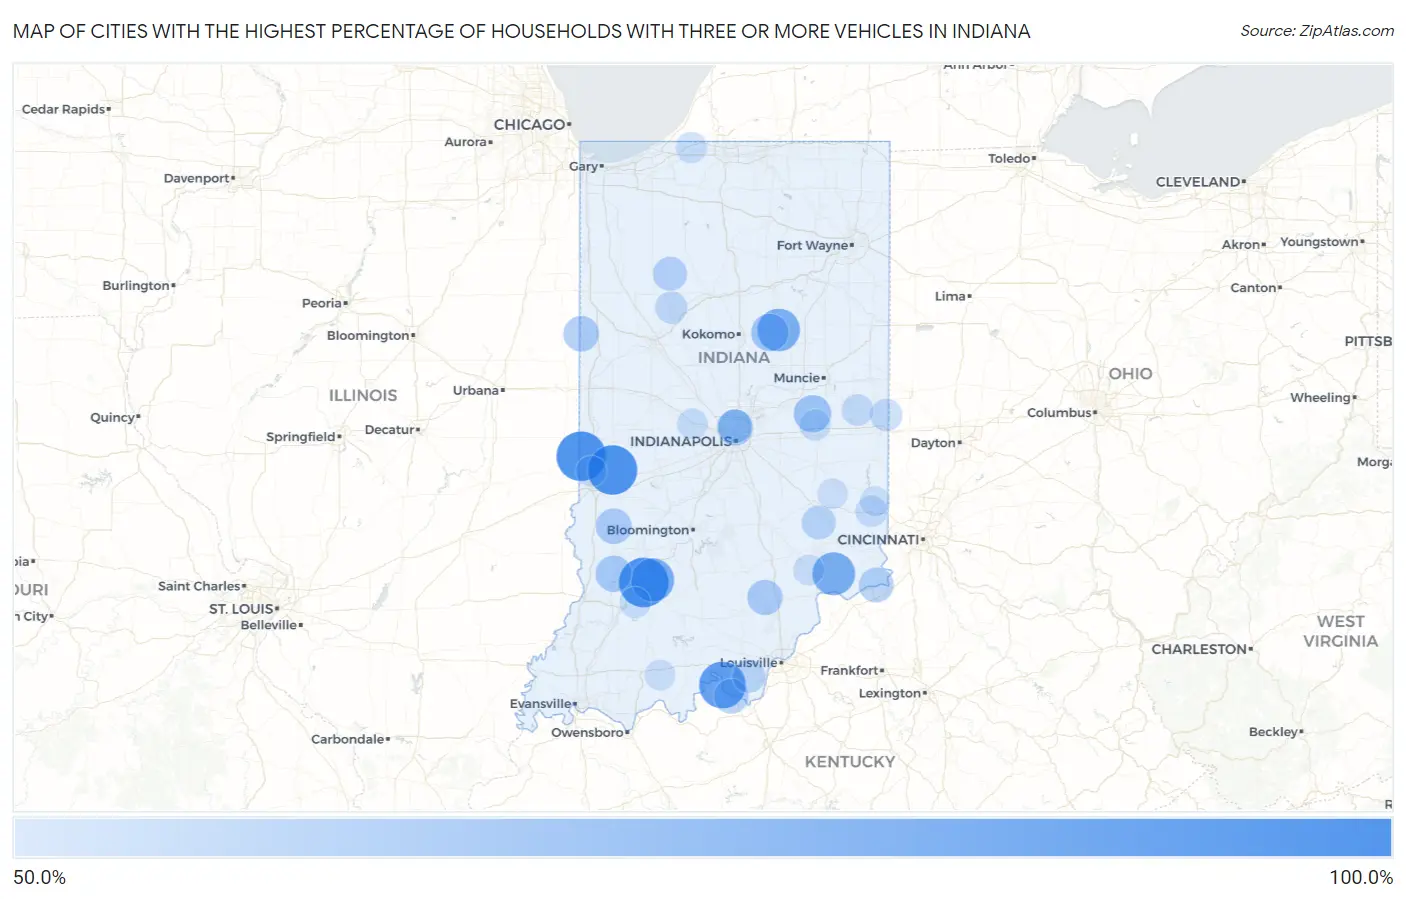
Map of Cities with the Highest Percentage of Households With Three or more Vehicles in Indiana
0.0%
100.0%
Cities with the Highest Percentage of Households With Three or more Vehicles in Indiana
| City | Housholds With 3+ Cars | vs State | vs National | |
| 1. | Lewis | 100.0% | 30.3%(+69.7)#1 | 29.0%(+71.0)#15 |
| 2. | Servia | 100.0% | 30.3%(+69.7)#2 | 29.0%(+71.0)#26 |
| 3. | Mongo | 100.0% | 30.3%(+69.7)#3 | 29.0%(+71.0)#38 |
| 4. | Blooming Grove | 100.0% | 30.3%(+69.7)#4 | 29.0%(+71.0)#48 |
| 5. | Millville | 100.0% | 30.3%(+69.7)#5 | 29.0%(+71.0)#86 |
| 6. | Eminence | 100.0% | 30.3%(+69.7)#6 | 29.0%(+71.0)#104 |
| 7. | Cory | 100.0% | 30.3%(+69.7)#7 | 29.0%(+71.0)#106 |
| 8. | Blanford | 100.0% | 30.3%(+69.7)#9 | 29.0%(+71.0)#109 |
| 9. | Stone Bluff | 100.0% | 30.3%(+69.7)#10 | 29.0%(+71.0)#110 |
| 10. | Fontanet | 100.0% | 30.3%(+69.7)#11 | 29.0%(+71.0)#112 |
| 11. | Sardinia | 100.0% | 30.3%(+69.7)#12 | 29.0%(+71.0)#153 |
| 12. | Raglesville | 100.0% | 30.3%(+69.7)#13 | 29.0%(+71.0)#159 |
| 13. | Fairview | 100.0% | 30.3%(+69.7)#14 | 29.0%(+71.0)#177 |
| 14. | Buckskin | 100.0% | 30.3%(+69.7)#15 | 29.0%(+71.0)#217 |
| 15. | Warrington | 100.0% | 30.3%(+69.7)#16 | 29.0%(+71.0)#239 |
| 16. | Pulaski | 100.0% | 30.3%(+69.7)#17 | 29.0%(+71.0)#244 |
| 17. | Independence | 100.0% | 30.3%(+69.7)#18 | 29.0%(+71.0)#299 |
| 18. | Hamburg | 100.0% | 30.3%(+69.7)#19 | 29.0%(+71.0)#305 |
| 19. | Roll | 100.0% | 30.3%(+69.7)#20 | 29.0%(+71.0)#306 |
| 20. | Paris Crossing | 100.0% | 30.3%(+69.7)#21 | 29.0%(+71.0)#311 |
| 21. | Sandusky | 100.0% | 30.3%(+69.7)#22 | 29.0%(+71.0)#317 |
| 22. | Stanford | 99.1% | 30.3%(+68.8)#23 | 29.0%(+70.1)#388 |
| 23. | New Amsterdam | 93.5% | 30.3%(+63.2)#24 | 29.0%(+64.5)#402 |
| 24. | Waverly | 92.7% | 30.3%(+62.4)#25 | 29.0%(+63.7)#405 |
| 25. | Fairbanks | 92.4% | 30.3%(+62.1)#26 | 29.0%(+63.4)#406 |
| 26. | Schaefer Lake | 92.4% | 30.3%(+62.1)#27 | 29.0%(+63.4)#407 |
| 27. | Homer | 90.9% | 30.3%(+60.6)#28 | 29.0%(+61.9)#413 |
| 28. | New Lebanon | 88.5% | 30.3%(+58.2)#29 | 29.0%(+59.5)#431 |
| 29. | Coesse | 88.2% | 30.3%(+57.9)#30 | 29.0%(+59.2)#440 |
| 30. | Lamb | 87.0% | 30.3%(+56.7)#31 | 29.0%(+58.0)#457 |
| 31. | Burns City | 85.7% | 30.3%(+55.4)#32 | 29.0%(+56.7)#476 |
| 32. | Browns Crossing | 85.5% | 30.3%(+55.2)#33 | 29.0%(+56.5)#482 |
| 33. | Judyville | 85.5% | 30.3%(+55.2)#34 | 29.0%(+56.5)#483 |
| 34. | Reddington | 84.9% | 30.3%(+54.6)#35 | 29.0%(+55.9)#492 |
| 35. | Canaan | 84.7% | 30.3%(+54.4)#36 | 29.0%(+55.7)#495 |
| 36. | Wellsboro | 84.2% | 30.3%(+53.9)#37 | 29.0%(+55.2)#498 |
| 37. | Herbst | 84.1% | 30.3%(+53.8)#38 | 29.0%(+55.1)#502 |
| 38. | Pleasant Mills | 83.3% | 30.3%(+53.0)#39 | 29.0%(+54.3)#512 |
| 39. | Urbana | 82.5% | 30.3%(+52.2)#40 | 29.0%(+53.5)#535 |
| 40. | Newbern | 81.0% | 30.3%(+50.7)#41 | 29.0%(+52.0)#562 |
| 41. | Eckerty | 78.9% | 30.3%(+48.6)#42 | 29.0%(+49.9)#617 |
| 42. | Delaware | 78.1% | 30.3%(+47.8)#43 | 29.0%(+49.1)#633 |
| 43. | Hessen Cassel | 77.1% | 30.3%(+46.8)#44 | 29.0%(+48.1)#662 |
| 44. | Bethel | 76.2% | 30.3%(+45.9)#45 | 29.0%(+47.2)#689 |
| 45. | Solsberry | 76.1% | 30.3%(+45.8)#46 | 29.0%(+47.1)#698 |
| 46. | Eden | 75.6% | 30.3%(+45.3)#47 | 29.0%(+46.6)#714 |
| 47. | Burrows | 75.0% | 30.3%(+44.7)#48 | 29.0%(+46.0)#732 |
| 48. | Celestine | 74.5% | 30.3%(+44.2)#49 | 29.0%(+45.5)#760 |
| 49. | Center | 74.3% | 30.3%(+44.0)#50 | 29.0%(+45.3)#766 |
| 50. | Sims | 72.9% | 30.3%(+42.6)#51 | 29.0%(+43.9)#806 |
| 51. | Cadiz | 72.5% | 30.3%(+42.2)#52 | 29.0%(+43.5)#818 |
| 52. | Keystone | 71.8% | 30.3%(+41.5)#53 | 29.0%(+42.8)#836 |
| 53. | Mariah Hill | 70.0% | 30.3%(+39.7)#54 | 29.0%(+41.0)#893 |
| 54. | Westphalia | 70.0% | 30.3%(+39.7)#55 | 29.0%(+41.0)#896 |
| 55. | Abington | 69.7% | 30.3%(+39.4)#56 | 29.0%(+40.7)#905 |
| 56. | Crows Nest | 69.6% | 30.3%(+39.3)#57 | 29.0%(+40.6)#910 |
| 57. | Lyford | 69.4% | 30.3%(+39.1)#58 | 29.0%(+40.4)#916 |
| 58. | Raub | 69.2% | 30.3%(+38.9)#59 | 29.0%(+40.2)#925 |
| 59. | Spencerville | 68.8% | 30.3%(+38.5)#60 | 29.0%(+39.8)#940 |
| 60. | Grammer | 68.8% | 30.3%(+38.5)#61 | 29.0%(+39.8)#941 |
| 61. | Coalmont | 68.6% | 30.3%(+38.3)#62 | 29.0%(+39.6)#951 |
| 62. | Ambia | 68.4% | 30.3%(+38.1)#63 | 29.0%(+39.4)#962 |
| 63. | Little York | 67.9% | 30.3%(+37.6)#64 | 29.0%(+38.9)#995 |
| 64. | Malden | 66.7% | 30.3%(+36.4)#65 | 29.0%(+37.7)#1,052 |
| 65. | Florence | 66.7% | 30.3%(+36.4)#66 | 29.0%(+37.7)#1,070 |
| 66. | Mauckport | 66.7% | 30.3%(+36.4)#67 | 29.0%(+37.7)#1,077 |
| 67. | Carrollton | 66.4% | 30.3%(+36.1)#68 | 29.0%(+37.4)#1,100 |
| 68. | Burnett | 66.2% | 30.3%(+35.9)#69 | 29.0%(+37.2)#1,114 |
| 69. | Prairieton | 65.4% | 30.3%(+35.1)#70 | 29.0%(+36.4)#1,154 |
| 70. | Buffalo | 65.0% | 30.3%(+34.7)#71 | 29.0%(+36.0)#1,176 |
| 71. | Millhousen | 64.7% | 30.3%(+34.4)#72 | 29.0%(+35.7)#1,199 |
| 72. | Wawaka | 64.3% | 30.3%(+34.0)#73 | 29.0%(+35.3)#1,232 |
| 73. | North Crows Nest | 64.3% | 30.3%(+34.0)#74 | 29.0%(+35.3)#1,234 |
| 74. | Marshfield | 64.0% | 30.3%(+33.7)#75 | 29.0%(+35.0)#1,252 |
| 75. | Tyner | 63.2% | 30.3%(+32.9)#76 | 29.0%(+34.2)#1,305 |
| 76. | New Middletown | 63.2% | 30.3%(+32.9)#77 | 29.0%(+34.2)#1,310 |
| 77. | Maples | 62.2% | 30.3%(+31.9)#78 | 29.0%(+33.2)#1,403 |
| 78. | Harrison Lake | 62.1% | 30.3%(+31.8)#79 | 29.0%(+33.1)#1,410 |
| 79. | Yeoman | 61.2% | 30.3%(+30.9)#80 | 29.0%(+32.2)#1,495 |
| 80. | Otter Lake | 60.9% | 30.3%(+30.6)#81 | 29.0%(+31.9)#1,530 |
| 81. | Whitewater | 60.9% | 30.3%(+30.6)#82 | 29.0%(+31.9)#1,536 |
| 82. | Amity | 60.8% | 30.3%(+30.5)#83 | 29.0%(+31.8)#1,540 |
| 83. | Arthur | 60.8% | 30.3%(+30.5)#84 | 29.0%(+31.8)#1,541 |
| 84. | Taswell | 60.6% | 30.3%(+30.3)#85 | 29.0%(+31.6)#1,560 |
| 85. | St Leon | 60.1% | 30.3%(+29.8)#86 | 29.0%(+31.1)#1,597 |
| 86. | Economy | 60.0% | 30.3%(+29.7)#87 | 29.0%(+31.0)#1,621 |
| 87. | Bowling Green | 59.1% | 30.3%(+28.8)#88 | 29.0%(+30.1)#1,744 |
| 88. | Greensboro | 59.1% | 30.3%(+28.8)#89 | 29.0%(+30.1)#1,750 |
| 89. | Hudson Lake | 59.0% | 30.3%(+28.7)#90 | 29.0%(+30.0)#1,756 |
| 90. | Montgomery | 59.0% | 30.3%(+28.7)#91 | 29.0%(+30.0)#1,757 |
| 91. | Ramsey | 59.0% | 30.3%(+28.7)#92 | 29.0%(+30.0)#1,761 |
| 92. | Andersonville | 58.8% | 30.3%(+28.5)#93 | 29.0%(+29.8)#1,778 |
| 93. | Lizton | 58.6% | 30.3%(+28.3)#94 | 29.0%(+29.6)#1,798 |
| 94. | Dupont | 58.3% | 30.3%(+28.0)#95 | 29.0%(+29.3)#1,838 |
| 95. | Laud | 58.3% | 30.3%(+28.0)#96 | 29.0%(+29.3)#1,845 |
| 96. | Tecumseh | 58.2% | 30.3%(+27.9)#97 | 29.0%(+29.2)#1,853 |
| 97. | St Meinrad | 58.2% | 30.3%(+27.9)#98 | 29.0%(+29.2)#1,854 |
| 98. | Lake Santee | 57.6% | 30.3%(+27.3)#99 | 29.0%(+28.6)#1,925 |
| 99. | Cedar Grove | 56.8% | 30.3%(+26.5)#100 | 29.0%(+27.8)#2,032 |
| 100. | Lake Everett | 56.7% | 30.3%(+26.4)#101 | 29.0%(+27.7)#2,050 |
Common Questions
What are the Top 10 Cities with the Highest Percentage of Households With Three or more Vehicles in Indiana?
Top 10 Cities with the Highest Percentage of Households With Three or more Vehicles in Indiana are:
#1
100.0%
#2
100.0%
#3
100.0%
#4
93.5%
#5
85.7%
#6
84.7%
#7
84.1%
#8
72.9%
#9
72.5%
#10
70.0%
What city has the Highest Percentage of Households With Three or more Vehicles in Indiana?
Blanford has the Highest Percentage of Households With Three or more Vehicles in Indiana with 100.0%.
What is the Percentage of Households With Three or more Vehicles in the State of Indiana?
Percentage of Households With Three or more Vehicles in Indiana is 30.3%.
What is the Percentage of Households With Three or more Vehicles in the United States?
Percentage of Households With Three or more Vehicles in the United States is 29.0%.