Cities with the Highest Percentage of Households With Three or more Vehicles in Illinois
RELATED REPORTS & OPTIONS
Households with 3 or more Cars
Illinois
Compare Cities
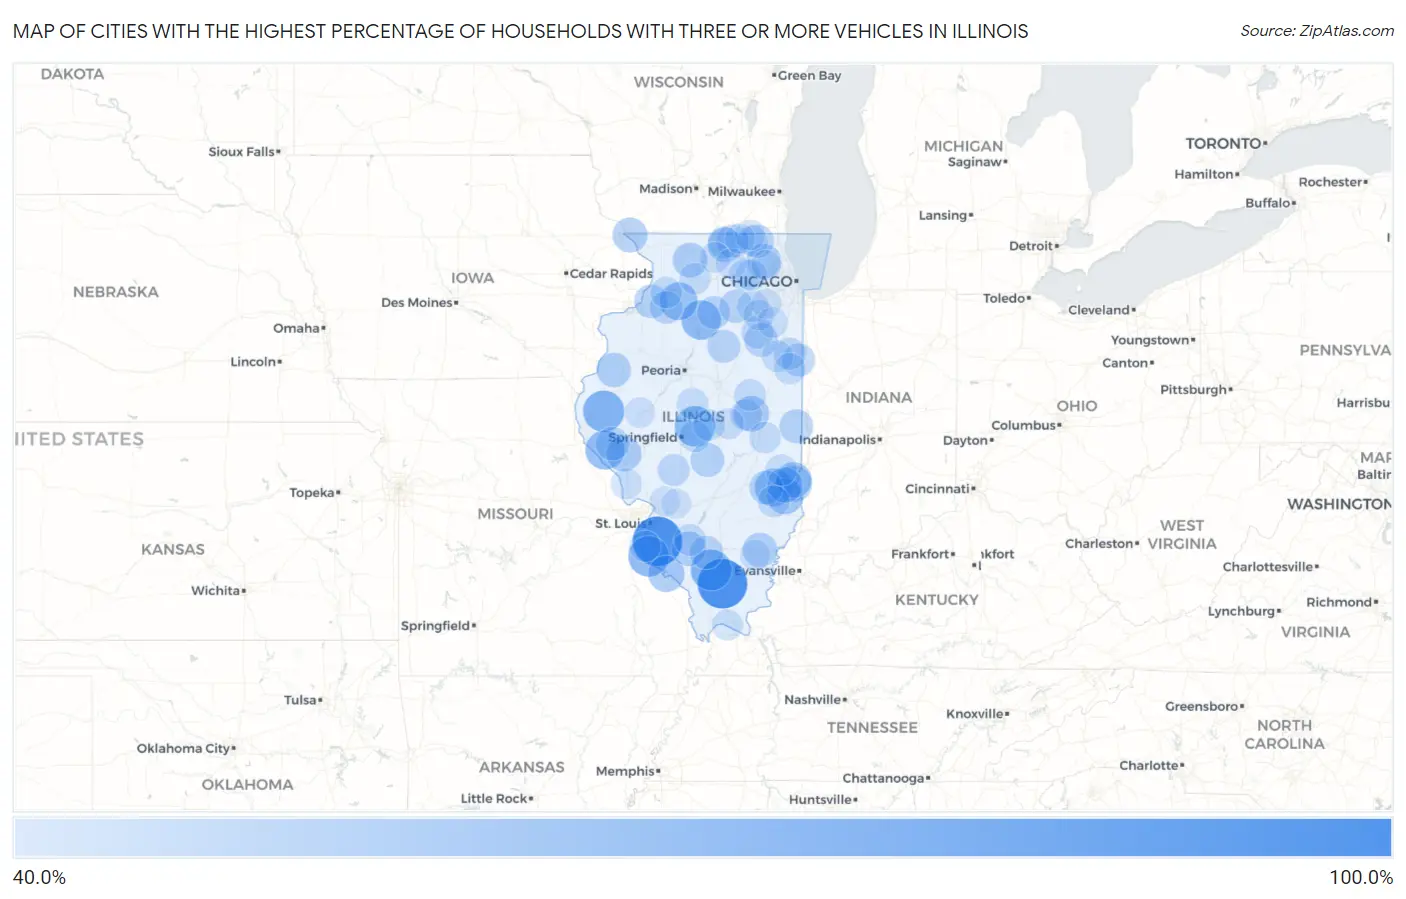
Map of Cities with the Highest Percentage of Households With Three or more Vehicles in Illinois
0.0%
100.0%
Cities with the Highest Percentage of Households With Three or more Vehicles in Illinois
| City | Housholds With 3+ Cars | vs State | vs National | |
| 1. | Serena | 100.0% | 24.5%(+75.5)#1 | 29.0%(+71.0)#75 |
| 2. | Whiteash | 100.0% | 24.5%(+75.5)#2 | 29.0%(+71.0)#90 |
| 3. | Bloomfield | 100.0% | 24.5%(+75.5)#3 | 29.0%(+71.0)#157 |
| 4. | Beverly | 100.0% | 24.5%(+75.5)#4 | 29.0%(+71.0)#200 |
| 5. | Floraville | 100.0% | 24.5%(+75.5)#5 | 29.0%(+71.0)#307 |
| 6. | Merritt | 100.0% | 24.5%(+75.5)#6 | 29.0%(+71.0)#325 |
| 7. | Nekoma | 90.9% | 24.5%(+66.4)#7 | 29.0%(+61.9)#415 |
| 8. | Osco | 83.8% | 24.5%(+59.3)#8 | 29.0%(+54.8)#508 |
| 9. | La Prairie | 76.5% | 24.5%(+52.0)#9 | 29.0%(+47.5)#681 |
| 10. | Mulkeytown | 75.8% | 24.5%(+51.3)#10 | 29.0%(+46.8)#709 |
| 11. | Fults | 75.0% | 24.5%(+50.5)#11 | 29.0%(+46.0)#749 |
| 12. | Paloma | 74.2% | 24.5%(+49.7)#12 | 29.0%(+45.2)#770 |
| 13. | Cornland | 73.9% | 24.5%(+49.4)#13 | 29.0%(+44.9)#776 |
| 14. | East Lynn | 72.7% | 24.5%(+48.2)#14 | 29.0%(+43.7)#808 |
| 15. | Hollowayville | 71.4% | 24.5%(+46.9)#15 | 29.0%(+42.4)#844 |
| 16. | El Dara | 70.4% | 24.5%(+45.9)#16 | 29.0%(+41.4)#877 |
| 17. | Rockport | 68.6% | 24.5%(+44.1)#17 | 29.0%(+39.6)#952 |
| 18. | Yale | 66.7% | 24.5%(+42.2)#18 | 29.0%(+37.7)#1,068 |
| 19. | Deer Grove | 66.7% | 24.5%(+42.2)#19 | 29.0%(+37.7)#1,078 |
| 20. | Cable | 65.2% | 24.5%(+40.7)#20 | 29.0%(+36.2)#1,168 |
| 21. | Wilton Center | 64.2% | 24.5%(+39.7)#21 | 29.0%(+35.2)#1,243 |
| 22. | Rest Haven | 63.0% | 24.5%(+38.5)#22 | 29.0%(+34.0)#1,324 |
| 23. | West York | 62.5% | 24.5%(+38.0)#23 | 29.0%(+33.5)#1,356 |
| 24. | Kaskaskia | 62.5% | 24.5%(+38.0)#24 | 29.0%(+33.5)#1,371 |
| 25. | Stoy | 62.2% | 24.5%(+37.7)#25 | 29.0%(+33.2)#1,399 |
| 26. | Burton | 61.8% | 24.5%(+37.3)#26 | 29.0%(+32.8)#1,438 |
| 27. | West Union | 60.9% | 24.5%(+36.4)#27 | 29.0%(+31.9)#1,532 |
| 28. | Seymour | 60.7% | 24.5%(+36.2)#28 | 29.0%(+31.7)#1,546 |
| 29. | Annapolis | 60.0% | 24.5%(+35.5)#29 | 29.0%(+31.0)#1,636 |
| 30. | Milton | 59.4% | 24.5%(+34.9)#30 | 29.0%(+30.4)#1,710 |
| 31. | Menominee | 58.5% | 24.5%(+34.0)#31 | 29.0%(+29.5)#1,812 |
| 32. | Barrington Hills | 58.2% | 24.5%(+33.7)#32 | 29.0%(+29.2)#1,851 |
| 33. | Adeline | 58.1% | 24.5%(+33.6)#33 | 29.0%(+29.1)#1,874 |
| 34. | Timberlane | 57.7% | 24.5%(+33.2)#34 | 29.0%(+28.7)#1,905 |
| 35. | Burnt Prairie | 57.7% | 24.5%(+33.2)#35 | 29.0%(+28.7)#1,917 |
| 36. | Raritan | 57.4% | 24.5%(+32.9)#36 | 29.0%(+28.4)#1,947 |
| 37. | Oakdale | 57.3% | 24.5%(+32.8)#37 | 29.0%(+28.3)#1,952 |
| 38. | Edgington | 56.3% | 24.5%(+31.8)#38 | 29.0%(+27.3)#2,088 |
| 39. | Owaneco | 56.0% | 24.5%(+31.5)#39 | 29.0%(+27.0)#2,145 |
| 40. | Rose Hill | 55.6% | 24.5%(+31.1)#40 | 29.0%(+26.6)#2,222 |
| 41. | Hillsdale | 55.4% | 24.5%(+30.9)#41 | 29.0%(+26.4)#2,245 |
| 42. | Olivet | 55.4% | 24.5%(+30.9)#42 | 29.0%(+26.4)#2,254 |
| 43. | Reddick | 55.2% | 24.5%(+30.7)#43 | 29.0%(+26.2)#2,281 |
| 44. | Sheridan | 55.0% | 24.5%(+30.5)#44 | 29.0%(+26.0)#2,302 |
| 45. | New Salem | 54.5% | 24.5%(+30.0)#45 | 29.0%(+25.5)#2,378 |
| 46. | Gulfport | 54.5% | 24.5%(+30.0)#46 | 29.0%(+25.5)#2,386 |
| 47. | Plum Valley | 54.1% | 24.5%(+29.6)#47 | 29.0%(+25.1)#2,450 |
| 48. | Du Bois | 54.1% | 24.5%(+29.6)#48 | 29.0%(+25.1)#2,458 |
| 49. | Ringwood | 53.8% | 24.5%(+29.3)#49 | 29.0%(+24.8)#2,489 |
| 50. | Iroquois | 53.7% | 24.5%(+29.2)#50 | 29.0%(+24.7)#2,522 |
| 51. | Long Point | 53.7% | 24.5%(+29.2)#51 | 29.0%(+24.7)#2,524 |
| 52. | Dundas | 53.5% | 24.5%(+29.0)#52 | 29.0%(+24.5)#2,570 |
| 53. | Troy Grove | 53.5% | 24.5%(+29.0)#53 | 29.0%(+24.5)#2,571 |
| 54. | Capron | 53.2% | 24.5%(+28.7)#54 | 29.0%(+24.2)#2,621 |
| 55. | Hooppole | 53.0% | 24.5%(+28.5)#55 | 29.0%(+24.0)#2,677 |
| 56. | Gardner | 51.4% | 24.5%(+26.9)#56 | 29.0%(+22.4)#3,002 |
| 57. | Martinton | 50.9% | 24.5%(+26.4)#57 | 29.0%(+21.9)#3,094 |
| 58. | Standard City | 50.9% | 24.5%(+26.4)#58 | 29.0%(+21.9)#3,096 |
| 59. | Caledonia | 50.6% | 24.5%(+26.1)#59 | 29.0%(+21.6)#3,160 |
| 60. | Addieville | 50.5% | 24.5%(+26.0)#60 | 29.0%(+21.5)#3,183 |
| 61. | Virgil | 50.0% | 24.5%(+25.5)#61 | 29.0%(+21.0)#3,280 |
| 62. | Ste Marie | 50.0% | 24.5%(+25.5)#62 | 29.0%(+21.0)#3,282 |
| 63. | White Heath | 50.0% | 24.5%(+25.5)#63 | 29.0%(+21.0)#3,313 |
| 64. | Barstow | 50.0% | 24.5%(+25.5)#64 | 29.0%(+21.0)#3,370 |
| 65. | Swedona | 50.0% | 24.5%(+25.5)#65 | 29.0%(+21.0)#3,393 |
| 66. | Foosland | 50.0% | 24.5%(+25.5)#66 | 29.0%(+21.0)#3,404 |
| 67. | Mechanicsburg | 49.8% | 24.5%(+25.3)#67 | 29.0%(+20.8)#3,447 |
| 68. | Latham | 49.6% | 24.5%(+25.1)#68 | 29.0%(+20.6)#3,491 |
| 69. | Grand Detour | 49.6% | 24.5%(+25.1)#69 | 29.0%(+20.6)#3,492 |
| 70. | Ashkum | 49.4% | 24.5%(+24.9)#70 | 29.0%(+20.4)#3,517 |
| 71. | Camargo | 49.4% | 24.5%(+24.9)#71 | 29.0%(+20.4)#3,519 |
| 72. | Woodland | 49.4% | 24.5%(+24.9)#72 | 29.0%(+20.4)#3,525 |
| 73. | Lyndon | 49.2% | 24.5%(+24.7)#73 | 29.0%(+20.2)#3,564 |
| 74. | Smithville | 49.2% | 24.5%(+24.7)#74 | 29.0%(+20.2)#3,571 |
| 75. | Plattville | 49.2% | 24.5%(+24.7)#75 | 29.0%(+20.2)#3,573 |
| 76. | Martinsville | 48.9% | 24.5%(+24.4)#76 | 29.0%(+19.9)#3,637 |
| 77. | Hartsburg | 48.9% | 24.5%(+24.4)#77 | 29.0%(+19.9)#3,645 |
| 78. | Valmeyer | 48.8% | 24.5%(+24.3)#78 | 29.0%(+19.8)#3,666 |
| 79. | Campton Hills | 48.7% | 24.5%(+24.2)#79 | 29.0%(+19.7)#3,686 |
| 80. | Joppa | 48.1% | 24.5%(+23.6)#80 | 29.0%(+19.1)#3,862 |
| 81. | Unity | 48.0% | 24.5%(+23.5)#81 | 29.0%(+19.0)#3,905 |
| 82. | Hardin | 47.9% | 24.5%(+23.4)#82 | 29.0%(+18.9)#3,914 |
| 83. | Argenta | 47.6% | 24.5%(+23.1)#83 | 29.0%(+18.6)#4,002 |
| 84. | Channahon | 47.4% | 24.5%(+22.9)#84 | 29.0%(+18.4)#4,048 |
| 85. | New Milford | 47.4% | 24.5%(+22.9)#85 | 29.0%(+18.4)#4,056 |
| 86. | Illinois | 47.4% | 24.5%(+22.9)#86 | 29.0%(+18.4)#4,073 |
| 87. | Marcelline | 47.4% | 24.5%(+22.9)#87 | 29.0%(+18.4)#4,074 |
| 88. | Greenwood | 47.3% | 24.5%(+22.8)#88 | 29.0%(+18.3)#4,085 |
| 89. | Ophiem | 47.2% | 24.5%(+22.7)#89 | 29.0%(+18.2)#4,115 |
| 90. | Symerton | 47.1% | 24.5%(+22.6)#90 | 29.0%(+18.1)#4,162 |
| 91. | Kingston | 46.7% | 24.5%(+22.2)#91 | 29.0%(+17.7)#4,262 |
| 92. | Springerton | 46.7% | 24.5%(+22.2)#92 | 29.0%(+17.7)#4,286 |
| 93. | Hebron | 46.5% | 24.5%(+22.0)#93 | 29.0%(+17.5)#4,326 |
| 94. | Browning | 46.4% | 24.5%(+21.9)#94 | 29.0%(+17.4)#4,379 |
| 95. | Holiday Shores | 46.2% | 24.5%(+21.7)#95 | 29.0%(+17.2)#4,419 |
| 96. | Alhambra | 46.1% | 24.5%(+21.6)#96 | 29.0%(+17.1)#4,482 |
| 97. | South Barrington | 45.9% | 24.5%(+21.4)#97 | 29.0%(+16.9)#4,523 |
| 98. | Harvard | 45.8% | 24.5%(+21.3)#98 | 29.0%(+16.8)#4,555 |
| 99. | Crystal Lawns | 45.8% | 24.5%(+21.3)#99 | 29.0%(+16.8)#4,560 |
| 100. | Lawrence | 45.8% | 24.5%(+21.3)#100 | 29.0%(+16.8)#4,580 |
Common Questions
What are the Top 10 Cities with the Highest Percentage of Households With Three or more Vehicles in Illinois?
Top 10 Cities with the Highest Percentage of Households With Three or more Vehicles in Illinois are:
#1
100.0%
#2
100.0%
#3
76.5%
#4
75.8%
#5
75.0%
#6
73.9%
#7
71.4%
#8
70.4%
#9
66.7%
#10
66.7%
What city has the Highest Percentage of Households With Three or more Vehicles in Illinois?
Whiteash has the Highest Percentage of Households With Three or more Vehicles in Illinois with 100.0%.
What is the Percentage of Households With Three or more Vehicles in the State of Illinois?
Percentage of Households With Three or more Vehicles in Illinois is 24.5%.
What is the Percentage of Households With Three or more Vehicles in the United States?
Percentage of Households With Three or more Vehicles in the United States is 29.0%.