Cities with the Highest Percentage of Households With Three or more Vehicles in Colorado
RELATED REPORTS & OPTIONS
Households with 3 or more Cars
Colorado
Compare Cities
Map of Cities with the Highest Percentage of Households With Three or more Vehicles in Colorado
0.0%
100.0%
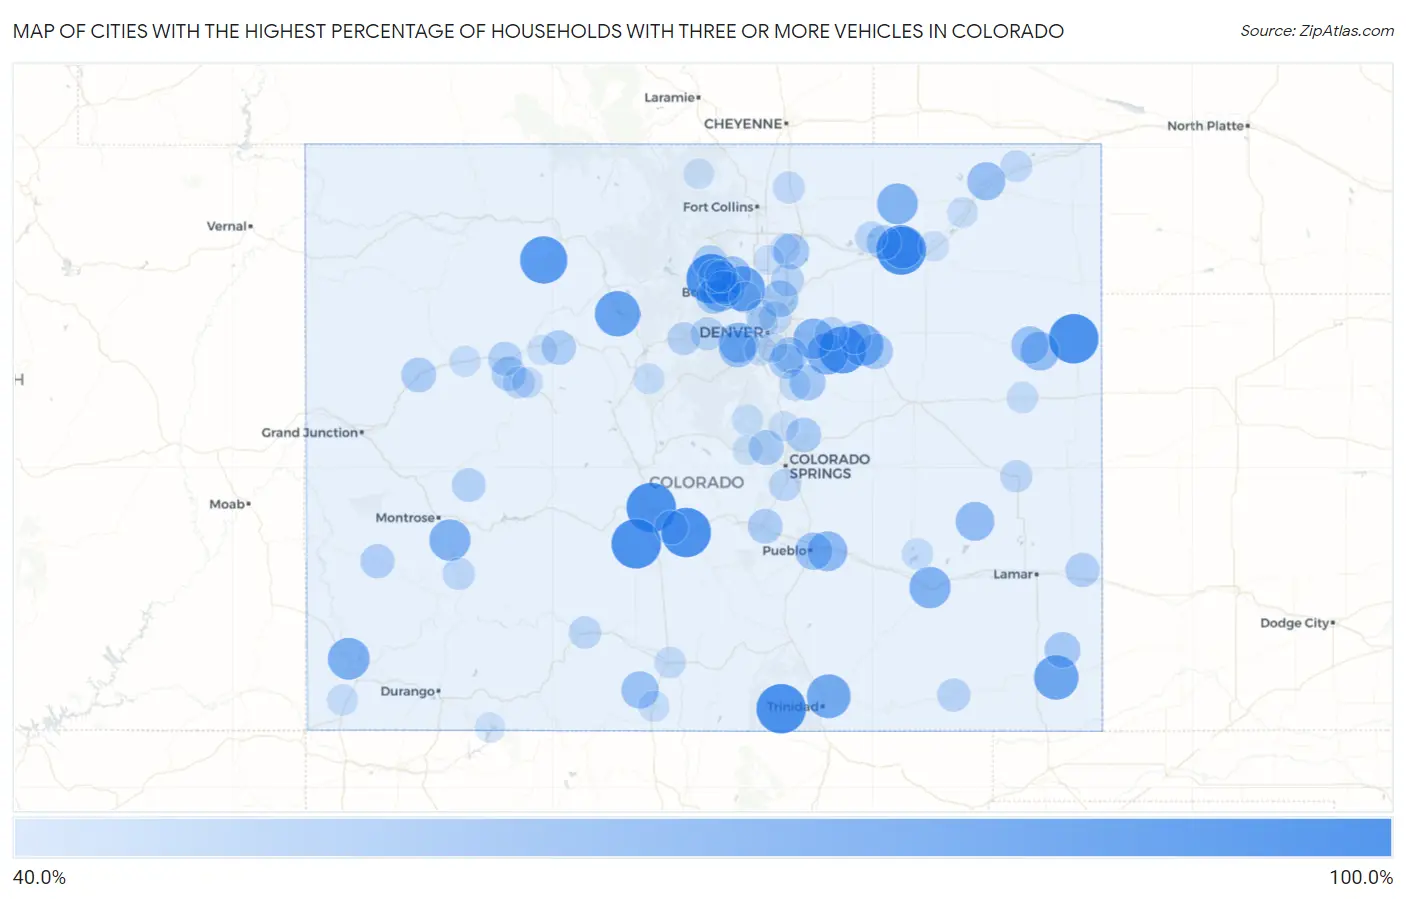
Cities with the Highest Percentage of Households With Three or more Vehicles in Colorado
| City | Housholds With 3+ Cars | vs State | vs National | |
| 1. | Smeltertown | 100.0% | 32.8% (+67.2)#1 | 29.0% (+71.0)#147 |
| 2. | Blue Sky | 100.0% | 32.8% (+67.2)#2 | 29.0% (+71.0)#155 |
| 3. | Idalia | 100.0% | 32.8% (+67.2)#3 | 29.0% (+71.0)#184 |
| 4. | Weston | 100.0% | 32.8% (+67.2)#4 | 29.0% (+71.0)#273 |
| 5. | Hidden Lake | 100.0% | 32.8% (+67.2)#5 | 29.0% (+71.0)#279 |
| 6. | Cotopaxi | 100.0% | 32.8% (+67.2)#6 | 29.0% (+71.0)#322 |
| 7. | Bonanza | 100.0% | 32.8% (+67.2)#7 | 29.0% (+71.0)#355 |
| 8. | Phippsburg | 93.6% | 32.8% (+60.8)#8 | 29.0% (+64.6)#400 |
| 9. | Comanche Creek | 93.5% | 32.8% (+60.7)#9 | 29.0% (+64.5)#401 |
| 10. | Heeney | 88.2% | 32.8% (+55.4)#10 | 29.0% (+59.2)#441 |
| 11. | Valmont | 87.5% | 32.8% (+54.7)#11 | 29.0% (+58.5)#454 |
| 12. | Vilas | 86.2% | 32.8% (+53.4)#12 | 29.0% (+57.2)#470 |
| 13. | El Moro | 84.0% | 32.8% (+51.2)#13 | 29.0% (+55.0)#504 |
| 14. | Saddle Ridge | 78.9% | 32.8% (+46.1)#14 | 29.0% (+49.9)#618 |
| 15. | Lewis | 78.8% | 32.8% (+46.0)#15 | 29.0% (+49.8)#622 |
| 16. | Peoria | 78.6% | 32.8% (+45.8)#16 | 29.0% (+49.6)#626 |
| 17. | Brick Center | 78.0% | 32.8% (+45.2)#17 | 29.0% (+49.0)#638 |
| 18. | La Junta Gardens | 77.6% | 32.8% (+44.8)#18 | 29.0% (+48.6)#650 |
| 19. | Colona | 77.4% | 32.8% (+44.6)#19 | 29.0% (+48.4)#655 |
| 20. | Raymer New Raymer | 76.0% | 32.8% (+43.2)#20 | 29.0% (+47.0)#701 |
| 21. | Watkins | 75.5% | 32.8% (+42.7)#21 | 29.0% (+46.5)#715 |
| 22. | Sugarloaf | 74.7% | 32.8% (+41.9)#22 | 29.0% (+45.7)#758 |
| 23. | Vineland | 73.2% | 32.8% (+40.4)#23 | 29.0% (+44.2)#799 |
| 24. | Idledale | 72.9% | 32.8% (+40.1)#24 | 29.0% (+43.9)#804 |
| 25. | Haswell | 70.6% | 32.8% (+37.8)#25 | 29.0% (+41.6)#871 |
| 26. | Kirk | 70.0% | 32.8% (+37.2)#26 | 29.0% (+41.0)#895 |
| 27. | Briggsdale | 68.8% | 32.8% (+36.0)#27 | 29.0% (+39.8)#943 |
| 28. | Iliff | 68.5% | 32.8% (+35.7)#28 | 29.0% (+39.5)#956 |
| 29. | Blende | 66.8% | 32.8% (+34.0)#29 | 29.0% (+37.8)#1,048 |
| 30. | Capulin | 66.7% | 32.8% (+33.9)#30 | 29.0% (+37.7)#1,051 |
| 31. | Joes | 66.7% | 32.8% (+33.9)#31 | 29.0% (+37.7)#1,064 |
| 32. | Altona | 66.4% | 32.8% (+33.6)#32 | 29.0% (+37.4)#1,099 |
| 33. | Indian Hills | 66.0% | 32.8% (+33.2)#33 | 29.0% (+37.0)#1,121 |
| 34. | Todd Creek | 64.3% | 32.8% (+31.5)#34 | 29.0% (+35.3)#1,225 |
| 35. | Ponderosa Park | 63.0% | 32.8% (+30.2)#35 | 29.0% (+34.0)#1,320 |
| 36. | Gilcrest | 62.5% | 32.8% (+29.7)#36 | 29.0% (+33.5)#1,346 |
| 37. | Two Buttes | 62.5% | 32.8% (+29.7)#37 | 29.0% (+33.5)#1,373 |
| 38. | Foxfield | 62.3% | 32.8% (+29.5)#38 | 29.0% (+33.3)#1,378 |
| 39. | Deer Trail | 62.2% | 32.8% (+29.4)#39 | 29.0% (+33.2)#1,391 |
| 40. | Sunshine | 61.1% | 32.8% (+28.3)#40 | 29.0% (+32.1)#1,508 |
| 41. | St Ann Highlands | 60.8% | 32.8% (+28.0)#41 | 29.0% (+31.8)#1,539 |
| 42. | Cascade Chipita Park | 60.3% | 32.8% (+27.5)#42 | 29.0% (+31.3)#1,584 |
| 43. | Grand View Estates | 60.0% | 32.8% (+27.2)#43 | 29.0% (+31.0)#1,604 |
| 44. | Seven Hills | 60.0% | 32.8% (+27.2)#44 | 29.0% (+31.0)#1,620 |
| 45. | Black Forest | 59.7% | 32.8% (+26.9)#45 | 29.0% (+30.7)#1,665 |
| 46. | Parachute | 59.5% | 32.8% (+26.7)#46 | 29.0% (+30.5)#1,696 |
| 47. | Weldona | 59.5% | 32.8% (+26.7)#47 | 29.0% (+30.5)#1,702 |
| 48. | Penrose | 59.4% | 32.8% (+26.6)#48 | 29.0% (+30.4)#1,705 |
| 49. | Allenspark | 59.0% | 32.8% (+26.2)#49 | 29.0% (+30.0)#1,760 |
| 50. | Cattle Creek | 59.0% | 32.8% (+26.2)#50 | 29.0% (+30.0)#1,762 |
| 51. | Eagle | 58.8% | 32.8% (+26.0)#51 | 29.0% (+29.8)#1,771 |
| 52. | Redvale | 58.0% | 32.8% (+25.2)#52 | 29.0% (+29.0)#1,880 |
| 53. | Hartman | 57.9% | 32.8% (+25.1)#53 | 29.0% (+28.9)#1,891 |
| 54. | Howard | 57.7% | 32.8% (+24.9)#54 | 29.0% (+28.7)#1,906 |
| 55. | No Name | 57.5% | 32.8% (+24.7)#55 | 29.0% (+28.5)#1,938 |
| 56. | Crawford | 57.1% | 32.8% (+24.3)#56 | 29.0% (+28.1)#1,965 |
| 57. | Bark Ranch | 56.9% | 32.8% (+24.1)#57 | 29.0% (+27.9)#2,020 |
| 58. | Crisman | 56.5% | 32.8% (+23.7)#58 | 29.0% (+27.5)#2,067 |
| 59. | Byers | 55.8% | 32.8% (+23.0)#59 | 29.0% (+26.8)#2,175 |
| 60. | Bennett | 55.6% | 32.8% (+22.8)#60 | 29.0% (+26.6)#2,195 |
| 61. | Kim | 55.6% | 32.8% (+22.8)#61 | 29.0% (+26.6)#2,221 |
| 62. | Fort Lupton | 55.4% | 32.8% (+22.6)#62 | 29.0% (+26.4)#2,238 |
| 63. | Idaho Springs | 55.0% | 32.8% (+22.2)#63 | 29.0% (+26.0)#2,303 |
| 64. | Twin Lakes Cdp Lake County | 55.0% | 32.8% (+22.2)#64 | 29.0% (+26.0)#2,308 |
| 65. | Silver Plume | 55.0% | 32.8% (+22.2)#65 | 29.0% (+26.0)#2,310 |
| 66. | Derby | 53.8% | 32.8% (+21.0)#66 | 29.0% (+24.8)#2,484 |
| 67. | Kit Carson | 53.4% | 32.8% (+20.6)#67 | 29.0% (+24.4)#2,587 |
| 68. | Alpine | 53.3% | 32.8% (+20.5)#68 | 29.0% (+24.3)#2,605 |
| 69. | Rock Creek Park | 53.2% | 32.8% (+20.4)#69 | 29.0% (+24.2)#2,639 |
| 70. | Portland | 53.2% | 32.8% (+20.4)#70 | 29.0% (+24.2)#2,641 |
| 71. | Jamestown | 52.9% | 32.8% (+20.1)#71 | 29.0% (+23.9)#2,691 |
| 72. | Mulford | 52.5% | 32.8% (+19.7)#72 | 29.0% (+23.5)#2,778 |
| 73. | Jackson Lake | 52.5% | 32.8% (+19.7)#73 | 29.0% (+23.5)#2,783 |
| 74. | Nunn | 52.3% | 32.8% (+19.5)#74 | 29.0% (+23.3)#2,827 |
| 75. | Crook | 51.9% | 32.8% (+19.1)#75 | 29.0% (+22.9)#2,923 |
| 76. | Paragon Estates | 51.7% | 32.8% (+18.9)#76 | 29.0% (+22.7)#2,946 |
| 77. | Park Center | 51.6% | 32.8% (+18.8)#77 | 29.0% (+22.6)#2,961 |
| 78. | Vona | 51.4% | 32.8% (+18.6)#78 | 29.0% (+22.4)#3,012 |
| 79. | Alamosa East | 50.9% | 32.8% (+18.1)#79 | 29.0% (+21.9)#3,084 |
| 80. | Franktown | 50.9% | 32.8% (+18.1)#80 | 29.0% (+21.9)#3,093 |
| 81. | Bow Mar | 50.5% | 32.8% (+17.7)#81 | 29.0% (+21.5)#3,171 |
| 82. | Towaoc | 50.4% | 32.8% (+17.6)#82 | 29.0% (+21.4)#3,190 |
| 83. | Sugar City | 50.4% | 32.8% (+17.6)#83 | 29.0% (+21.4)#3,191 |
| 84. | Romeo | 50.4% | 32.8% (+17.6)#84 | 29.0% (+21.4)#3,193 |
| 85. | Berkley | 50.3% | 32.8% (+17.5)#85 | 29.0% (+21.3)#3,198 |
| 86. | Silt | 50.1% | 32.8% (+17.3)#86 | 29.0% (+21.1)#3,236 |
| 87. | Westcreek | 50.0% | 32.8% (+17.2)#87 | 29.0% (+21.0)#3,285 |
| 88. | Shaw Heights | 49.8% | 32.8% (+17.0)#88 | 29.0% (+20.8)#3,440 |
| 89. | Blue River | 49.8% | 32.8% (+17.0)#89 | 29.0% (+20.8)#3,444 |
| 90. | El Jebel | 49.7% | 32.8% (+16.9)#90 | 29.0% (+20.7)#3,459 |
| 91. | Atwood | 49.1% | 32.8% (+16.3)#91 | 29.0% (+20.1)#3,608 |
| 92. | Red Feather Lakes | 48.7% | 32.8% (+15.9)#92 | 29.0% (+19.7)#3,704 |
| 93. | Milliken | 48.6% | 32.8% (+15.8)#93 | 29.0% (+19.6)#3,711 |
| 94. | Woodmoor | 48.5% | 32.8% (+15.7)#94 | 29.0% (+19.5)#3,736 |
| 95. | Gypsum | 48.5% | 32.8% (+15.7)#95 | 29.0% (+19.5)#3,737 |
| 96. | Mead | 48.3% | 32.8% (+15.5)#96 | 29.0% (+19.3)#3,800 |
| 97. | Hillrose | 48.2% | 32.8% (+15.4)#97 | 29.0% (+19.2)#3,841 |
| 98. | Arboles | 47.9% | 32.8% (+15.1)#98 | 29.0% (+18.9)#3,920 |
| 99. | Cherry Hills Village | 47.7% | 32.8% (+14.9)#99 | 29.0% (+18.7)#3,961 |
| 100. | Divide | 47.5% | 32.8% (+14.7)#100 | 29.0% (+18.5)#4,045 |
Common Questions
What are the Top 10 Cities with the Highest Percentage of Households With Three or more Vehicles in Colorado?
Top 10 Cities with the Highest Percentage of Households With Three or more Vehicles in Colorado are:
#1
100.0%
#2
100.0%
#3
100.0%
#4
100.0%
#5
100.0%
#6
100.0%
#7
100.0%
#8
93.6%
#9
93.5%
#10
88.2%
What city has the Highest Percentage of Households With Three or more Vehicles in Colorado?
Smeltertown has the Highest Percentage of Households With Three or more Vehicles in Colorado with 100.0%.
What is the Percentage of Households With Three or more Vehicles in the State of Colorado?
Percentage of Households With Three or more Vehicles in Colorado is 32.8%.
What is the Percentage of Households With Three or more Vehicles in the United States?
Percentage of Households With Three or more Vehicles in the United States is 29.0%.