Cities with the Highest Percentage of Households With Three or more Vehicles in Mississippi
RELATED REPORTS & OPTIONS
Households with 3 or more Cars
Mississippi
Compare Cities
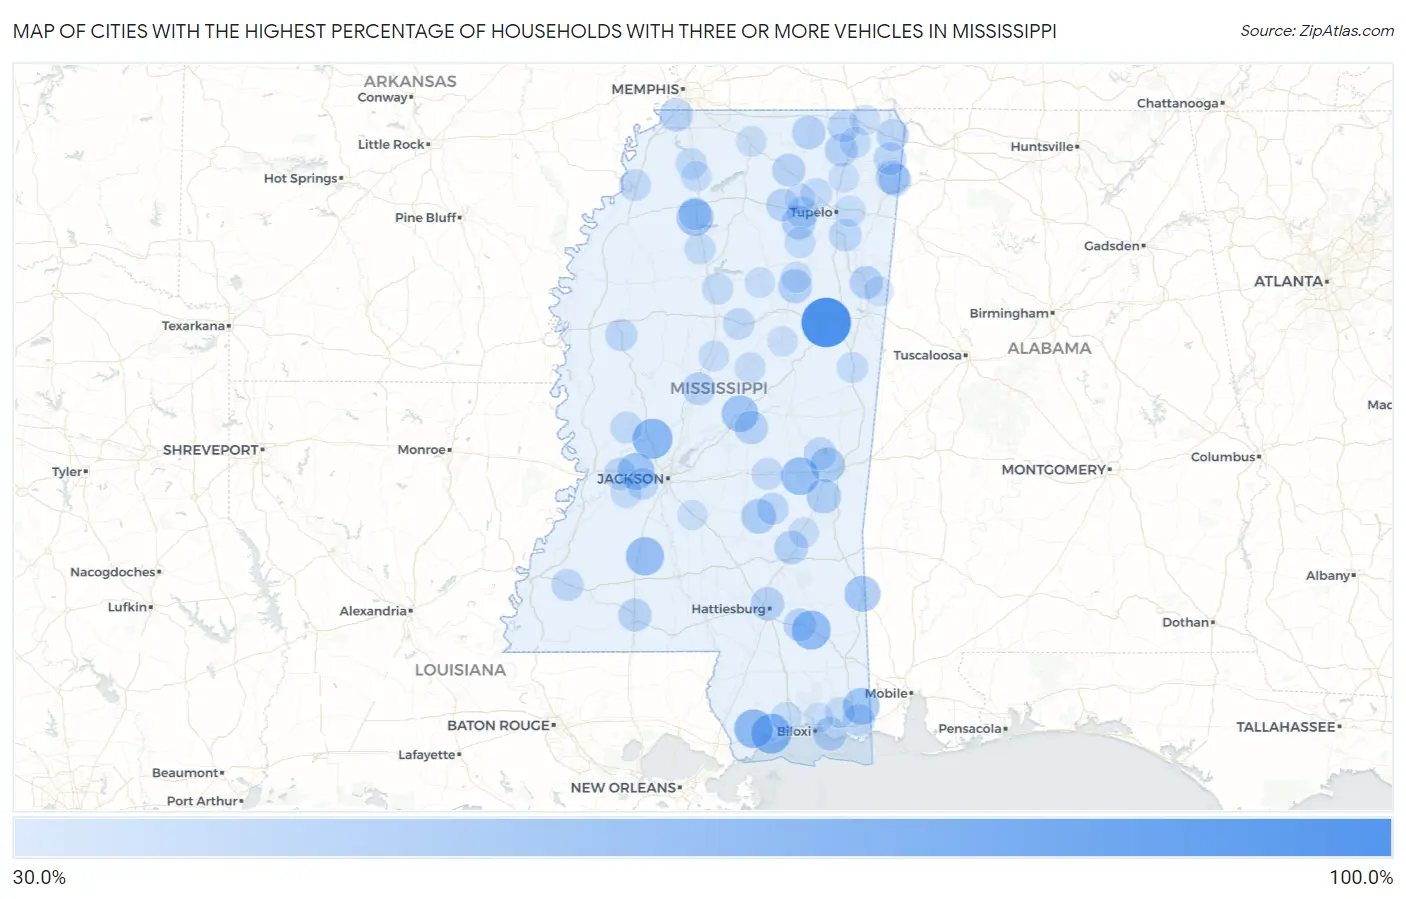
Map of Cities with the Highest Percentage of Households With Three or more Vehicles in Mississippi
0.0%
100.0%
Cities with the Highest Percentage of Households With Three or more Vehicles in Mississippi
| City | Housholds With 3+ Cars | vs State | vs National | |
| 1. | Mississippi State | 100.0% | 31.5%(+68.5)#1 | 29.0%(+71.0)#4 |
| 2. | Skene | 100.0% | 31.5%(+68.5)#2 | 29.0%(+71.0)#55 |
| 3. | Grace | 100.0% | 31.5%(+68.5)#3 | 29.0%(+71.0)#63 |
| 4. | New Site | 100.0% | 31.5%(+68.5)#4 | 29.0%(+71.0)#107 |
| 5. | Independence | 100.0% | 31.5%(+68.5)#5 | 29.0%(+71.0)#123 |
| 6. | Ovett | 100.0% | 31.5%(+68.5)#6 | 29.0%(+71.0)#143 |
| 7. | Pattison | 100.0% | 31.5%(+68.5)#7 | 29.0%(+71.0)#152 |
| 8. | Redwood | 100.0% | 31.5%(+68.5)#8 | 29.0%(+71.0)#194 |
| 9. | Red Banks | 100.0% | 31.5%(+68.5)#9 | 29.0%(+71.0)#251 |
| 10. | Symonds | 100.0% | 31.5%(+68.5)#10 | 29.0%(+71.0)#287 |
| 11. | Stoneville | 100.0% | 31.5%(+68.5)#11 | 29.0%(+71.0)#300 |
| 12. | Waterford | 100.0% | 31.5%(+68.5)#12 | 29.0%(+71.0)#346 |
| 13. | Paris | 93.8% | 31.5%(+62.3)#13 | 29.0%(+64.8)#399 |
| 14. | Agricola | 76.4% | 31.5%(+44.9)#14 | 29.0%(+47.4)#685 |
| 15. | Hermanville | 75.5% | 31.5%(+44.0)#15 | 29.0%(+46.5)#716 |
| 16. | Kearney Park | 68.8% | 31.5%(+37.3)#16 | 29.0%(+39.8)#938 |
| 17. | Delisle | 68.1% | 31.5%(+36.6)#17 | 29.0%(+39.1)#981 |
| 18. | Eastabuchie | 66.7% | 31.5%(+35.2)#18 | 29.0%(+37.7)#1,058 |
| 19. | Kiln | 65.8% | 31.5%(+34.3)#19 | 29.0%(+36.8)#1,133 |
| 20. | Beaumont | 65.4% | 31.5%(+33.9)#20 | 29.0%(+36.4)#1,151 |
| 21. | Kokomo | 64.7% | 31.5%(+33.2)#21 | 29.0%(+35.7)#1,198 |
| 22. | Beauregard | 63.4% | 31.5%(+31.9)#22 | 29.0%(+34.4)#1,293 |
| 23. | Hickory | 62.2% | 31.5%(+30.7)#23 | 29.0%(+33.2)#1,395 |
| 24. | Bolton | 59.1% | 31.5%(+27.6)#24 | 29.0%(+30.1)#1,739 |
| 25. | Pope | 58.8% | 31.5%(+27.3)#25 | 29.0%(+29.8)#1,775 |
| 26. | Redwater | 58.5% | 31.5%(+27.0)#26 | 29.0%(+29.5)#1,811 |
| 27. | Big Point | 58.4% | 31.5%(+26.9)#27 | 29.0%(+29.4)#1,822 |
| 28. | Wheeler | 58.3% | 31.5%(+26.8)#28 | 29.0%(+29.3)#1,835 |
| 29. | State Line | 56.3% | 31.5%(+24.8)#29 | 29.0%(+27.3)#2,087 |
| 30. | De Soto | 56.0% | 31.5%(+24.5)#30 | 29.0%(+27.0)#2,151 |
| 31. | Tula | 54.8% | 31.5%(+23.3)#31 | 29.0%(+25.8)#2,344 |
| 32. | Bobo | 53.1% | 31.5%(+21.6)#32 | 29.0%(+24.1)#2,655 |
| 33. | Mount Pleasant | 53.0% | 31.5%(+21.5)#33 | 29.0%(+24.0)#2,673 |
| 34. | Sylvarena | 52.8% | 31.5%(+21.3)#34 | 29.0%(+23.8)#2,728 |
| 35. | Nellieburg | 52.6% | 31.5%(+21.1)#35 | 29.0%(+23.6)#2,744 |
| 36. | Enterprise | 52.1% | 31.5%(+20.6)#36 | 29.0%(+23.1)#2,868 |
| 37. | Algoma | 50.2% | 31.5%(+18.7)#37 | 29.0%(+21.2)#3,227 |
| 38. | Mantee | 50.0% | 31.5%(+18.5)#38 | 29.0%(+21.0)#3,265 |
| 39. | Sharon | 49.5% | 31.5%(+18.0)#39 | 29.0%(+20.5)#3,496 |
| 40. | Belmont | 49.0% | 31.5%(+17.5)#40 | 29.0%(+20.0)#3,612 |
| 41. | Standing Pine | 49.0% | 31.5%(+17.5)#41 | 29.0%(+20.0)#3,620 |
| 42. | Gulf Park Estates | 48.6% | 31.5%(+17.1)#42 | 29.0%(+19.6)#3,712 |
| 43. | Falkner | 48.5% | 31.5%(+17.0)#43 | 29.0%(+19.5)#3,745 |
| 44. | Glendale | 48.4% | 31.5%(+16.9)#44 | 29.0%(+19.4)#3,775 |
| 45. | New Hamilton | 48.0% | 31.5%(+16.5)#45 | 29.0%(+19.0)#3,888 |
| 46. | Lynchburg | 47.8% | 31.5%(+16.3)#46 | 29.0%(+18.8)#3,935 |
| 47. | Summit | 47.6% | 31.5%(+16.1)#47 | 29.0%(+18.6)#4,000 |
| 48. | Valley Park | 47.6% | 31.5%(+16.1)#48 | 29.0%(+18.6)#4,013 |
| 49. | Dennis | 47.6% | 31.5%(+16.1)#49 | 29.0%(+18.6)#4,020 |
| 50. | Jumpertown | 47.2% | 31.5%(+15.7)#50 | 29.0%(+18.2)#4,111 |
| 51. | Myrtle | 47.0% | 31.5%(+15.5)#51 | 29.0%(+18.0)#4,183 |
| 52. | New Augusta | 46.5% | 31.5%(+15.0)#52 | 29.0%(+17.5)#4,332 |
| 53. | Thaxton | 46.2% | 31.5%(+14.7)#53 | 29.0%(+17.2)#4,430 |
| 54. | Golden | 46.2% | 31.5%(+14.7)#54 | 29.0%(+17.2)#4,441 |
| 55. | Goodman | 46.0% | 31.5%(+14.5)#55 | 29.0%(+17.0)#4,500 |
| 56. | Tishomingo | 45.9% | 31.5%(+14.4)#56 | 29.0%(+16.9)#4,540 |
| 57. | Collinsville | 45.7% | 31.5%(+14.2)#57 | 29.0%(+16.7)#4,600 |
| 58. | Nettleton | 45.6% | 31.5%(+14.1)#58 | 29.0%(+16.6)#4,634 |
| 59. | Courtland | 45.4% | 31.5%(+13.9)#59 | 29.0%(+16.4)#4,724 |
| 60. | Iuka | 44.9% | 31.5%(+13.4)#60 | 29.0%(+15.9)#4,886 |
| 61. | Inverness | 44.8% | 31.5%(+13.3)#61 | 29.0%(+15.8)#4,923 |
| 62. | Edwards | 44.6% | 31.5%(+13.1)#62 | 29.0%(+15.6)#4,988 |
| 63. | Pontotoc | 44.5% | 31.5%(+13.0)#63 | 29.0%(+15.5)#5,007 |
| 64. | Roxie | 44.4% | 31.5%(+12.9)#64 | 29.0%(+15.4)#5,046 |
| 65. | Helena | 44.4% | 31.5%(+12.9)#65 | 29.0%(+15.4)#5,050 |
| 66. | Kossuth | 44.4% | 31.5%(+12.9)#66 | 29.0%(+15.4)#5,077 |
| 67. | Louin | 44.1% | 31.5%(+12.6)#67 | 29.0%(+15.1)#5,186 |
| 68. | Raymond | 43.9% | 31.5%(+12.4)#68 | 29.0%(+14.9)#5,265 |
| 69. | Lake | 43.8% | 31.5%(+12.3)#69 | 29.0%(+14.8)#5,317 |
| 70. | Lula | 43.5% | 31.5%(+12.0)#70 | 29.0%(+14.5)#5,453 |
| 71. | Satartia | 43.5% | 31.5%(+12.0)#71 | 29.0%(+14.5)#5,468 |
| 72. | Rena Lara | 43.3% | 31.5%(+11.8)#72 | 29.0%(+14.3)#5,539 |
| 73. | Lakeview | 43.2% | 31.5%(+11.7)#73 | 29.0%(+14.2)#5,571 |
| 74. | Kilmichael | 43.1% | 31.5%(+11.6)#74 | 29.0%(+14.1)#5,605 |
| 75. | Blue Springs | 42.4% | 31.5%(+10.9)#75 | 29.0%(+13.4)#5,908 |
| 76. | Elliott | 42.3% | 31.5%(+10.8)#76 | 29.0%(+13.3)#5,946 |
| 77. | Senatobia | 42.1% | 31.5%(+10.6)#77 | 29.0%(+13.1)#6,016 |
| 78. | Rienzi | 42.1% | 31.5%(+10.6)#78 | 29.0%(+13.1)#6,045 |
| 79. | Tillatoba | 41.9% | 31.5%(+10.4)#79 | 29.0%(+12.9)#6,155 |
| 80. | Mooreville | 41.8% | 31.5%(+10.3)#80 | 29.0%(+12.8)#6,173 |
| 81. | Lyman | 41.8% | 31.5%(+10.3)#81 | 29.0%(+12.8)#6,180 |
| 82. | Learned | 41.7% | 31.5%(+10.2)#82 | 29.0%(+12.7)#6,274 |
| 83. | Macon | 41.6% | 31.5%(+10.1)#83 | 29.0%(+12.6)#6,291 |
| 84. | New Houlka | 41.2% | 31.5%(+9.70)#84 | 29.0%(+12.2)#6,509 |
| 85. | Woodland | 40.7% | 31.5%(+9.20)#85 | 29.0%(+11.7)#6,745 |
| 86. | Holly Springs | 40.6% | 31.5%(+9.10)#86 | 29.0%(+11.6)#6,761 |
| 87. | Ethel | 40.5% | 31.5%(+9.00)#87 | 29.0%(+11.5)#6,843 |
| 88. | Como | 40.2% | 31.5%(+8.70)#88 | 29.0%(+11.2)#6,986 |
| 89. | West | 40.0% | 31.5%(+8.50)#89 | 29.0%(+11.0)#7,113 |
| 90. | Slate Springs | 40.0% | 31.5%(+8.50)#90 | 29.0%(+11.0)#7,140 |
| 91. | Vancleave | 39.8% | 31.5%(+8.30)#91 | 29.0%(+10.8)#7,214 |
| 92. | Heidelberg | 39.8% | 31.5%(+8.30)#92 | 29.0%(+10.8)#7,236 |
| 93. | Farmington | 39.7% | 31.5%(+8.20)#93 | 29.0%(+10.7)#7,273 |
| 94. | Ackerman | 39.3% | 31.5%(+7.80)#94 | 29.0%(+10.3)#7,506 |
| 95. | Ecru | 39.3% | 31.5%(+7.80)#95 | 29.0%(+10.3)#7,510 |
| 96. | Braxton | 39.2% | 31.5%(+7.70)#96 | 29.0%(+10.2)#7,594 |
| 97. | Baldwyn | 38.9% | 31.5%(+7.40)#97 | 29.0%(+9.90)#7,727 |
| 98. | Victoria | 38.6% | 31.5%(+7.10)#98 | 29.0%(+9.60)#7,934 |
| 99. | Caledonia | 38.3% | 31.5%(+6.80)#99 | 29.0%(+9.30)#8,121 |
| 100. | Latimer | 38.2% | 31.5%(+6.70)#100 | 29.0%(+9.20)#8,157 |
Common Questions
What are the Top 10 Cities with the Highest Percentage of Households With Three or more Vehicles in Mississippi?
Top 10 Cities with the Highest Percentage of Households With Three or more Vehicles in Mississippi are:
#1
100.0%
#2
68.8%
#3
68.1%
#4
65.8%
#5
65.4%
#6
63.4%
#7
62.2%
#8
59.1%
#9
58.8%
#10
58.5%
What city has the Highest Percentage of Households With Three or more Vehicles in Mississippi?
Mississippi State has the Highest Percentage of Households With Three or more Vehicles in Mississippi with 100.0%.
What is the Percentage of Households With Three or more Vehicles in the State of Mississippi?
Percentage of Households With Three or more Vehicles in Mississippi is 31.5%.
What is the Percentage of Households With Three or more Vehicles in the United States?
Percentage of Households With Three or more Vehicles in the United States is 29.0%.