Lenwood, CA Map & Demographics
Lenwood Map
Lenwood Overview
$22,620
PER CAPITA INCOME
$77,661
AVG FAMILY INCOME
$68,882
AVG HOUSEHOLD INCOME
61.5%
WAGE / INCOME GAP [ % ]
38.5¢/ $1
WAGE / INCOME GAP [ $ ]
0.41
INEQUALITY / GINI INDEX
4,016
TOTAL POPULATION
2,163
MALE POPULATION
1,853
FEMALE POPULATION
116.73
MALES / 100 FEMALES
85.67
FEMALES / 100 MALES
30.5
MEDIAN AGE
3.7
AVG FAMILY SIZE
3.2
AVG HOUSEHOLD SIZE
1,560
LABOR FORCE [ PEOPLE ]
55.8%
PERCENT IN LABOR FORCE
6.7%
UNEMPLOYMENT RATE
Income in Lenwood
Income Overview in Lenwood
Per Capita Income in Lenwood is $22,620, while median incomes of families and households are $77,661 and $68,882 respectively.
| Characteristic | Number | Measure |
| Per Capita Income | 4,016 | $22,620 |
| Median Family Income | 977 | $77,661 |
| Mean Family Income | 977 | $84,602 |
| Median Household Income | 1,240 | $68,882 |
| Mean Household Income | 1,240 | $75,568 |
| Income Deficit | 977 | $0 |
| Wage / Income Gap (%) | 4,016 | 61.46% |
| Wage / Income Gap ($) | 4,016 | 38.54¢ per $1 |
| Gini / Inequality Index | 4,016 | 0.41 |
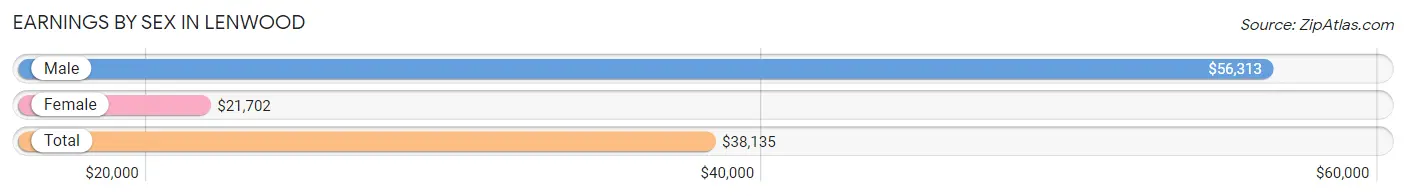
Earnings by Sex in Lenwood
Average Earnings in Lenwood are $38,135, $56,313 for men and $21,702 for women, a difference of 61.5%.
| Sex | Number | Average Earnings |
| Male | 795 (53.0%) | $56,313 |
| Female | 704 (47.0%) | $21,702 |
| Total | 1,499 (100.0%) | $38,135 |
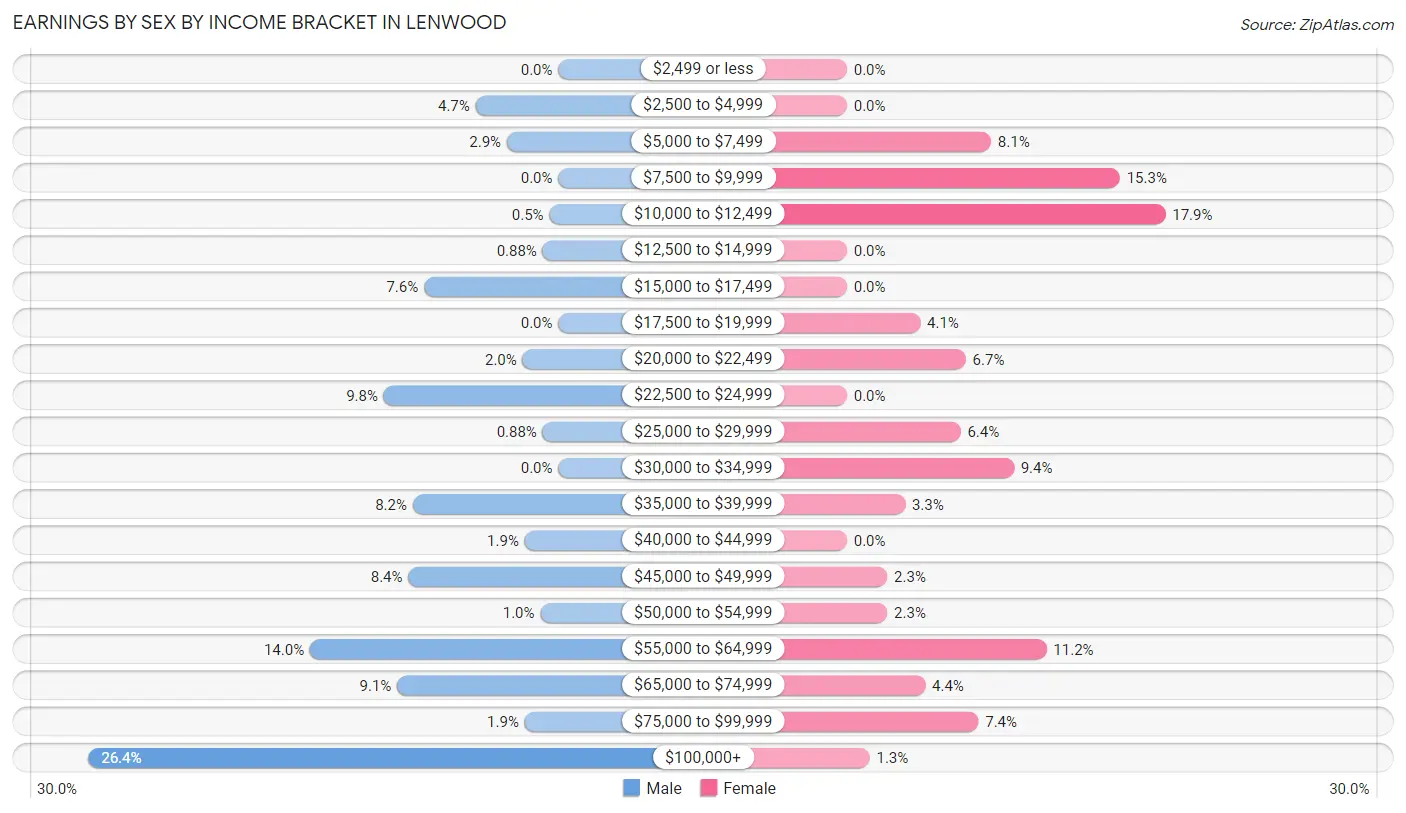
Earnings by Sex by Income Bracket in Lenwood
The most common earnings brackets in Lenwood are $100,000+ for men (210 | 26.4%) and $10,000 to $12,499 for women (126 | 17.9%).
| Income | Male | Female |
| $2,499 or less | 0 (0.0%) | 0 (0.0%) |
| $2,500 to $4,999 | 37 (4.6%) | 0 (0.0%) |
| $5,000 to $7,499 | 23 (2.9%) | 57 (8.1%) |
| $7,500 to $9,999 | 0 (0.0%) | 108 (15.3%) |
| $10,000 to $12,499 | 4 (0.5%) | 126 (17.9%) |
| $12,500 to $14,999 | 7 (0.9%) | 0 (0.0%) |
| $15,000 to $17,499 | 60 (7.5%) | 0 (0.0%) |
| $17,500 to $19,999 | 0 (0.0%) | 29 (4.1%) |
| $20,000 to $22,499 | 16 (2.0%) | 47 (6.7%) |
| $22,500 to $24,999 | 78 (9.8%) | 0 (0.0%) |
| $25,000 to $29,999 | 7 (0.9%) | 45 (6.4%) |
| $30,000 to $34,999 | 0 (0.0%) | 66 (9.4%) |
| $35,000 to $39,999 | 65 (8.2%) | 23 (3.3%) |
| $40,000 to $44,999 | 15 (1.9%) | 0 (0.0%) |
| $45,000 to $49,999 | 67 (8.4%) | 16 (2.3%) |
| $50,000 to $54,999 | 8 (1.0%) | 16 (2.3%) |
| $55,000 to $64,999 | 111 (14.0%) | 79 (11.2%) |
| $65,000 to $74,999 | 72 (9.1%) | 31 (4.4%) |
| $75,000 to $99,999 | 15 (1.9%) | 52 (7.4%) |
| $100,000+ | 210 (26.4%) | 9 (1.3%) |
| Total | 795 (100.0%) | 704 (100.0%) |
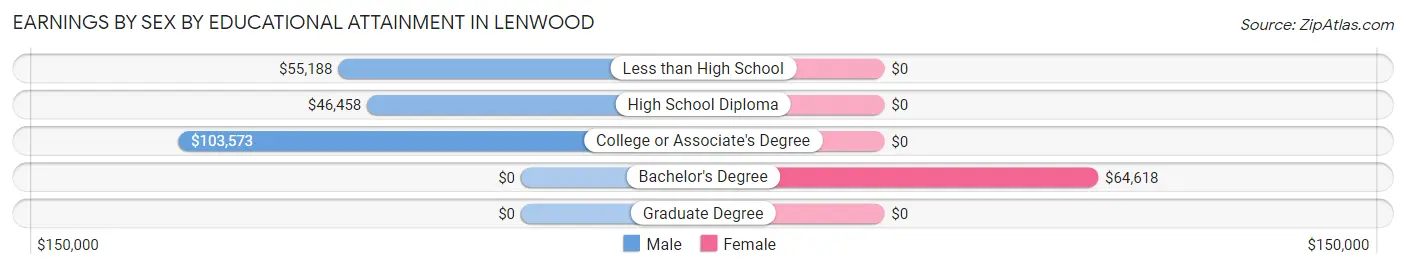
Earnings by Sex by Educational Attainment in Lenwood
Average earnings in Lenwood are $58,049 for men and $28,528 for women, a difference of 50.9%. Men with an educational attainment of college or associate's degree enjoy the highest average annual earnings of $103,573, while those with high school diploma education earn the least with $46,458. Women with an educational attainment of bachelor's degree earn the most with the average annual earnings of $64,618, while those with bachelor's degree education have the smallest earnings of $64,618.
| Educational Attainment | Male Income | Female Income |
| Less than High School | $55,188 | $0 |
| High School Diploma | $46,458 | $0 |
| College or Associate's Degree | $103,573 | $0 |
| Bachelor's Degree | - | - |
| Graduate Degree | - | - |
| Total | $58,049 | $28,528 |
Family Income in Lenwood
Family Income Brackets in Lenwood
According to the Lenwood family income data, there are 251 families falling into the $150,000 to $199,999 income range, which is the most common income bracket and makes up 25.7% of all families.
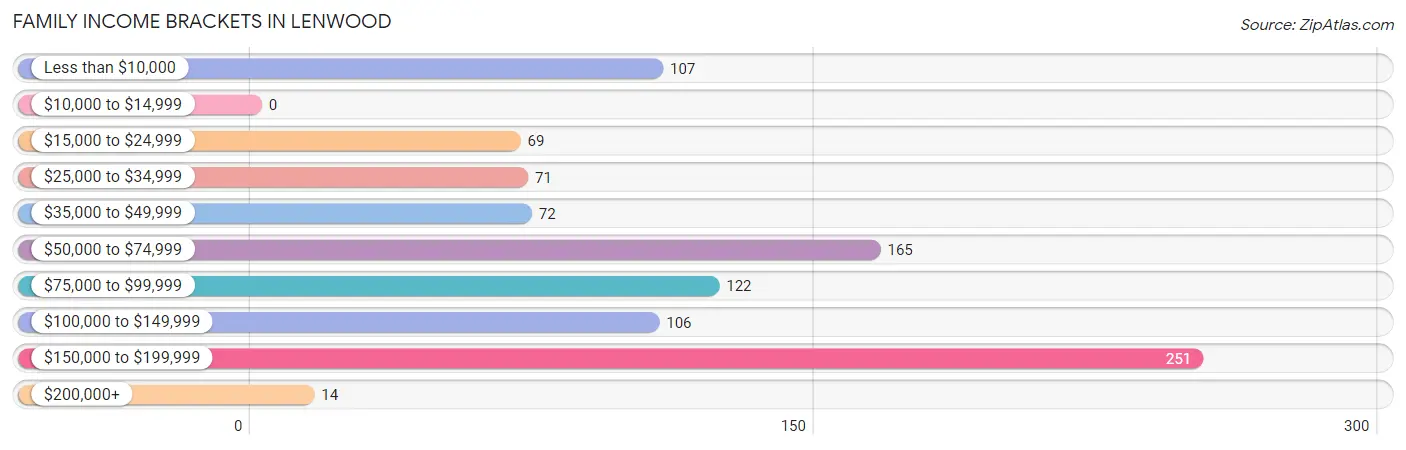
| Income Bracket | # Families | % Families |
| Less than $10,000 | 107 | 11.0% |
| $10,000 to $14,999 | 0 | 0.0% |
| $15,000 to $24,999 | 69 | 7.1% |
| $25,000 to $34,999 | 71 | 7.3% |
| $35,000 to $49,999 | 72 | 7.4% |
| $50,000 to $74,999 | 165 | 16.9% |
| $75,000 to $99,999 | 122 | 12.5% |
| $100,000 to $149,999 | 106 | 10.8% |
| $150,000 to $199,999 | 251 | 25.7% |
| $200,000+ | 14 | 1.4% |
Family Income by Famaliy Size in Lenwood
4-person families (284 | 29.1%) account for the highest median family income in Lenwood with $150,571 per family, while 4-person families (284 | 29.1%) have the highest median income of $37,643 per family member.
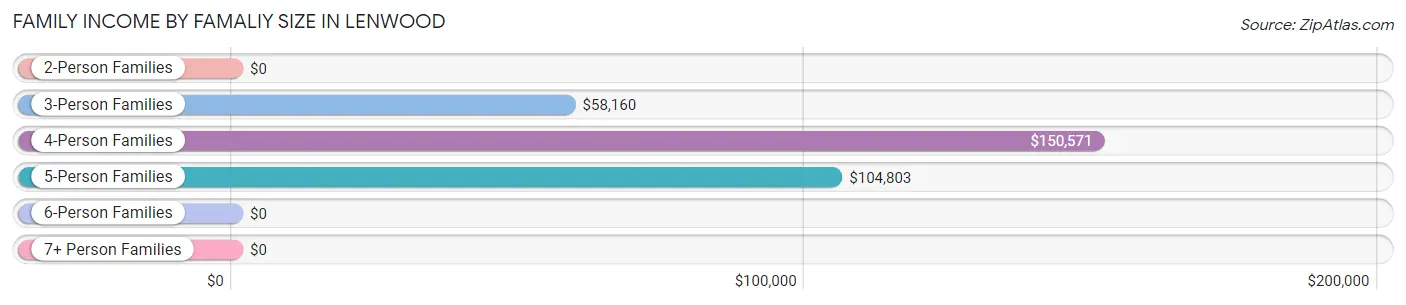
| Income Bracket | # Families | Median Income |
| 2-Person Families | 158 (16.2%) | $0 |
| 3-Person Families | 372 (38.1%) | $58,160 |
| 4-Person Families | 284 (29.1%) | $150,571 |
| 5-Person Families | 53 (5.4%) | $104,803 |
| 6-Person Families | 29 (3.0%) | $0 |
| 7+ Person Families | 81 (8.3%) | $0 |
| Total | 977 (100.0%) | $77,661 |
Family Income by Number of Earners in Lenwood
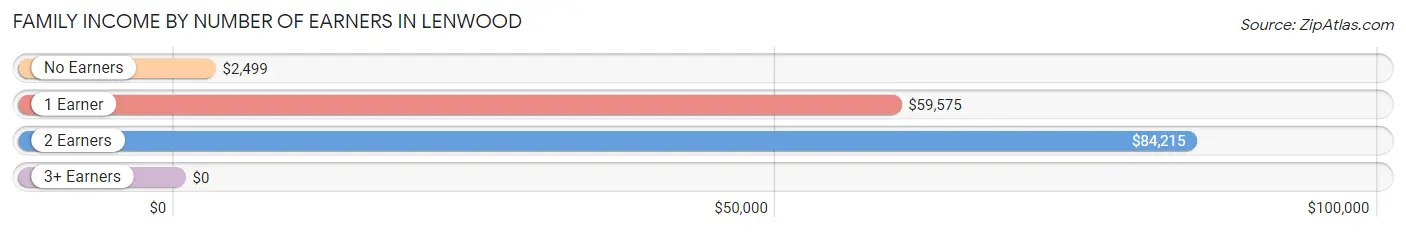
| Number of Earners | # Families | Median Income |
| No Earners | 108 (11.1%) | $2,499 |
| 1 Earner | 484 (49.5%) | $59,575 |
| 2 Earners | 185 (18.9%) | $84,215 |
| 3+ Earners | 200 (20.5%) | $0 |
| Total | 977 (100.0%) | $77,661 |
Household Income in Lenwood
Household Income Brackets in Lenwood
With 260 households falling in the category, the $150,000 to $199,999 income range is the most frequent in Lenwood, accounting for 21.0% of all households. In contrast, only 14 households (1.1%) fall into the $200,000+ income bracket, making it the least populous group.
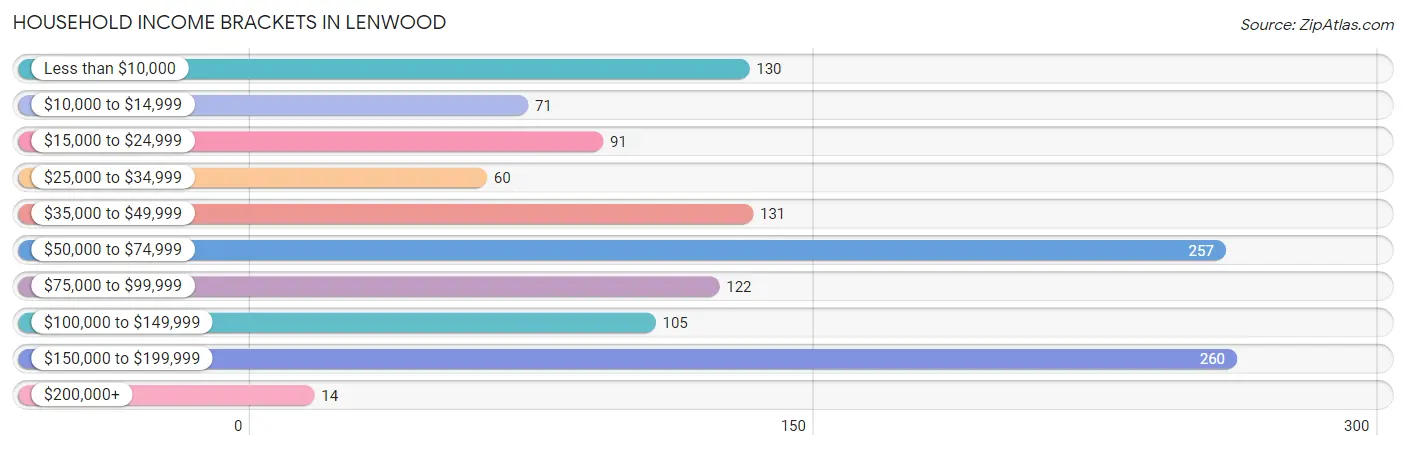
| Income Bracket | # Households | % Households |
| Less than $10,000 | 130 | 10.5% |
| $10,000 to $14,999 | 71 | 5.7% |
| $15,000 to $24,999 | 91 | 7.3% |
| $25,000 to $34,999 | 60 | 4.8% |
| $35,000 to $49,999 | 131 | 10.6% |
| $50,000 to $74,999 | 257 | 20.7% |
| $75,000 to $99,999 | 122 | 9.8% |
| $100,000 to $149,999 | 105 | 8.5% |
| $150,000 to $199,999 | 260 | 21.0% |
| $200,000+ | 14 | 1.1% |
Household Income by Householder Age in Lenwood
The median household income in Lenwood is $68,882, with the highest median household income of $68,875 found in the 25 to 44 years age bracket for the primary householder. A total of 525 households (42.3%) fall into this category. Meanwhile, the 15 to 24 years age bracket for the primary householder has the lowest median household income of $0, with 12 households (1.0%) in this group.
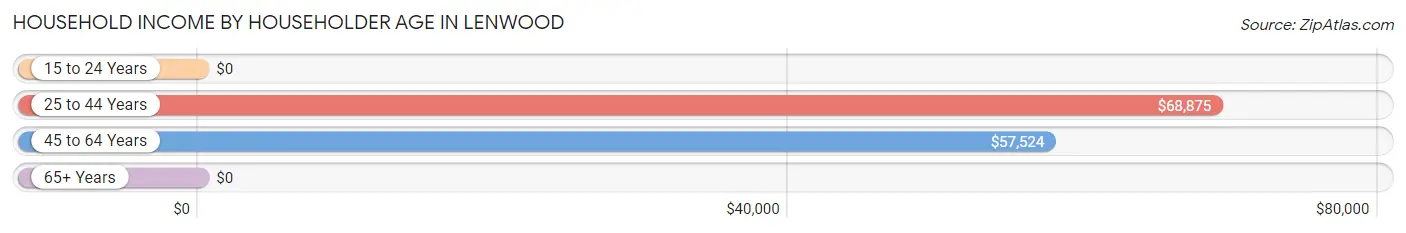
| Income Bracket | # Households | Median Income |
| 15 to 24 Years | 12 (1.0%) | $0 |
| 25 to 44 Years | 525 (42.3%) | $68,875 |
| 45 to 64 Years | 309 (24.9%) | $57,524 |
| 65+ Years | 394 (31.8%) | $0 |
| Total | 1,240 (100.0%) | $68,882 |
Poverty in Lenwood
Income Below Poverty by Sex and Age in Lenwood
With 16.3% poverty level for males and 24.3% for females among the residents of Lenwood, 35 to 44 year old males and under 5 year old females are the most vulnerable to poverty, with 52 males (46.0%) and 135 females (70.3%) in their respective age groups living below the poverty level.
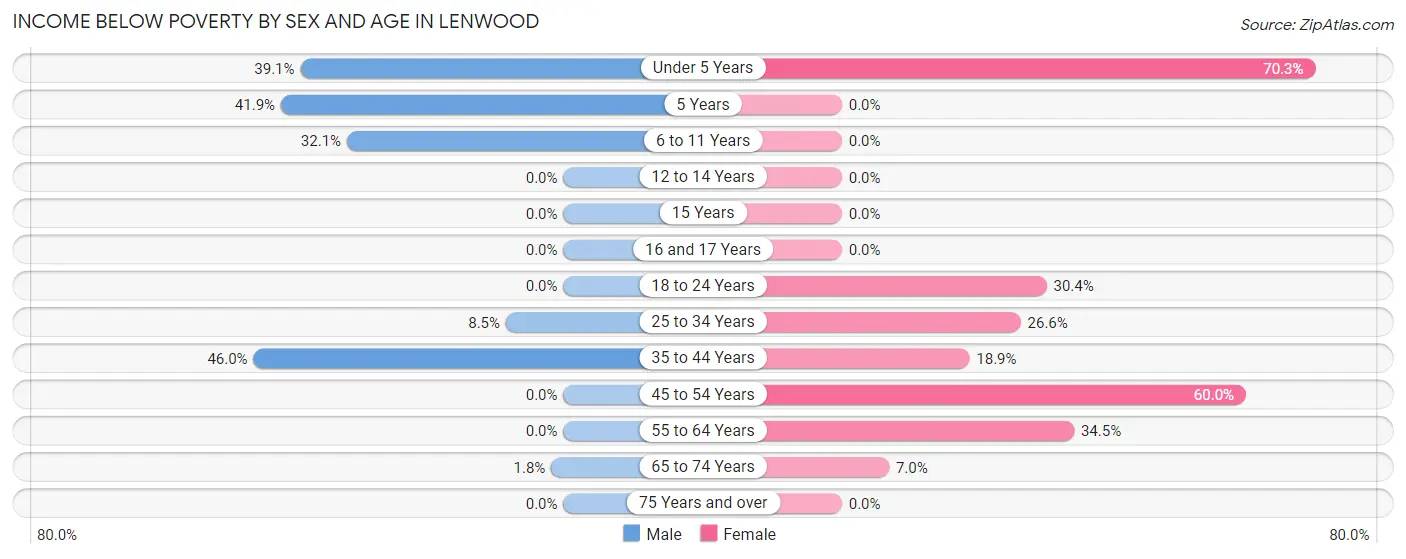
| Age Bracket | Male | Female |
| Under 5 Years | 132 (39.1%) | 135 (70.3%) |
| 5 Years | 39 (41.9%) | 0 (0.0%) |
| 6 to 11 Years | 90 (32.1%) | 0 (0.0%) |
| 12 to 14 Years | 0 (0.0%) | 0 (0.0%) |
| 15 Years | 0 (0.0%) | 0 (0.0%) |
| 16 and 17 Years | 0 (0.0%) | 0 (0.0%) |
| 18 to 24 Years | 0 (0.0%) | 38 (30.4%) |
| 25 to 34 Years | 34 (8.5%) | 107 (26.6%) |
| 35 to 44 Years | 52 (46.0%) | 50 (18.9%) |
| 45 to 54 Years | 0 (0.0%) | 12 (60.0%) |
| 55 to 64 Years | 0 (0.0%) | 90 (34.5%) |
| 65 to 74 Years | 5 (1.8%) | 18 (7.0%) |
| 75 Years and over | 0 (0.0%) | 0 (0.0%) |
| Total | 352 (16.3%) | 450 (24.3%) |
Income Above Poverty by Sex and Age in Lenwood
According to the poverty statistics in Lenwood, males aged 12 to 14 years and females aged 5 years are the age groups that are most secure financially, with 100.0% of males and 100.0% of females in these age groups living above the poverty line.
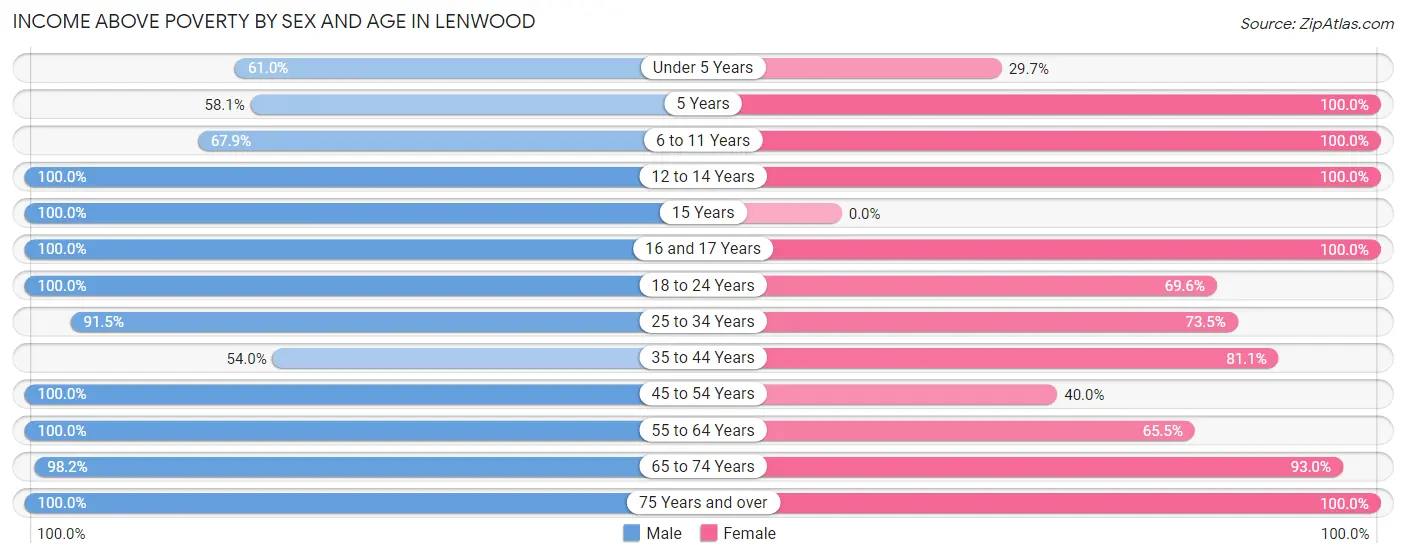
| Age Bracket | Male | Female |
| Under 5 Years | 206 (61.0%) | 57 (29.7%) |
| 5 Years | 54 (58.1%) | 21 (100.0%) |
| 6 to 11 Years | 190 (67.9%) | 68 (100.0%) |
| 12 to 14 Years | 103 (100.0%) | 106 (100.0%) |
| 15 Years | 19 (100.0%) | 0 (0.0%) |
| 16 and 17 Years | 121 (100.0%) | 42 (100.0%) |
| 18 to 24 Years | 157 (100.0%) | 87 (69.6%) |
| 25 to 34 Years | 364 (91.5%) | 296 (73.5%) |
| 35 to 44 Years | 61 (54.0%) | 214 (81.1%) |
| 45 to 54 Years | 130 (100.0%) | 8 (40.0%) |
| 55 to 64 Years | 118 (100.0%) | 171 (65.5%) |
| 65 to 74 Years | 271 (98.2%) | 239 (93.0%) |
| 75 Years and over | 17 (100.0%) | 94 (100.0%) |
| Total | 1,811 (83.7%) | 1,403 (75.7%) |
Income Below Poverty Among Married-Couple Families in Lenwood
The poverty statistics for married-couple families in Lenwood show that 4.9% or 29 of the total 596 families live below the poverty line. Families with 3 or 4 children have the highest poverty rate of 100.0%, comprising of 29 families. On the other hand, families with no children have the lowest poverty rate of 0.0%, which includes 0 families.
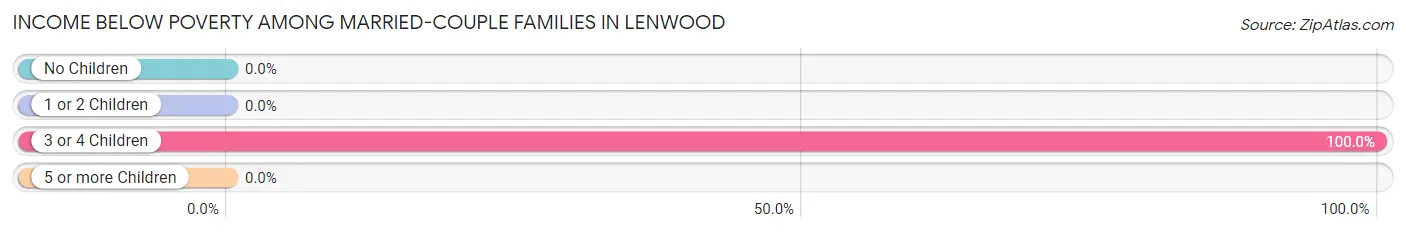
| Children | Above Poverty | Below Poverty |
| No Children | 339 (100.0%) | 0 (0.0%) |
| 1 or 2 Children | 192 (100.0%) | 0 (0.0%) |
| 3 or 4 Children | 0 (0.0%) | 29 (100.0%) |
| 5 or more Children | 36 (100.0%) | 0 (0.0%) |
| Total | 567 (95.1%) | 29 (4.9%) |
Income Below Poverty Among Single-Parent Households in Lenwood
According to the poverty data in Lenwood, 27.0% or 34 single-father households and 44.3% or 113 single-mother households are living below the poverty line. Among single-father households, those with 1 or 2 children have the highest poverty rate, with 34 households (68.0%) experiencing poverty. Likewise, among single-mother households, those with 1 or 2 children have the highest poverty rate, with 113 households (53.8%) falling below the poverty line.
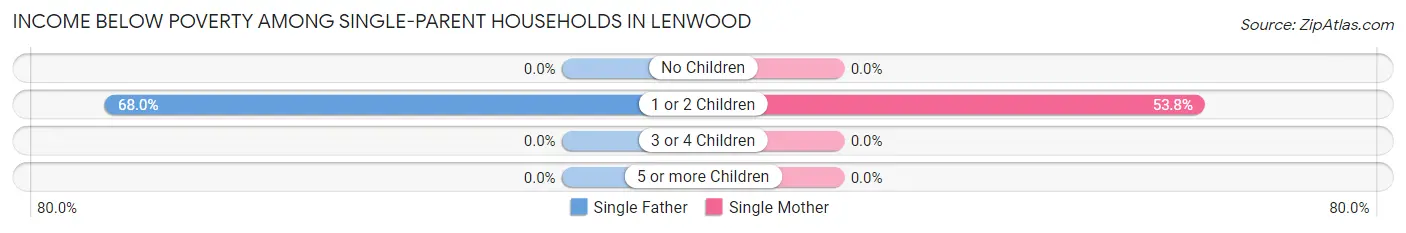
| Children | Single Father | Single Mother |
| No Children | 0 (0.0%) | 0 (0.0%) |
| 1 or 2 Children | 34 (68.0%) | 113 (53.8%) |
| 3 or 4 Children | 0 (0.0%) | 0 (0.0%) |
| 5 or more Children | 0 (0.0%) | 0 (0.0%) |
| Total | 34 (27.0%) | 113 (44.3%) |
Income Below Poverty Among Married-Couple vs Single-Parent Households in Lenwood
The poverty data for Lenwood shows that 29 of the married-couple family households (4.9%) and 147 of the single-parent households (38.6%) are living below the poverty level. Within the married-couple family households, those with 3 or 4 children have the highest poverty rate, with 29 households (100.0%) falling below the poverty line. Among the single-parent households, those with 1 or 2 children have the highest poverty rate, with 147 household (56.5%) living below poverty.
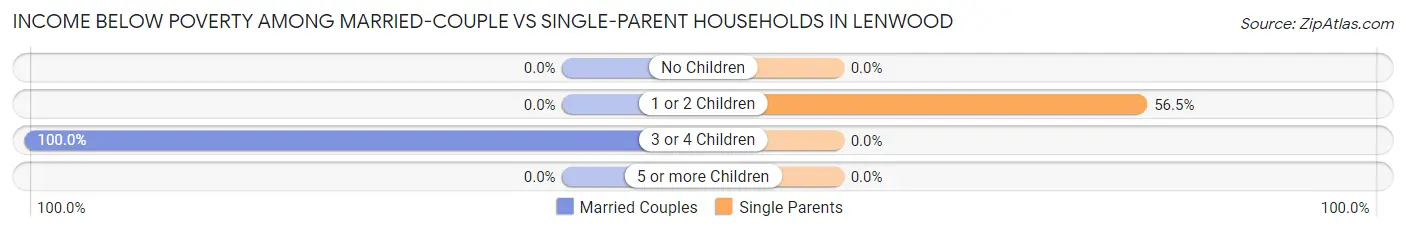
| Children | Married-Couple Families | Single-Parent Households |
| No Children | 0 (0.0%) | 0 (0.0%) |
| 1 or 2 Children | 0 (0.0%) | 147 (56.5%) |
| 3 or 4 Children | 29 (100.0%) | 0 (0.0%) |
| 5 or more Children | 0 (0.0%) | 0 (0.0%) |
| Total | 29 (4.9%) | 147 (38.6%) |
Race in Lenwood
The most populous races in Lenwood are White / Caucasian (2,602 | 64.8%), Hispanic or Latino (1,915 | 47.7%), and Some other Race (564 | 14.0%).
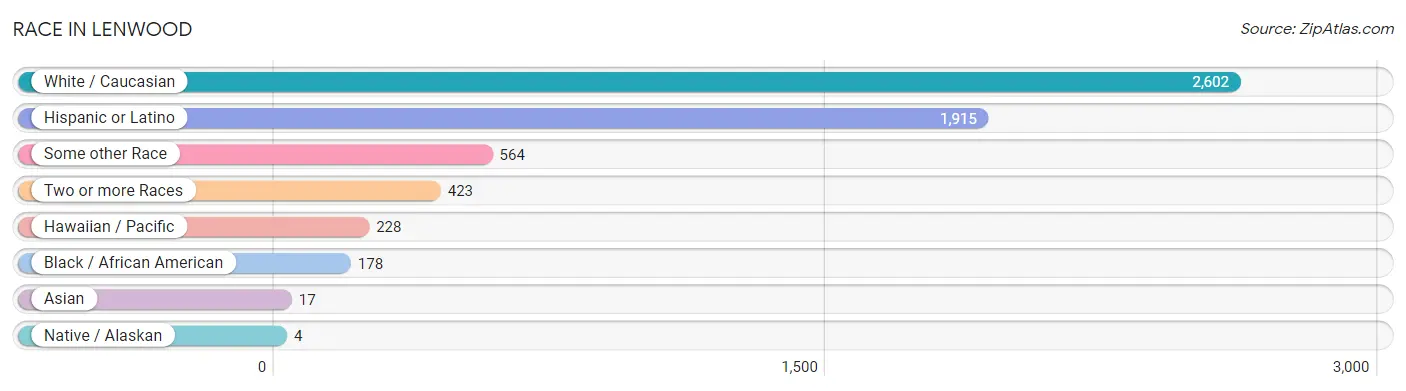
| Race | # Population | % Population |
| Asian | 17 | 0.4% |
| Black / African American | 178 | 4.4% |
| Hawaiian / Pacific | 228 | 5.7% |
| Hispanic or Latino | 1,915 | 47.7% |
| Native / Alaskan | 4 | 0.1% |
| White / Caucasian | 2,602 | 64.8% |
| Two or more Races | 423 | 10.5% |
| Some other Race | 564 | 14.0% |
| Total | 4,016 | 100.0% |
Ancestry in Lenwood
The most populous ancestries reported in Lenwood are Mexican (1,489 | 37.1%), Puerto Rican (262 | 6.5%), Samoan (228 | 5.7%), German (218 | 5.4%), and American (149 | 3.7%), together accounting for 58.4% of all Lenwood residents.
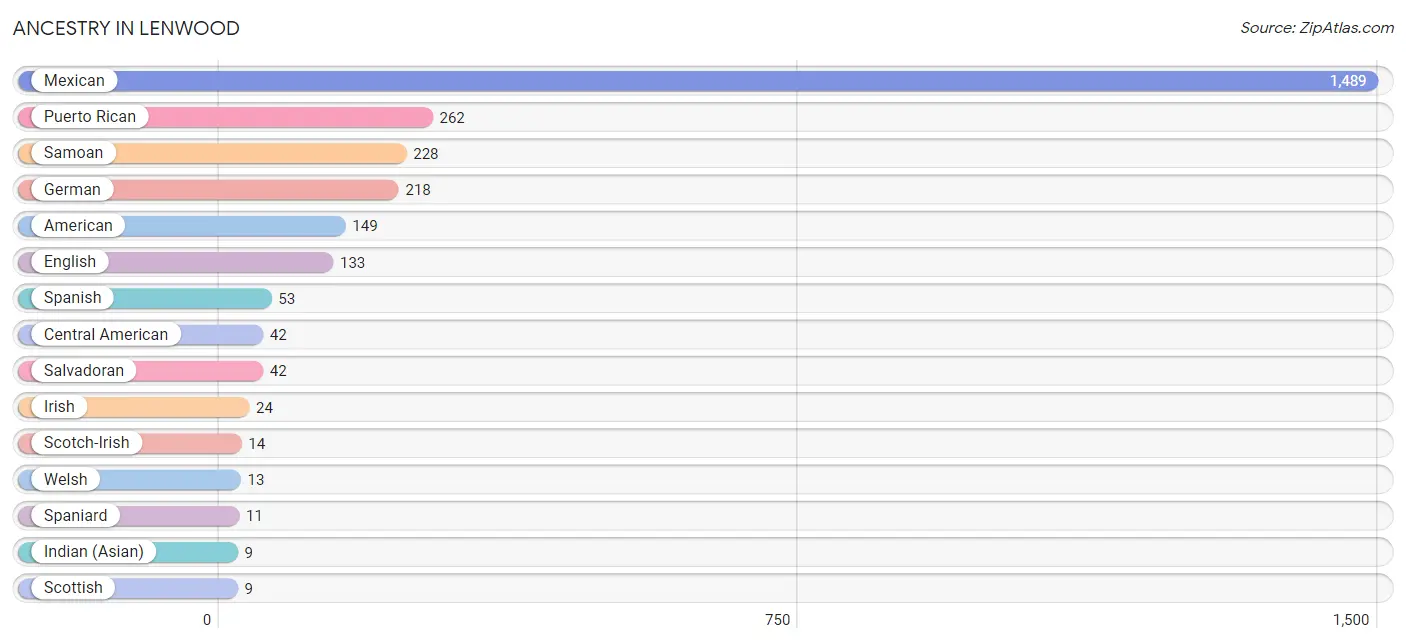
| Ancestry | # Population | % Population |
| American | 149 | 3.7% |
| Central American | 42 | 1.1% |
| Choctaw | 4 | 0.1% |
| English | 133 | 3.3% |
| French | 7 | 0.2% |
| German | 218 | 5.4% |
| Indian (Asian) | 9 | 0.2% |
| Irish | 24 | 0.6% |
| Mexican | 1,489 | 37.1% |
| Puerto Rican | 262 | 6.5% |
| Salvadoran | 42 | 1.1% |
| Samoan | 228 | 5.7% |
| Scotch-Irish | 14 | 0.4% |
| Scottish | 9 | 0.2% |
| Spaniard | 11 | 0.3% |
| Spanish | 53 | 1.3% |
| Sri Lankan | 8 | 0.2% |
| Welsh | 13 | 0.3% | View All 18 Rows |
Immigrants in Lenwood
The most numerous immigrant groups reported in Lenwood came from Central America (204 | 5.1%), Latin America (204 | 5.1%), Mexico (204 | 5.1%), Asia (20 | 0.5%), and Bangladesh (20 | 0.5%), together accounting for 16.2% of all Lenwood residents.
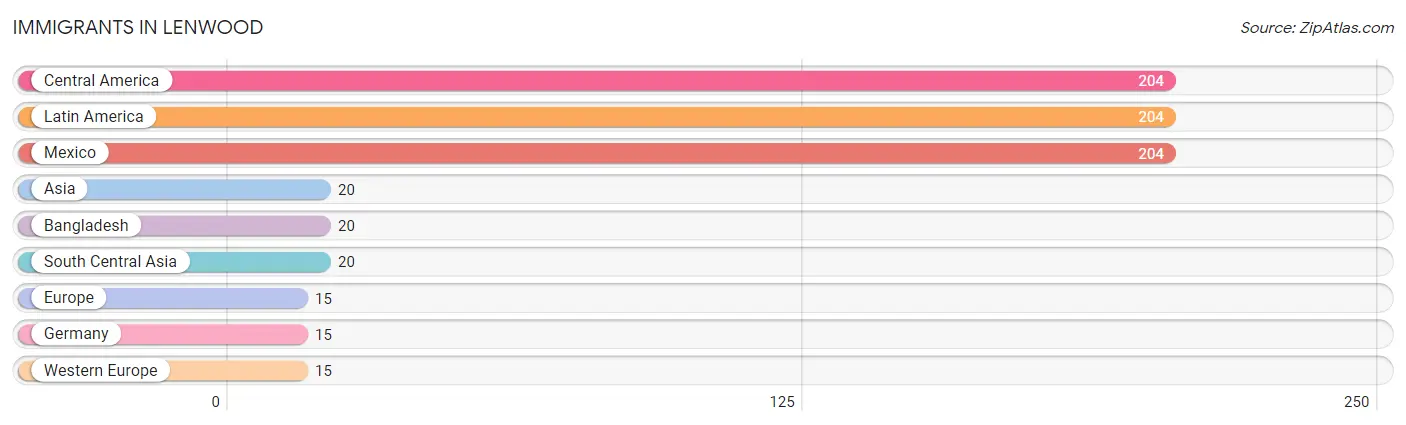
| Immigration Origin | # Population | % Population |
| Asia | 20 | 0.5% |
| Bangladesh | 20 | 0.5% |
| Central America | 204 | 5.1% |
| Europe | 15 | 0.4% |
| Germany | 15 | 0.4% |
| Latin America | 204 | 5.1% |
| Mexico | 204 | 5.1% |
| South Central Asia | 20 | 0.5% |
| Western Europe | 15 | 0.4% | View All 9 Rows |
Sex and Age in Lenwood
Sex and Age in Lenwood
The most populous age groups in Lenwood are Under 5 Years (338 | 15.6%) for men and 30 to 34 Years (225 | 12.1%) for women.
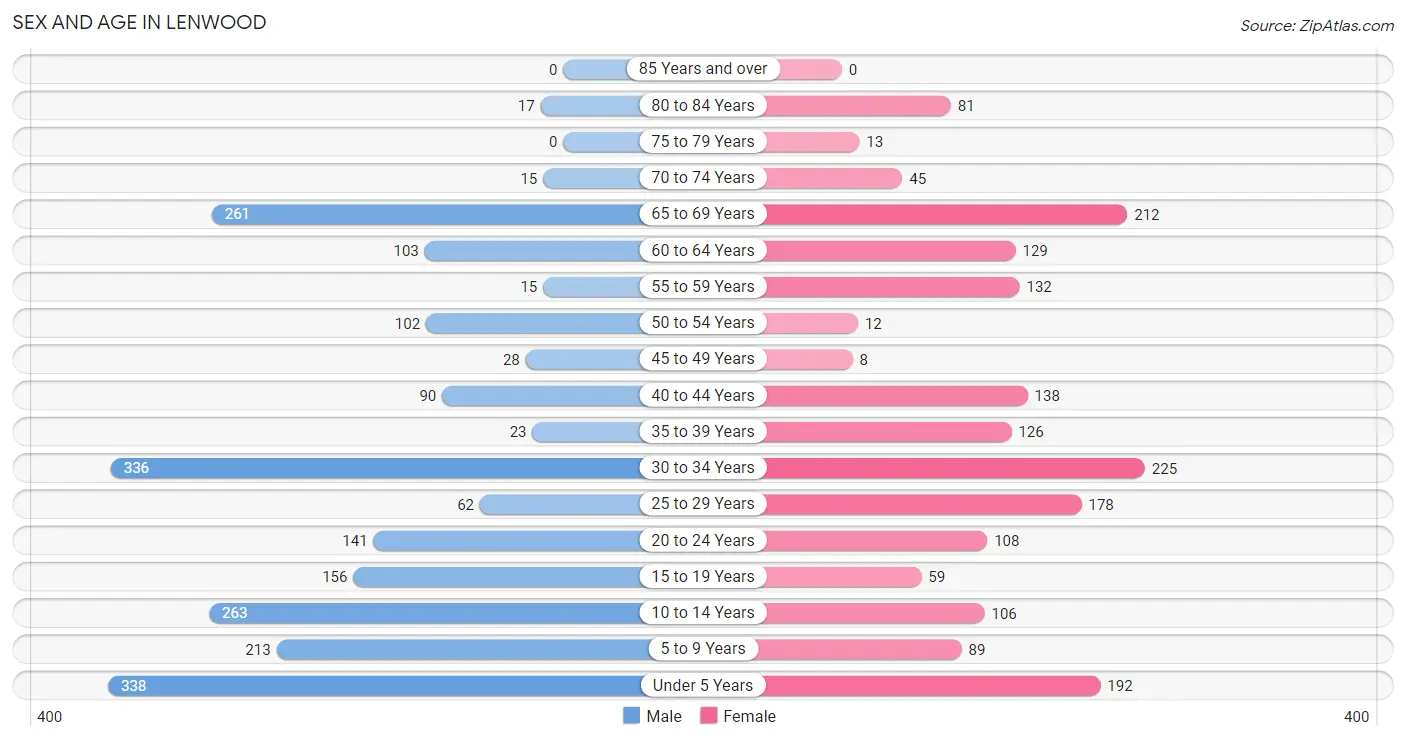
| Age Bracket | Male | Female |
| Under 5 Years | 338 (15.6%) | 192 (10.4%) |
| 5 to 9 Years | 213 (9.9%) | 89 (4.8%) |
| 10 to 14 Years | 263 (12.2%) | 106 (5.7%) |
| 15 to 19 Years | 156 (7.2%) | 59 (3.2%) |
| 20 to 24 Years | 141 (6.5%) | 108 (5.8%) |
| 25 to 29 Years | 62 (2.9%) | 178 (9.6%) |
| 30 to 34 Years | 336 (15.5%) | 225 (12.1%) |
| 35 to 39 Years | 23 (1.1%) | 126 (6.8%) |
| 40 to 44 Years | 90 (4.2%) | 138 (7.4%) |
| 45 to 49 Years | 28 (1.3%) | 8 (0.4%) |
| 50 to 54 Years | 102 (4.7%) | 12 (0.6%) |
| 55 to 59 Years | 15 (0.7%) | 132 (7.1%) |
| 60 to 64 Years | 103 (4.8%) | 129 (7.0%) |
| 65 to 69 Years | 261 (12.1%) | 212 (11.4%) |
| 70 to 74 Years | 15 (0.7%) | 45 (2.4%) |
| 75 to 79 Years | 0 (0.0%) | 13 (0.7%) |
| 80 to 84 Years | 17 (0.8%) | 81 (4.4%) |
| 85 Years and over | 0 (0.0%) | 0 (0.0%) |
| Total | 2,163 (100.0%) | 1,853 (100.0%) |
Families and Households in Lenwood
Median Family Size in Lenwood
The median family size in Lenwood is 3.67 persons per family, with single female/mother families (255 | 26.1%) accounting for the largest median family size of 4.12 persons per family. On the other hand, single male/father families (126 | 12.9%) represent the smallest median family size with 3.45 persons per family.
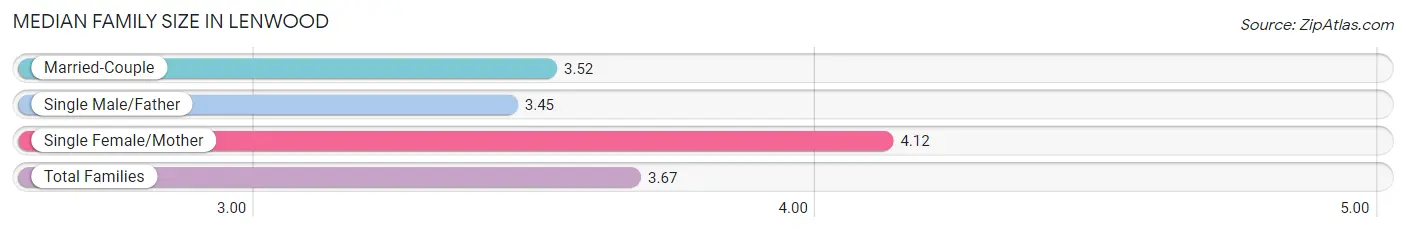
| Family Type | # Families | Family Size |
| Married-Couple | 596 (61.0%) | 3.52 |
| Single Male/Father | 126 (12.9%) | 3.45 |
| Single Female/Mother | 255 (26.1%) | 4.12 |
| Total Families | 977 (100.0%) | 3.67 |
Median Household Size in Lenwood
The median household size in Lenwood is 3.24 persons per household, with single female/mother households (255 | 20.6%) accounting for the largest median household size of 4.44 persons per household. non-family households (263 | 21.2%) represent the smallest median household size with 1.03 persons per household.
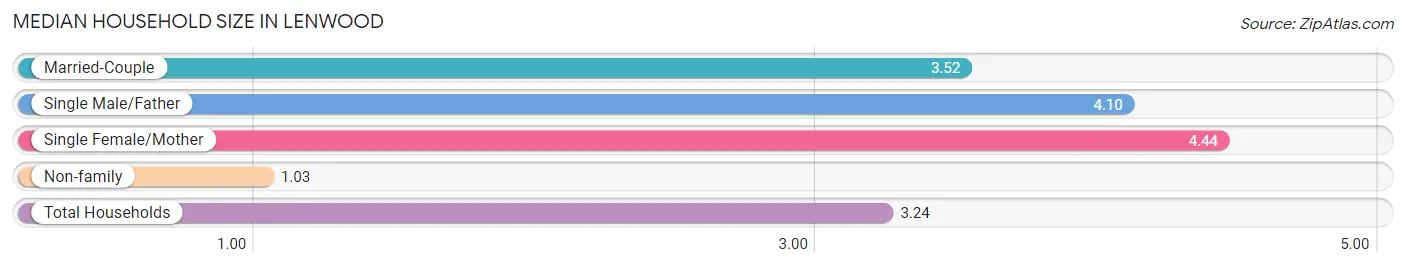
| Household Type | # Households | Household Size |
| Married-Couple | 596 (48.1%) | 3.52 |
| Single Male/Father | 126 (10.2%) | 4.10 |
| Single Female/Mother | 255 (20.6%) | 4.44 |
| Non-family | 263 (21.2%) | 1.03 |
| Total Households | 1,240 (100.0%) | 3.24 |
Household Size by Marriage Status in Lenwood
Out of a total of 1,240 households in Lenwood, 977 (78.8%) are family households, while 263 (21.2%) are nonfamily households. The most numerous type of family households are 3-person households, comprising 344, and the most common type of nonfamily households are 1-person households, comprising 254.
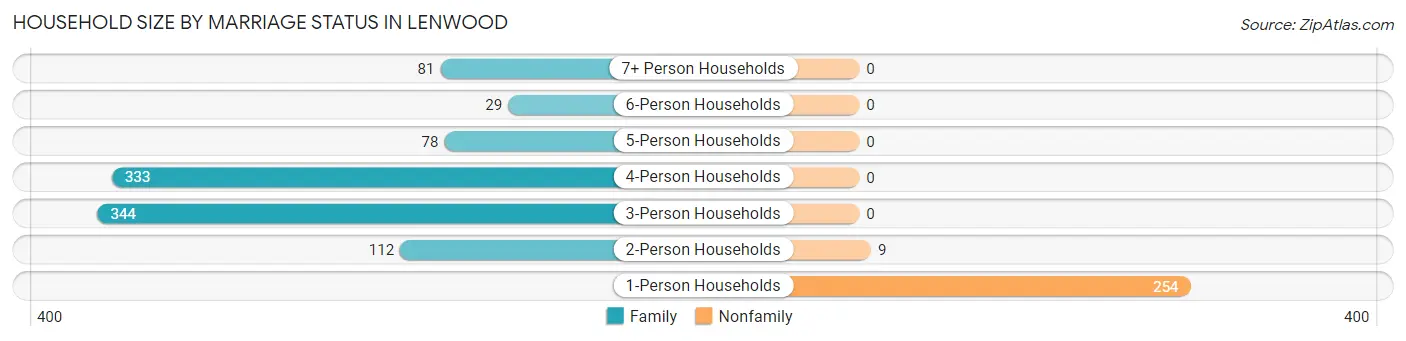
| Household Size | Family Households | Nonfamily Households |
| 1-Person Households | - | 254 (20.5%) |
| 2-Person Households | 112 (9.0%) | 9 (0.7%) |
| 3-Person Households | 344 (27.7%) | 0 (0.0%) |
| 4-Person Households | 333 (26.9%) | 0 (0.0%) |
| 5-Person Households | 78 (6.3%) | 0 (0.0%) |
| 6-Person Households | 29 (2.3%) | 0 (0.0%) |
| 7+ Person Households | 81 (6.5%) | 0 (0.0%) |
| Total | 977 (78.8%) | 263 (21.2%) |
Female Fertility in Lenwood
Fertility by Age in Lenwood
Average fertility rate in Lenwood is 53.0 births per 1,000 women. Women in the age bracket of 35 to 50 years have the highest fertility rate with 165.0 births per 1,000 women. Women in the age bracket of 35 to 50 years acount for 100.0% of all women with births.
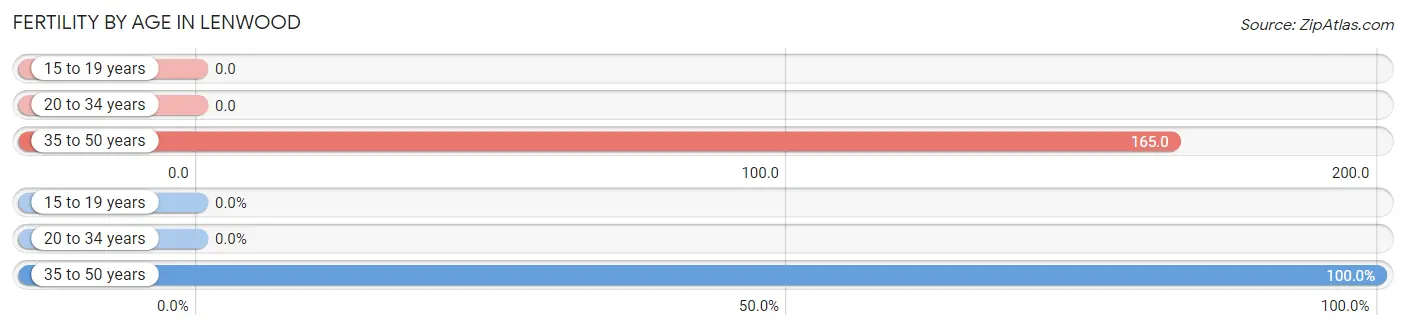
| Age Bracket | Women with Births | Births / 1,000 Women |
| 15 to 19 years | 0 (0.0%) | 0.0 |
| 20 to 34 years | 0 (0.0%) | 0.0 |
| 35 to 50 years | 45 (100.0%) | 165.0 |
| Total | 45 (100.0%) | 53.0 |
Fertility by Age by Marriage Status in Lenwood
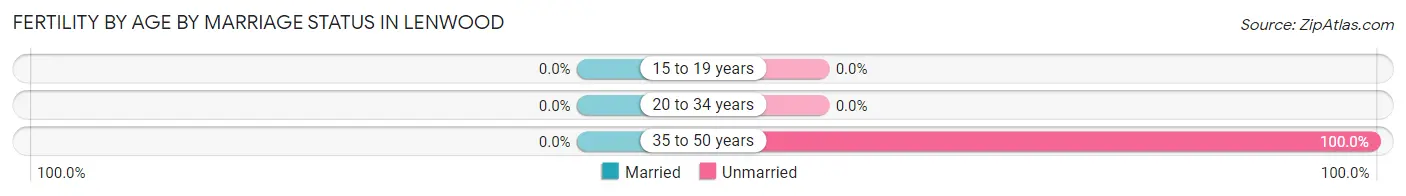
| Age Bracket | Married | Unmarried |
| 15 to 19 years | 0 (0.0%) | 0 (0.0%) |
| 20 to 34 years | 0 (0.0%) | 0 (0.0%) |
| 35 to 50 years | 0 (0.0%) | 45 (100.0%) |
| Total | 0 (0.0%) | 45 (100.0%) |
Fertility by Education in Lenwood
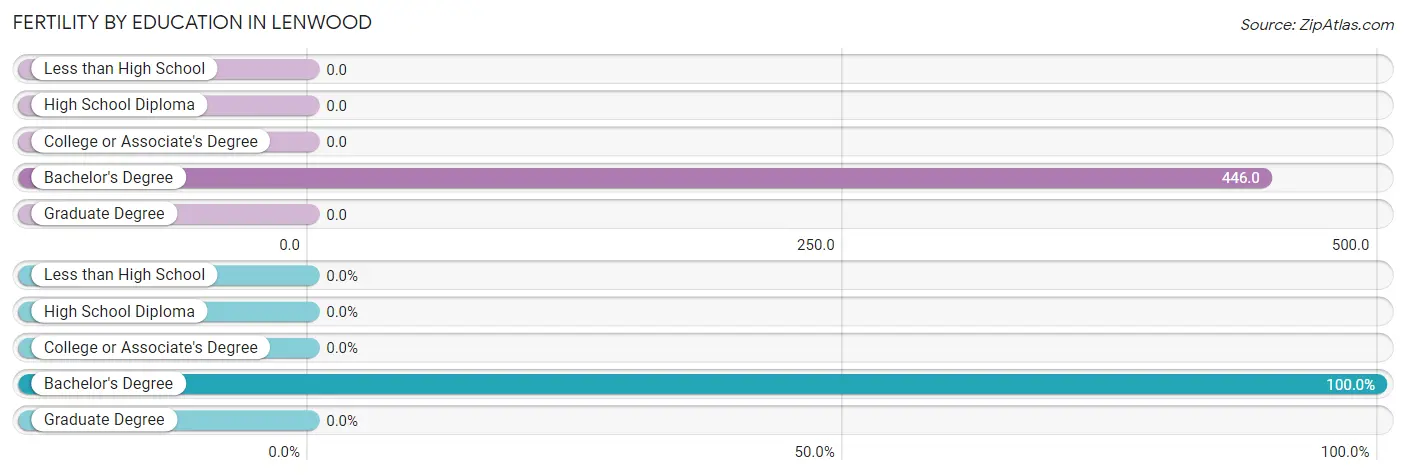
| Educational Attainment | Women with Births | Births / 1,000 Women |
| Less than High School | 0 (0.0%) | 0.0 |
| High School Diploma | 0 (0.0%) | 0.0 |
| College or Associate's Degree | 0 (0.0%) | 0.0 |
| Bachelor's Degree | 45 (100.0%) | 446.0 |
| Graduate Degree | 0 (0.0%) | 0.0 |
| Total | 45 (100.0%) | 53.0 |
Fertility by Education by Marriage Status in Lenwood
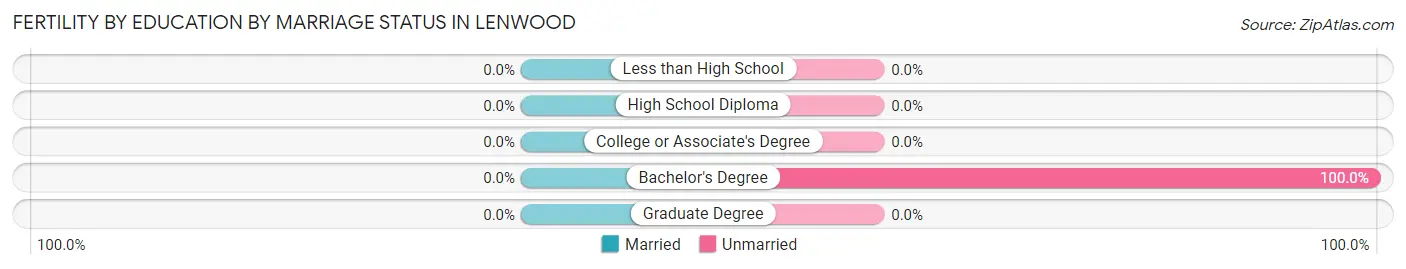
| Educational Attainment | Married | Unmarried |
| Less than High School | 0 (0.0%) | 0 (0.0%) |
| High School Diploma | 0 (0.0%) | 0 (0.0%) |
| College or Associate's Degree | 0 (0.0%) | 0 (0.0%) |
| Bachelor's Degree | 0 (0.0%) | 45 (100.0%) |
| Graduate Degree | 0 (0.0%) | 0 (0.0%) |
| Total | 0 (0.0%) | 45 (100.0%) |
Employment Characteristics in Lenwood
Employment by Class of Employer in Lenwood
Among the 1,452 employed individuals in Lenwood, private company employees (879 | 60.5%), federal government employees (282 | 19.4%), and not-for-profit organizations (128 | 8.8%) make up the most common classes of employment.
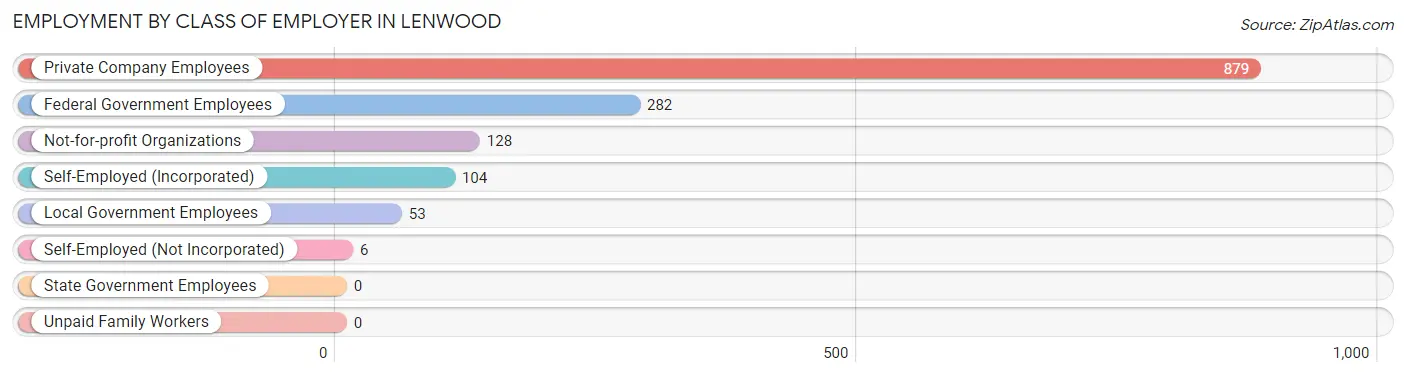
| Employer Class | # Employees | % Employees |
| Private Company Employees | 879 | 60.5% |
| Self-Employed (Incorporated) | 104 | 7.2% |
| Self-Employed (Not Incorporated) | 6 | 0.4% |
| Not-for-profit Organizations | 128 | 8.8% |
| Local Government Employees | 53 | 3.6% |
| State Government Employees | 0 | 0.0% |
| Federal Government Employees | 282 | 19.4% |
| Unpaid Family Workers | 0 | 0.0% |
| Total | 1,452 | 100.0% |
Employment Status by Age in Lenwood
According to the labor force statistics for Lenwood, out of the total population over 16 years of age (2,796), 55.8% or 1,560 individuals are in the labor force, with 6.7% or 105 of them unemployed. The age group with the highest labor force participation rate is 30 to 34 years, with 96.1% or 539 individuals in the labor force. Within the labor force, the 30 to 34 years age range has the highest percentage of unemployed individuals, with 14.6% or 79 of them being unemployed.
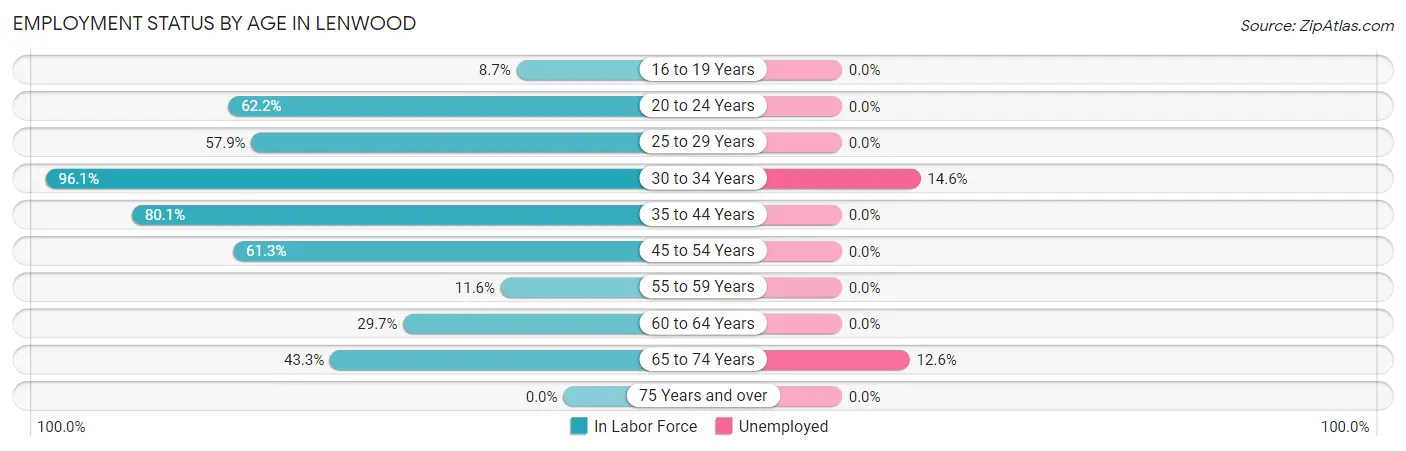
| Age Bracket | In Labor Force | Unemployed |
| 16 to 19 Years | 17 (8.7%) | 0 (0.0%) |
| 20 to 24 Years | 155 (62.2%) | 0 (0.0%) |
| 25 to 29 Years | 139 (57.9%) | 0 (0.0%) |
| 30 to 34 Years | 539 (96.1%) | 79 (14.6%) |
| 35 to 44 Years | 302 (80.1%) | 0 (0.0%) |
| 45 to 54 Years | 92 (61.3%) | 0 (0.0%) |
| 55 to 59 Years | 17 (11.6%) | 0 (0.0%) |
| 60 to 64 Years | 69 (29.7%) | 0 (0.0%) |
| 65 to 74 Years | 231 (43.3%) | 29 (12.6%) |
| 75 Years and over | 0 (0.0%) | 0 (0.0%) |
| Total | 1,560 (55.8%) | 105 (6.7%) |
Employment Status by Educational Attainment in Lenwood
According to labor force statistics for Lenwood, 67.8% of individuals (1,157) out of the total population between 25 and 64 years of age (1,707) are in the labor force, with 6.5% or 75 of them being unemployed. The group with the highest labor force participation rate are those with the educational attainment of bachelor's degree or higher, with 89.0% or 234 individuals in the labor force. Within the labor force, individuals with high school diploma education have the highest percentage of unemployment, with 19.0% or 73 of them being unemployed.
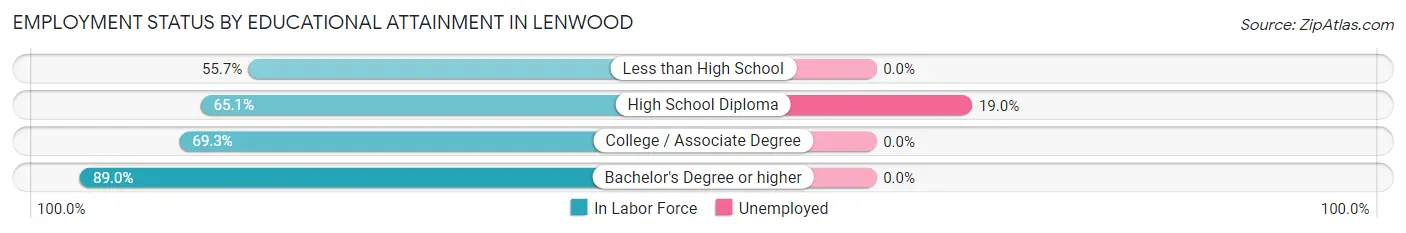
| Educational Attainment | In Labor Force | Unemployed |
| Less than High School | 214 (55.7%) | 0 (0.0%) |
| High School Diploma | 385 (65.1%) | 112 (19.0%) |
| College / Associate Degree | 325 (69.3%) | 0 (0.0%) |
| Bachelor's Degree or higher | 234 (89.0%) | 0 (0.0%) |
| Total | 1,157 (67.8%) | 111 (6.5%) |
Employment Occupations by Sex in Lenwood
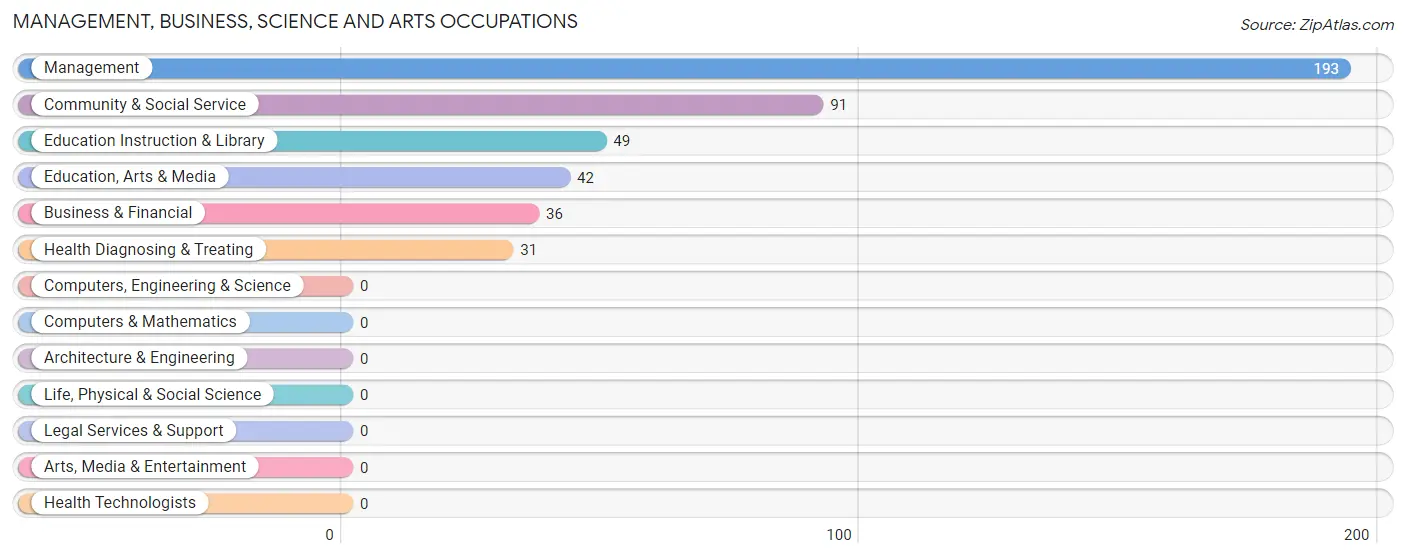
Management, Business, Science and Arts Occupations
The most common Management, Business, Science and Arts occupations in Lenwood are Management (193 | 13.6%), Community & Social Service (91 | 6.4%), Education Instruction & Library (49 | 3.5%), Education, Arts & Media (42 | 3.0%), and Business & Financial (36 | 2.5%).
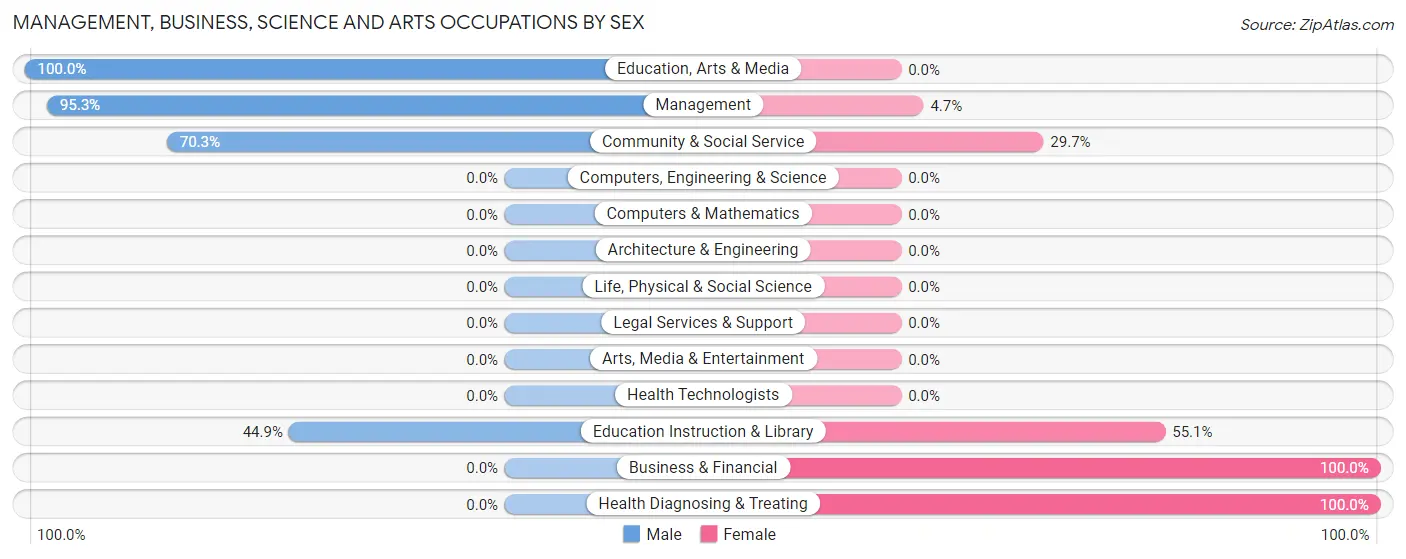
Management, Business, Science and Arts Occupations by Sex
Within the Management, Business, Science and Arts occupations in Lenwood, the most male-oriented occupations are Education, Arts & Media (100.0%), Management (95.3%), and Community & Social Service (70.3%), while the most female-oriented occupations are Business & Financial (100.0%), Health Diagnosing & Treating (100.0%), and Education Instruction & Library (55.1%).
| Occupation | Male | Female |
| Management | 184 (95.3%) | 9 (4.7%) |
| Business & Financial | 0 (0.0%) | 36 (100.0%) |
| Computers, Engineering & Science | 0 (0.0%) | 0 (0.0%) |
| Computers & Mathematics | 0 (0.0%) | 0 (0.0%) |
| Architecture & Engineering | 0 (0.0%) | 0 (0.0%) |
| Life, Physical & Social Science | 0 (0.0%) | 0 (0.0%) |
| Community & Social Service | 64 (70.3%) | 27 (29.7%) |
| Education, Arts & Media | 42 (100.0%) | 0 (0.0%) |
| Legal Services & Support | 0 (0.0%) | 0 (0.0%) |
| Education Instruction & Library | 22 (44.9%) | 27 (55.1%) |
| Arts, Media & Entertainment | 0 (0.0%) | 0 (0.0%) |
| Health Diagnosing & Treating | 0 (0.0%) | 31 (100.0%) |
| Health Technologists | 0 (0.0%) | 0 (0.0%) |
| Total (Category) | 248 (70.7%) | 103 (29.3%) |
| Total (Overall) | 716 (50.4%) | 704 (49.6%) |
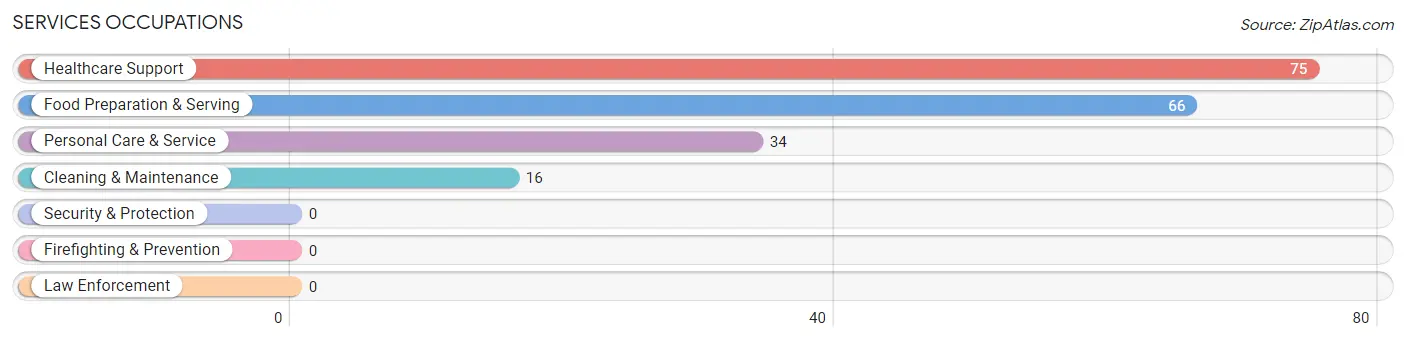
Services Occupations
The most common Services occupations in Lenwood are Healthcare Support (75 | 5.3%), Food Preparation & Serving (66 | 4.6%), Personal Care & Service (34 | 2.4%), and Cleaning & Maintenance (16 | 1.1%).
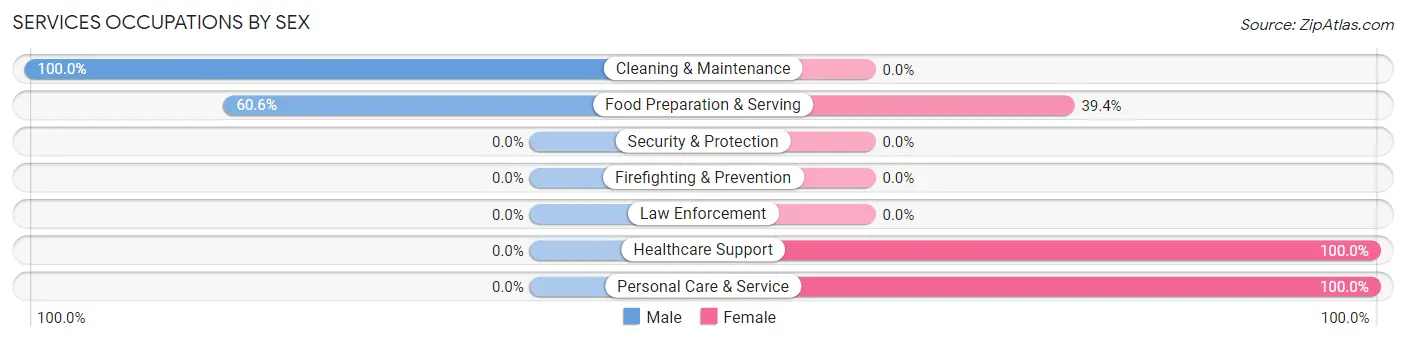
Services Occupations by Sex
Within the Services occupations in Lenwood, the most male-oriented occupations are Cleaning & Maintenance (100.0%), and Food Preparation & Serving (60.6%), while the most female-oriented occupations are Healthcare Support (100.0%), Personal Care & Service (100.0%), and Food Preparation & Serving (39.4%).
| Occupation | Male | Female |
| Healthcare Support | 0 (0.0%) | 75 (100.0%) |
| Security & Protection | 0 (0.0%) | 0 (0.0%) |
| Firefighting & Prevention | 0 (0.0%) | 0 (0.0%) |
| Law Enforcement | 0 (0.0%) | 0 (0.0%) |
| Food Preparation & Serving | 40 (60.6%) | 26 (39.4%) |
| Cleaning & Maintenance | 16 (100.0%) | 0 (0.0%) |
| Personal Care & Service | 0 (0.0%) | 34 (100.0%) |
| Total (Category) | 56 (29.3%) | 135 (70.7%) |
| Total (Overall) | 716 (50.4%) | 704 (49.6%) |
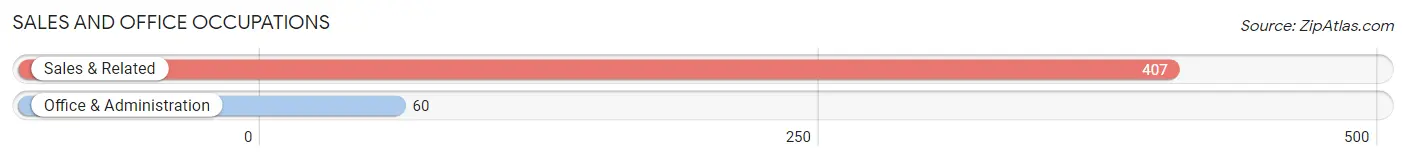
Sales and Office Occupations
The most common Sales and Office occupations in Lenwood are Sales & Related (407 | 28.7%), and Office & Administration (60 | 4.2%).
Sales and Office Occupations by Sex
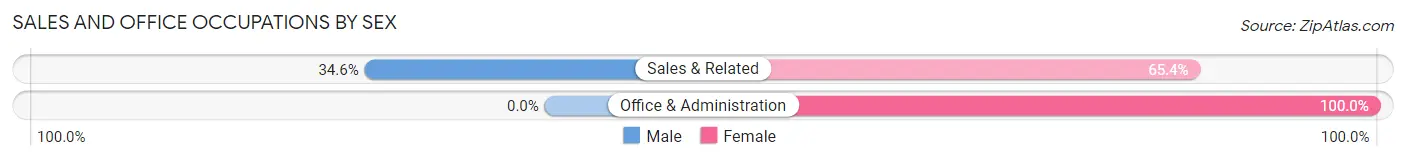
| Occupation | Male | Female |
| Sales & Related | 141 (34.6%) | 266 (65.4%) |
| Office & Administration | 0 (0.0%) | 60 (100.0%) |
| Total (Category) | 141 (30.2%) | 326 (69.8%) |
| Total (Overall) | 716 (50.4%) | 704 (49.6%) |
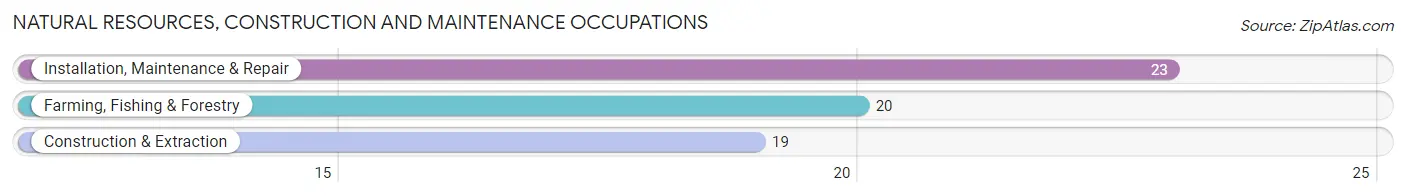
Natural Resources, Construction and Maintenance Occupations
The most common Natural Resources, Construction and Maintenance occupations in Lenwood are Installation, Maintenance & Repair (23 | 1.6%), Farming, Fishing & Forestry (20 | 1.4%), and Construction & Extraction (19 | 1.3%).
Natural Resources, Construction and Maintenance Occupations by Sex
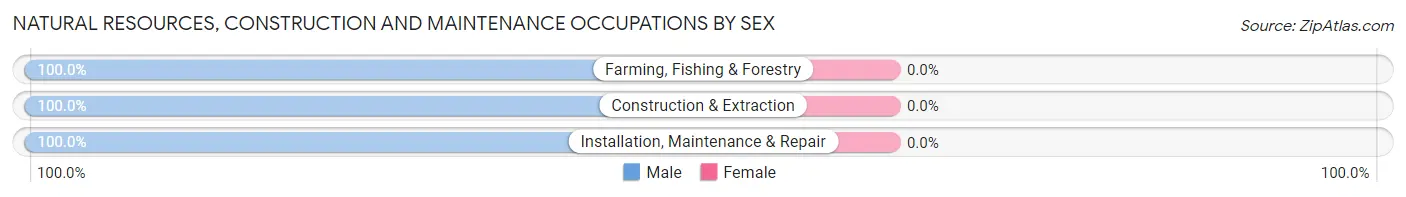
| Occupation | Male | Female |
| Farming, Fishing & Forestry | 20 (100.0%) | 0 (0.0%) |
| Construction & Extraction | 19 (100.0%) | 0 (0.0%) |
| Installation, Maintenance & Repair | 23 (100.0%) | 0 (0.0%) |
| Total (Category) | 62 (100.0%) | 0 (0.0%) |
| Total (Overall) | 716 (50.4%) | 704 (49.6%) |
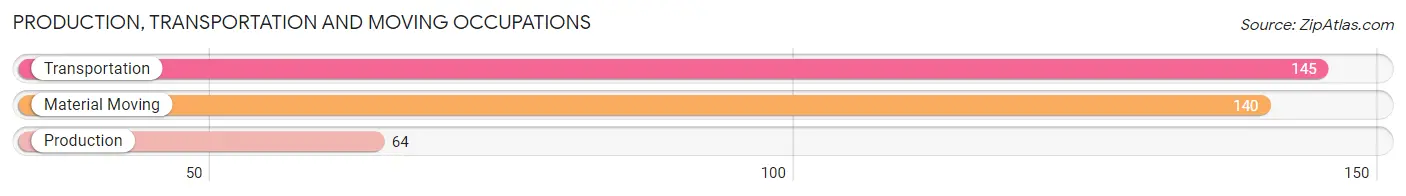
Production, Transportation and Moving Occupations
The most common Production, Transportation and Moving occupations in Lenwood are Transportation (145 | 10.2%), Material Moving (140 | 9.9%), and Production (64 | 4.5%).
Production, Transportation and Moving Occupations by Sex
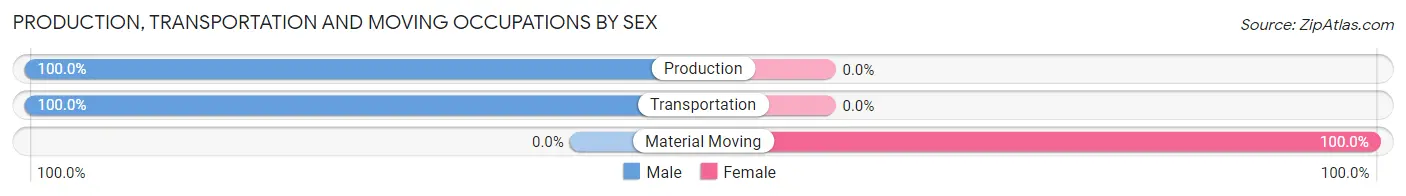
| Occupation | Male | Female |
| Production | 64 (100.0%) | 0 (0.0%) |
| Transportation | 145 (100.0%) | 0 (0.0%) |
| Material Moving | 0 (0.0%) | 140 (100.0%) |
| Total (Category) | 209 (59.9%) | 140 (40.1%) |
| Total (Overall) | 716 (50.4%) | 704 (49.6%) |
Employment Industries by Sex in Lenwood
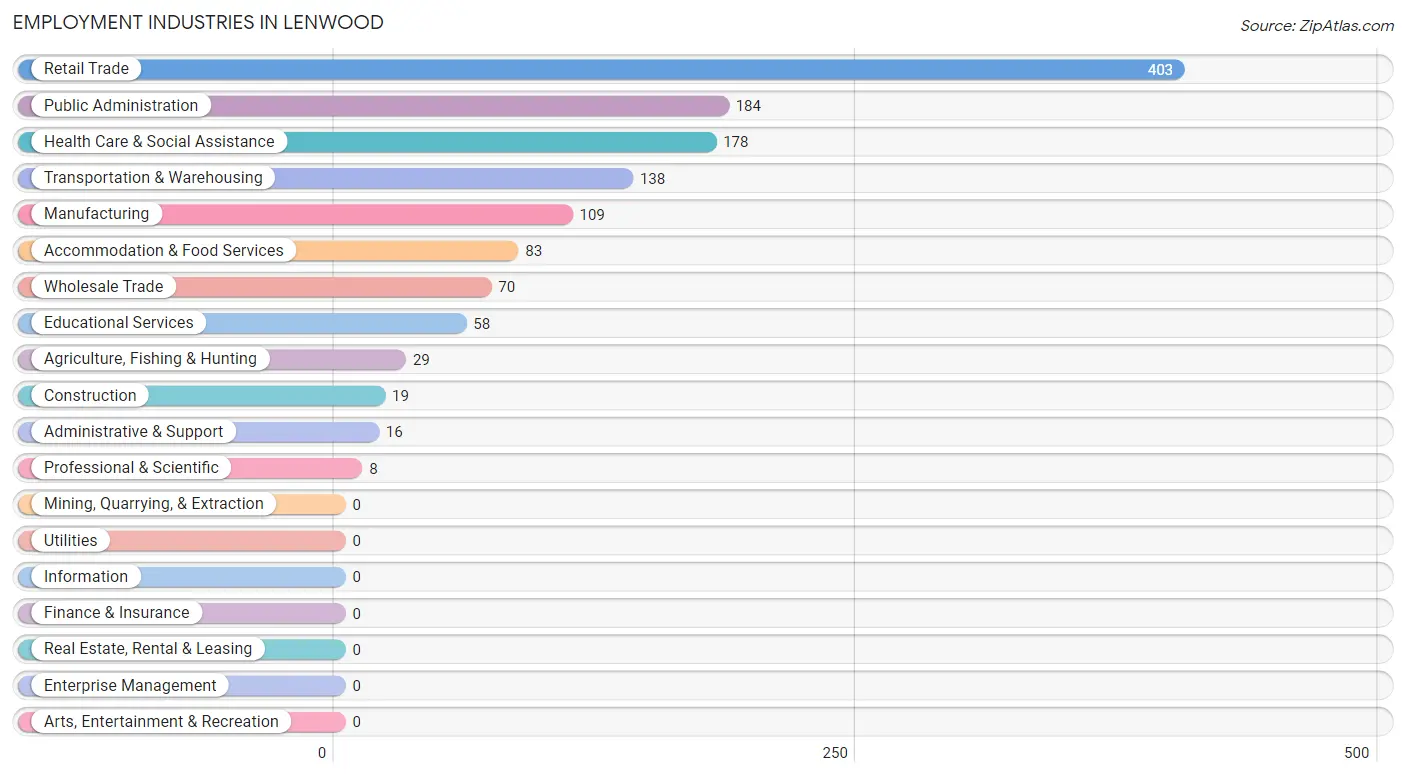
Employment Industries in Lenwood
The major employment industries in Lenwood include Retail Trade (403 | 28.4%), Public Administration (184 | 13.0%), Health Care & Social Assistance (178 | 12.5%), Transportation & Warehousing (138 | 9.7%), and Manufacturing (109 | 7.7%).
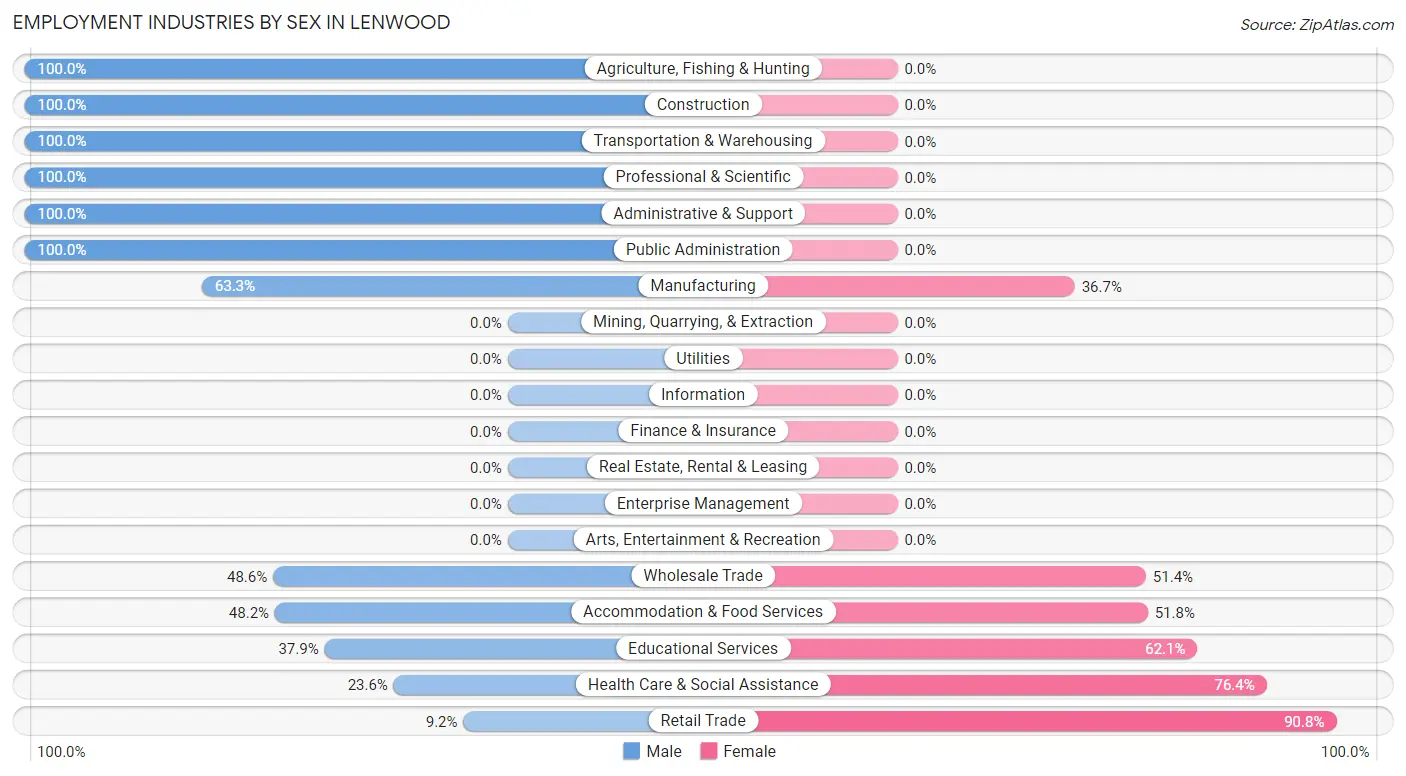
Employment Industries by Sex in Lenwood
The Lenwood industries that see more men than women are Agriculture, Fishing & Hunting (100.0%), Construction (100.0%), and Transportation & Warehousing (100.0%), whereas the industries that tend to have a higher number of women are Retail Trade (90.8%), Health Care & Social Assistance (76.4%), and Educational Services (62.1%).
| Industry | Male | Female |
| Agriculture, Fishing & Hunting | 29 (100.0%) | 0 (0.0%) |
| Mining, Quarrying, & Extraction | 0 (0.0%) | 0 (0.0%) |
| Construction | 19 (100.0%) | 0 (0.0%) |
| Manufacturing | 69 (63.3%) | 40 (36.7%) |
| Wholesale Trade | 34 (48.6%) | 36 (51.4%) |
| Retail Trade | 37 (9.2%) | 366 (90.8%) |
| Transportation & Warehousing | 138 (100.0%) | 0 (0.0%) |
| Utilities | 0 (0.0%) | 0 (0.0%) |
| Information | 0 (0.0%) | 0 (0.0%) |
| Finance & Insurance | 0 (0.0%) | 0 (0.0%) |
| Real Estate, Rental & Leasing | 0 (0.0%) | 0 (0.0%) |
| Professional & Scientific | 8 (100.0%) | 0 (0.0%) |
| Enterprise Management | 0 (0.0%) | 0 (0.0%) |
| Administrative & Support | 16 (100.0%) | 0 (0.0%) |
| Educational Services | 22 (37.9%) | 36 (62.1%) |
| Health Care & Social Assistance | 42 (23.6%) | 136 (76.4%) |
| Arts, Entertainment & Recreation | 0 (0.0%) | 0 (0.0%) |
| Accommodation & Food Services | 40 (48.2%) | 43 (51.8%) |
| Public Administration | 184 (100.0%) | 0 (0.0%) |
| Total | 716 (50.4%) | 704 (49.6%) |
Education in Lenwood
School Enrollment in Lenwood
The most common levels of schooling among the 1,155 students in Lenwood are high school (322 | 27.9%), middle school (254 | 22.0%), and elementary school (181 | 15.7%).
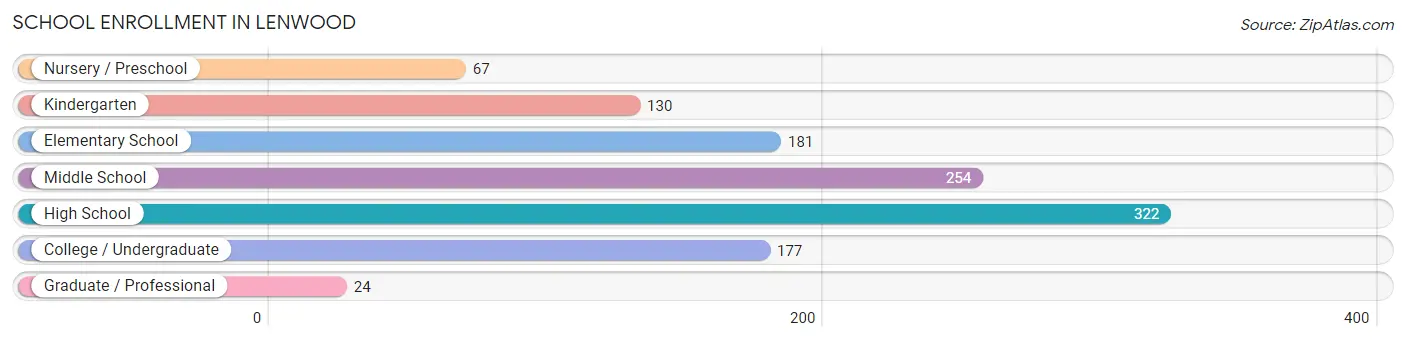
| School Level | # Students | % Students |
| Nursery / Preschool | 67 | 5.8% |
| Kindergarten | 130 | 11.3% |
| Elementary School | 181 | 15.7% |
| Middle School | 254 | 22.0% |
| High School | 322 | 27.9% |
| College / Undergraduate | 177 | 15.3% |
| Graduate / Professional | 24 | 2.1% |
| Total | 1,155 | 100.0% |
School Enrollment by Age by Funding Source in Lenwood
Out of a total of 1,155 students who are enrolled in schools in Lenwood, 49 (4.2%) attend a private institution, while the remaining 1,106 (95.8%) are enrolled in public schools. The age group of 25 to 34 year olds has the highest likelihood of being enrolled in private schools, with 49 (32.5% in the age bracket) enrolled. Conversely, the age group of 3 to 4 year olds has the lowest likelihood of being enrolled in a private school, with 67 (100.0% in the age bracket) attending a public institution.
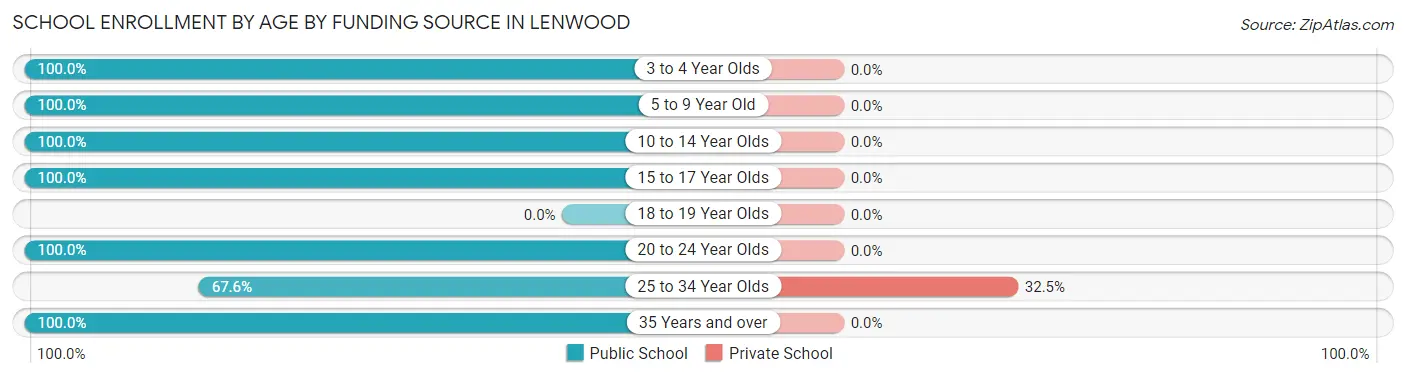
| Age Bracket | Public School | Private School |
| 3 to 4 Year Olds | 67 (100.0%) | 0 (0.0%) |
| 5 to 9 Year Old | 302 (100.0%) | 0 (0.0%) |
| 10 to 14 Year Olds | 369 (100.0%) | 0 (0.0%) |
| 15 to 17 Year Olds | 182 (100.0%) | 0 (0.0%) |
| 18 to 19 Year Olds | 0 (0.0%) | 0 (0.0%) |
| 20 to 24 Year Olds | 40 (100.0%) | 0 (0.0%) |
| 25 to 34 Year Olds | 102 (67.5%) | 49 (32.5%) |
| 35 Years and over | 44 (100.0%) | 0 (0.0%) |
| Total | 1,106 (95.8%) | 49 (4.2%) |
Educational Attainment by Field of Study in Lenwood
Business (132 | 46.0%), bio, nature & agricultural (49 | 17.1%), social sciences (45 | 15.7%), arts & humanities (43 | 15.0%), and education (18 | 6.3%) are the most common fields of study among 287 individuals in Lenwood who have obtained a bachelor's degree or higher.
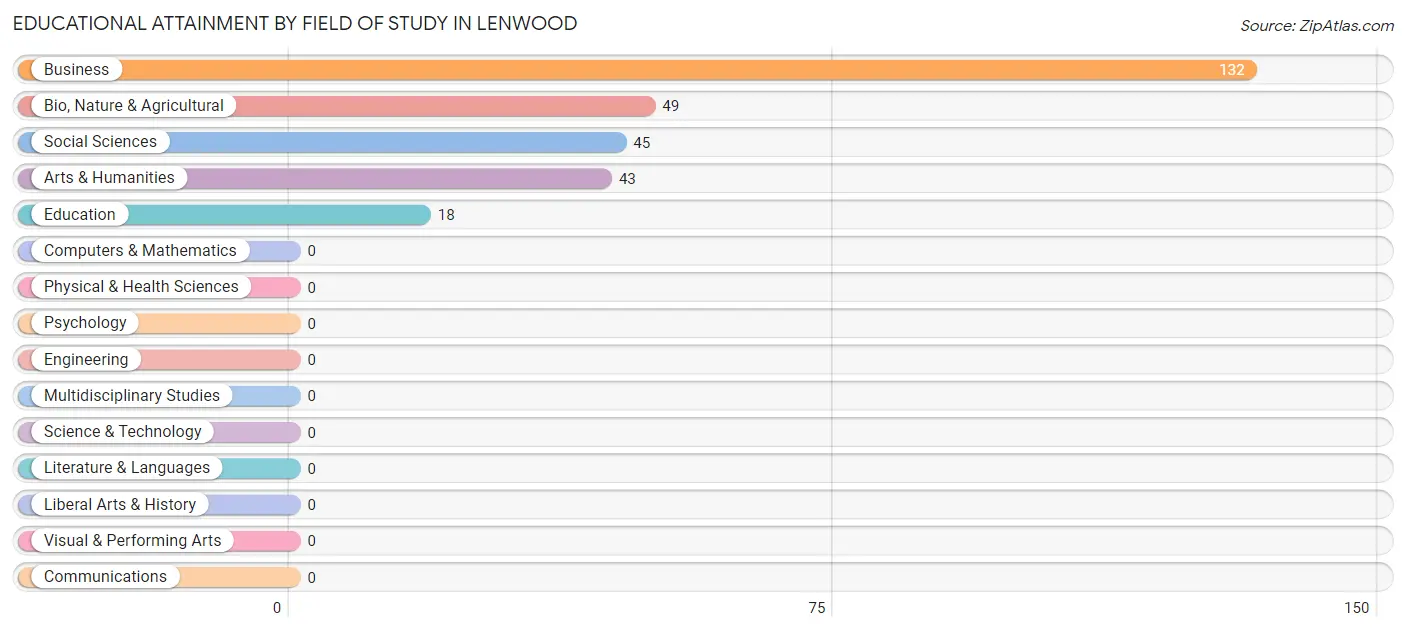
| Field of Study | # Graduates | % Graduates |
| Computers & Mathematics | 0 | 0.0% |
| Bio, Nature & Agricultural | 49 | 17.1% |
| Physical & Health Sciences | 0 | 0.0% |
| Psychology | 0 | 0.0% |
| Social Sciences | 45 | 15.7% |
| Engineering | 0 | 0.0% |
| Multidisciplinary Studies | 0 | 0.0% |
| Science & Technology | 0 | 0.0% |
| Business | 132 | 46.0% |
| Education | 18 | 6.3% |
| Literature & Languages | 0 | 0.0% |
| Liberal Arts & History | 0 | 0.0% |
| Visual & Performing Arts | 0 | 0.0% |
| Communications | 0 | 0.0% |
| Arts & Humanities | 43 | 15.0% |
| Total | 287 | 100.0% |
Transportation & Commute in Lenwood
Vehicle Availability by Sex in Lenwood
The most prevalent vehicle ownership categories in Lenwood are males with 3 vehicles (478, accounting for 63.3%) and females with 3 vehicles (264, making up 68.6%).
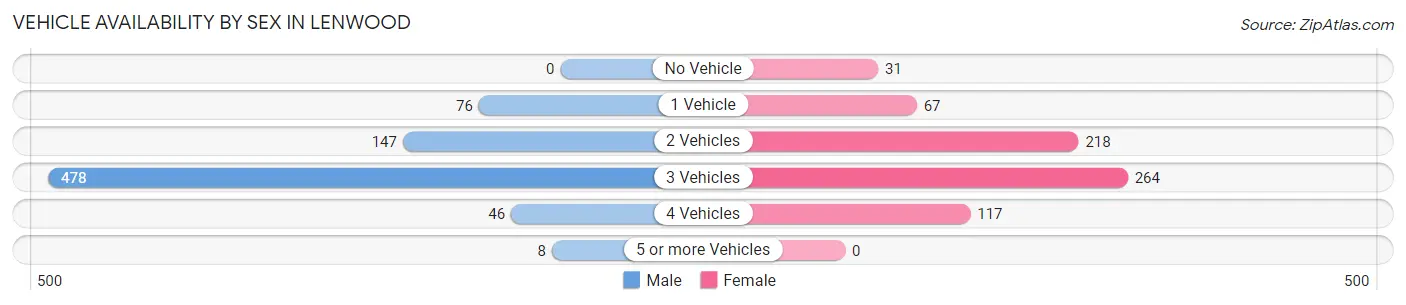
| Vehicles Available | Male | Female |
| No Vehicle | 0 (0.0%) | 31 (4.4%) |
| 1 Vehicle | 76 (10.1%) | 67 (9.6%) |
| 2 Vehicles | 147 (19.5%) | 218 (31.3%) |
| 3 Vehicles | 478 (63.3%) | 264 (37.9%) |
| 4 Vehicles | 46 (6.1%) | 117 (16.8%) |
| 5 or more Vehicles | 8 (1.1%) | 0 (0.0%) |
| Total | 755 (100.0%) | 697 (100.0%) |
Commute Time in Lenwood
The most frequently occuring commute durations in Lenwood are 15 to 19 minutes (465 commuters, 33.2%), 10 to 14 minutes (291 commuters, 20.8%), and 30 to 34 minutes (238 commuters, 17.0%).
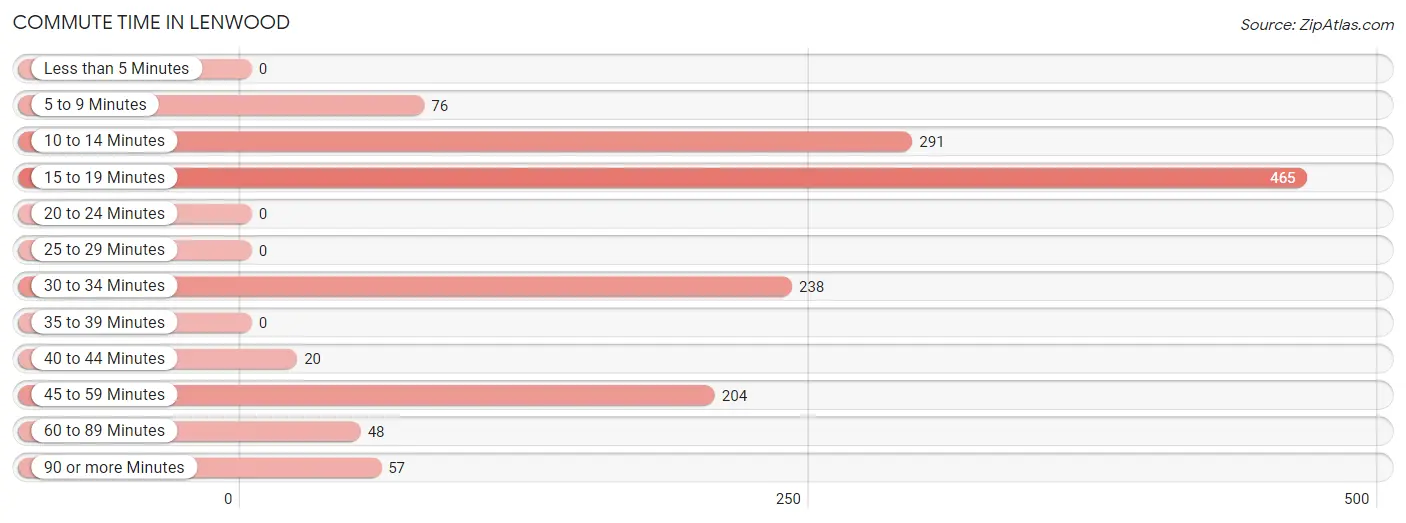
| Commute Time | # Commuters | % Commuters |
| Less than 5 Minutes | 0 | 0.0% |
| 5 to 9 Minutes | 76 | 5.4% |
| 10 to 14 Minutes | 291 | 20.8% |
| 15 to 19 Minutes | 465 | 33.2% |
| 20 to 24 Minutes | 0 | 0.0% |
| 25 to 29 Minutes | 0 | 0.0% |
| 30 to 34 Minutes | 238 | 17.0% |
| 35 to 39 Minutes | 0 | 0.0% |
| 40 to 44 Minutes | 20 | 1.4% |
| 45 to 59 Minutes | 204 | 14.6% |
| 60 to 89 Minutes | 48 | 3.4% |
| 90 or more Minutes | 57 | 4.1% |
Commute Time by Sex in Lenwood
The most common commute times in Lenwood are 45 to 59 minutes (204 commuters, 27.0%) for males and 15 to 19 minutes (307 commuters, 47.7%) for females.
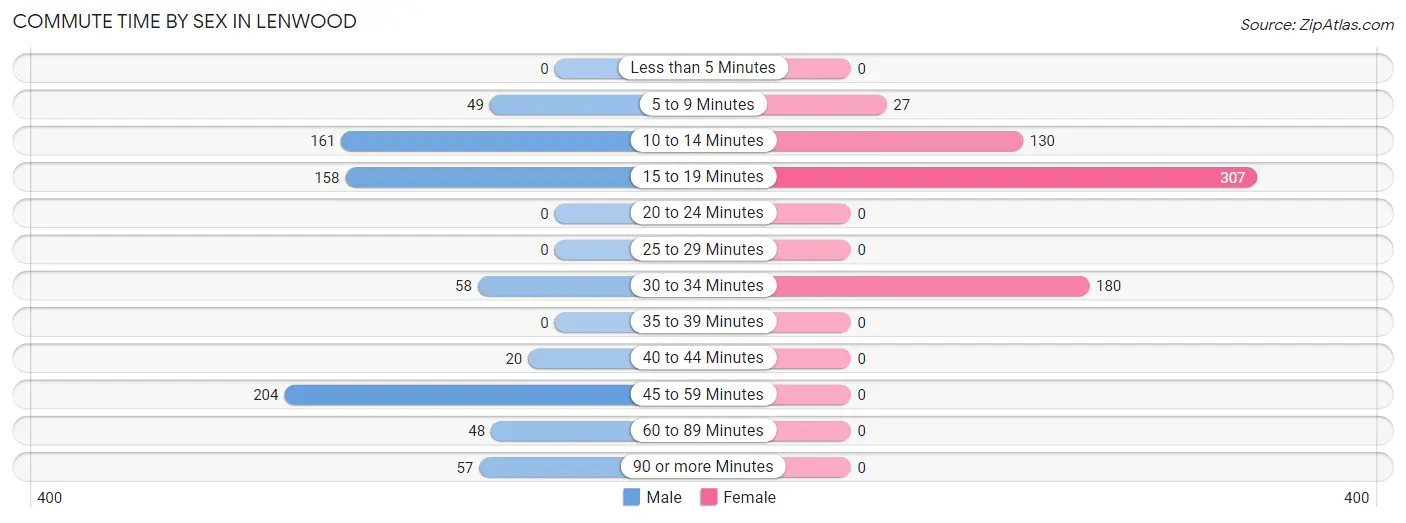
| Commute Time | Male | Female |
| Less than 5 Minutes | 0 (0.0%) | 0 (0.0%) |
| 5 to 9 Minutes | 49 (6.5%) | 27 (4.2%) |
| 10 to 14 Minutes | 161 (21.3%) | 130 (20.2%) |
| 15 to 19 Minutes | 158 (20.9%) | 307 (47.7%) |
| 20 to 24 Minutes | 0 (0.0%) | 0 (0.0%) |
| 25 to 29 Minutes | 0 (0.0%) | 0 (0.0%) |
| 30 to 34 Minutes | 58 (7.7%) | 180 (28.0%) |
| 35 to 39 Minutes | 0 (0.0%) | 0 (0.0%) |
| 40 to 44 Minutes | 20 (2.6%) | 0 (0.0%) |
| 45 to 59 Minutes | 204 (27.0%) | 0 (0.0%) |
| 60 to 89 Minutes | 48 (6.4%) | 0 (0.0%) |
| 90 or more Minutes | 57 (7.5%) | 0 (0.0%) |
Time of Departure to Work by Sex in Lenwood
The most frequent times of departure to work in Lenwood are 5:30 AM to 5:59 AM (235, 31.1%) for males and 9:00 AM to 9:59 AM (152, 23.6%) for females.
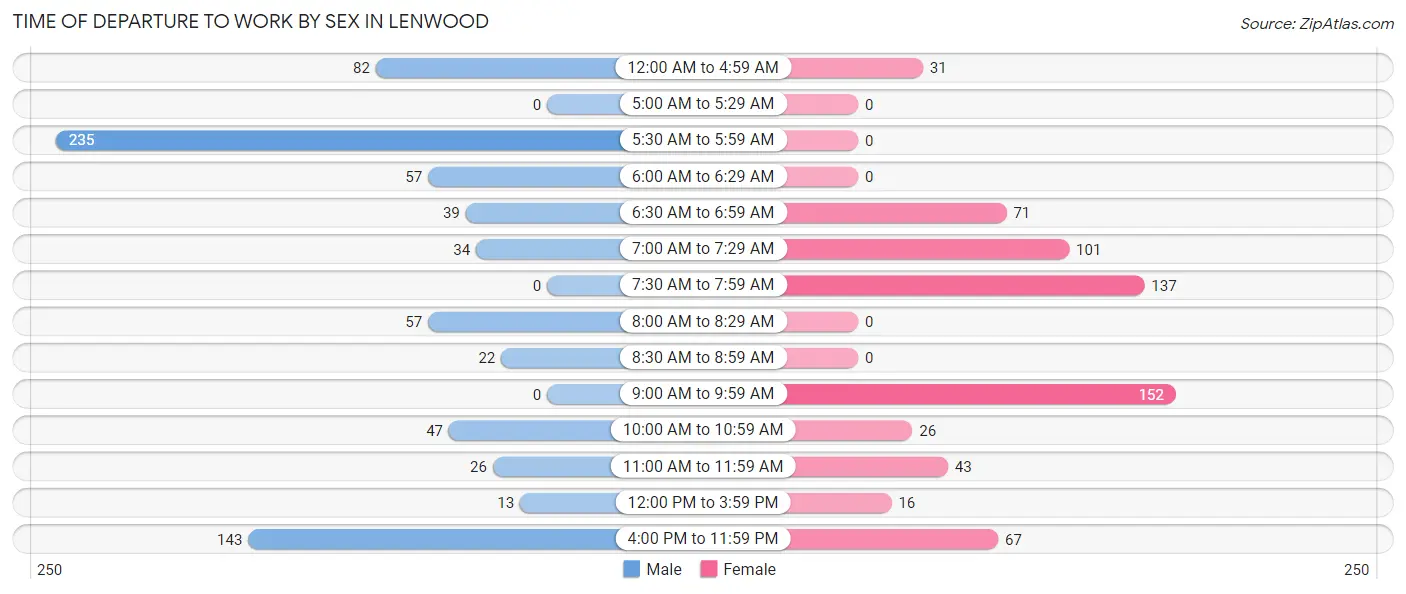
| Time of Departure | Male | Female |
| 12:00 AM to 4:59 AM | 82 (10.9%) | 31 (4.8%) |
| 5:00 AM to 5:29 AM | 0 (0.0%) | 0 (0.0%) |
| 5:30 AM to 5:59 AM | 235 (31.1%) | 0 (0.0%) |
| 6:00 AM to 6:29 AM | 57 (7.5%) | 0 (0.0%) |
| 6:30 AM to 6:59 AM | 39 (5.2%) | 71 (11.0%) |
| 7:00 AM to 7:29 AM | 34 (4.5%) | 101 (15.7%) |
| 7:30 AM to 7:59 AM | 0 (0.0%) | 137 (21.3%) |
| 8:00 AM to 8:29 AM | 57 (7.5%) | 0 (0.0%) |
| 8:30 AM to 8:59 AM | 22 (2.9%) | 0 (0.0%) |
| 9:00 AM to 9:59 AM | 0 (0.0%) | 152 (23.6%) |
| 10:00 AM to 10:59 AM | 47 (6.2%) | 26 (4.0%) |
| 11:00 AM to 11:59 AM | 26 (3.4%) | 43 (6.7%) |
| 12:00 PM to 3:59 PM | 13 (1.7%) | 16 (2.5%) |
| 4:00 PM to 11:59 PM | 143 (18.9%) | 67 (10.4%) |
| Total | 755 (100.0%) | 644 (100.0%) |
Housing Occupancy in Lenwood
Occupancy by Ownership in Lenwood
Of the total 1,240 dwellings in Lenwood, owner-occupied units account for 637 (51.4%), while renter-occupied units make up 603 (48.6%).
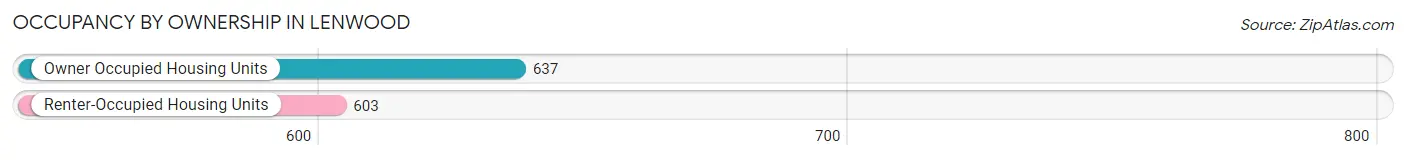
| Occupancy | # Housing Units | % Housing Units |
| Owner Occupied Housing Units | 637 | 51.4% |
| Renter-Occupied Housing Units | 603 | 48.6% |
| Total Occupied Housing Units | 1,240 | 100.0% |
Occupancy by Household Size in Lenwood
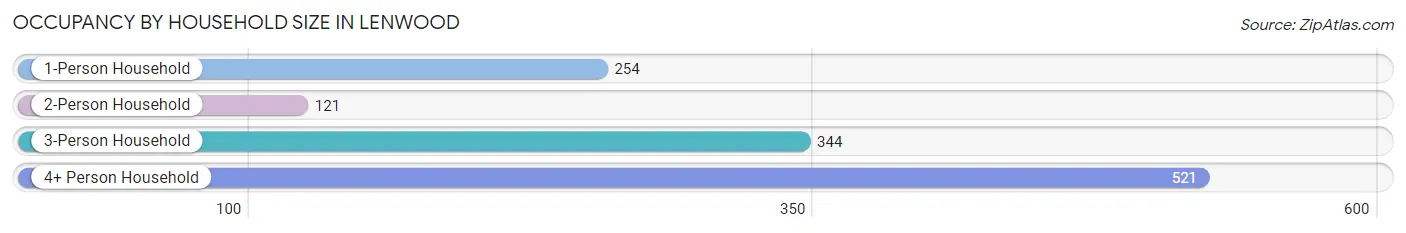
| Household Size | # Housing Units | % Housing Units |
| 1-Person Household | 254 | 20.5% |
| 2-Person Household | 121 | 9.8% |
| 3-Person Household | 344 | 27.7% |
| 4+ Person Household | 521 | 42.0% |
| Total Housing Units | 1,240 | 100.0% |
Occupancy by Ownership by Household Size in Lenwood
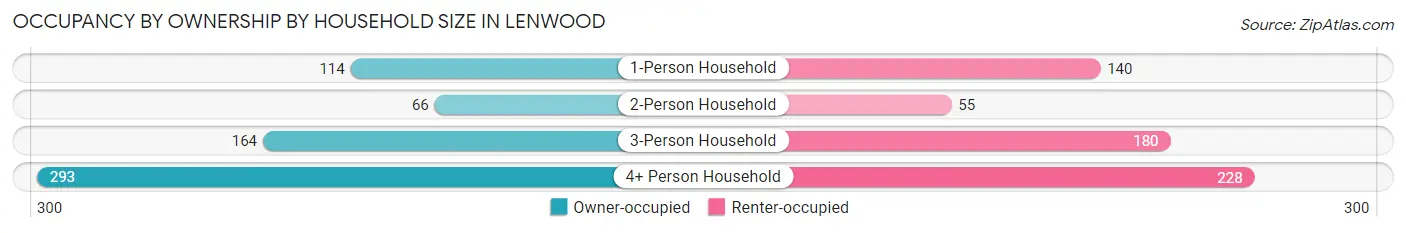
| Household Size | Owner-occupied | Renter-occupied |
| 1-Person Household | 114 (44.9%) | 140 (55.1%) |
| 2-Person Household | 66 (54.5%) | 55 (45.5%) |
| 3-Person Household | 164 (47.7%) | 180 (52.3%) |
| 4+ Person Household | 293 (56.2%) | 228 (43.8%) |
| Total Housing Units | 637 (51.4%) | 603 (48.6%) |
Occupancy by Educational Attainment in Lenwood
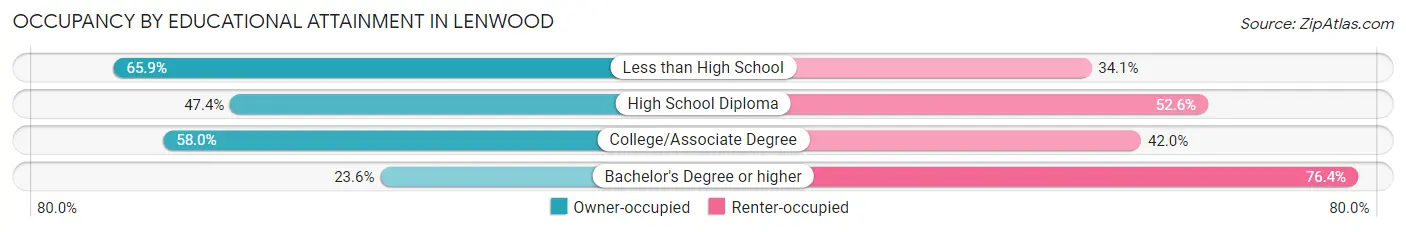
| Household Size | Owner-occupied | Renter-occupied |
| Less than High School | 112 (65.9%) | 58 (34.1%) |
| High School Diploma | 127 (47.4%) | 141 (52.6%) |
| College/Associate Degree | 352 (58.0%) | 255 (42.0%) |
| Bachelor's Degree or higher | 46 (23.6%) | 149 (76.4%) |
Occupancy by Age of Householder in Lenwood
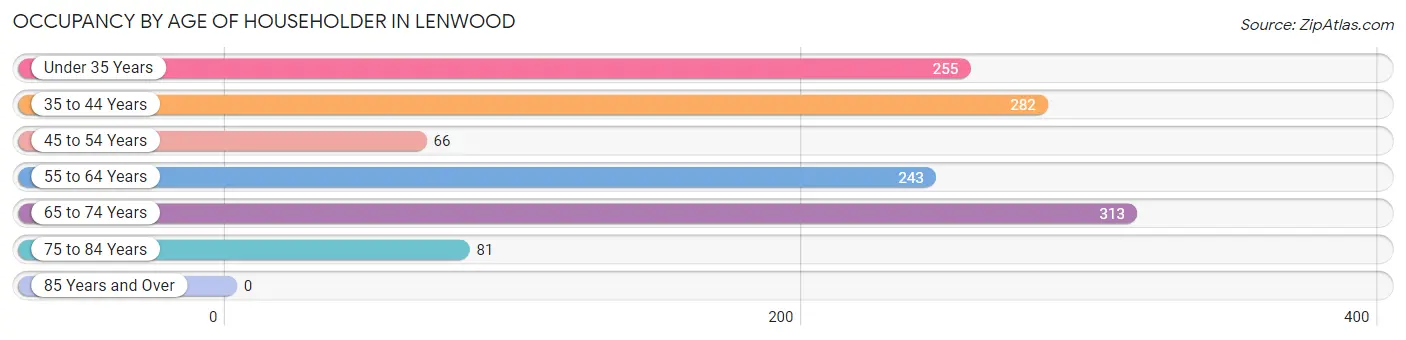
| Age Bracket | # Households | % Households |
| Under 35 Years | 255 | 20.6% |
| 35 to 44 Years | 282 | 22.7% |
| 45 to 54 Years | 66 | 5.3% |
| 55 to 64 Years | 243 | 19.6% |
| 65 to 74 Years | 313 | 25.2% |
| 75 to 84 Years | 81 | 6.5% |
| 85 Years and Over | 0 | 0.0% |
| Total | 1,240 | 100.0% |
Housing Finances in Lenwood
Median Income by Occupancy in Lenwood
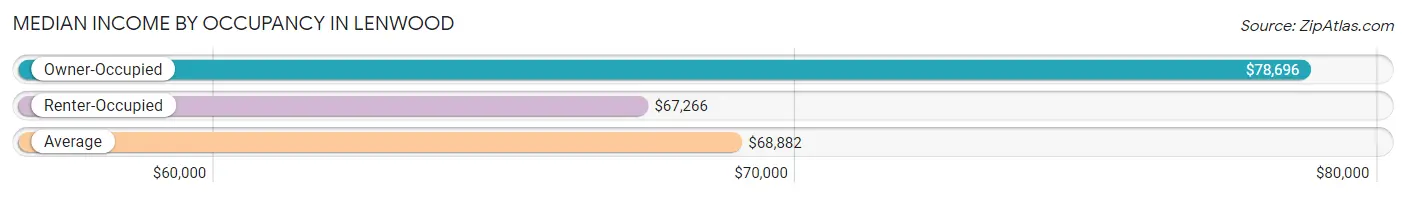
| Occupancy Type | # Households | Median Income |
| Owner-Occupied | 637 (51.4%) | $78,696 |
| Renter-Occupied | 603 (48.6%) | $67,266 |
| Average | 1,240 (100.0%) | $68,882 |
Occupancy by Householder Income Bracket in Lenwood
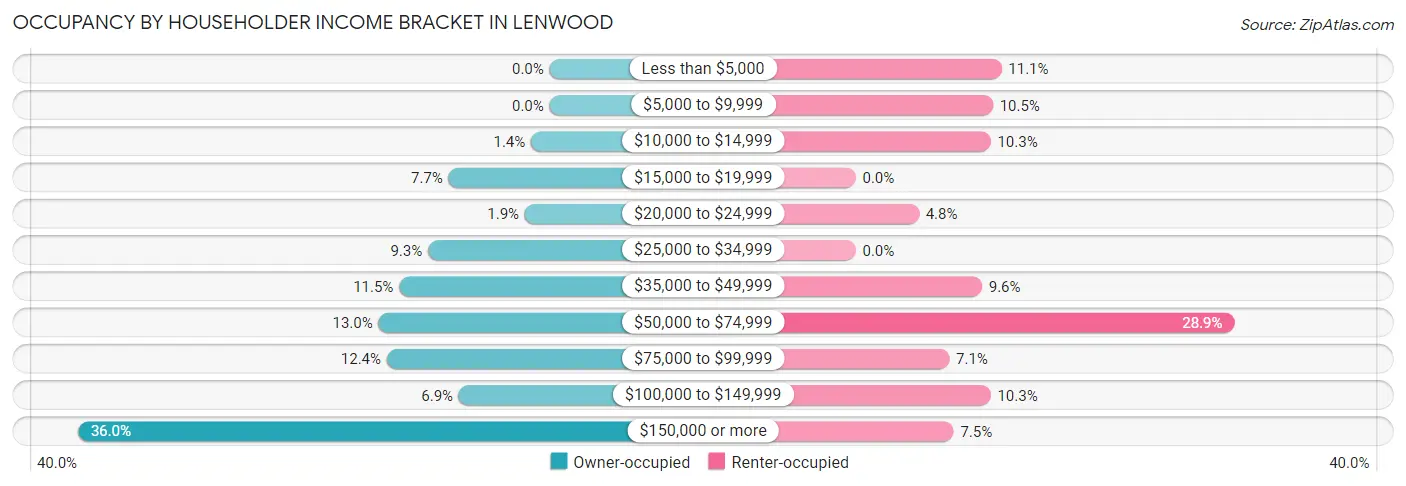
| Income Bracket | Owner-occupied | Renter-occupied |
| Less than $5,000 | 0 (0.0%) | 67 (11.1%) |
| $5,000 to $9,999 | 0 (0.0%) | 63 (10.4%) |
| $10,000 to $14,999 | 9 (1.4%) | 62 (10.3%) |
| $15,000 to $19,999 | 49 (7.7%) | 0 (0.0%) |
| $20,000 to $24,999 | 12 (1.9%) | 29 (4.8%) |
| $25,000 to $34,999 | 59 (9.3%) | 0 (0.0%) |
| $35,000 to $49,999 | 73 (11.5%) | 58 (9.6%) |
| $50,000 to $74,999 | 83 (13.0%) | 174 (28.9%) |
| $75,000 to $99,999 | 79 (12.4%) | 43 (7.1%) |
| $100,000 to $149,999 | 44 (6.9%) | 62 (10.3%) |
| $150,000 or more | 229 (35.9%) | 45 (7.5%) |
| Total | 637 (100.0%) | 603 (100.0%) |
Monthly Housing Cost Tiers in Lenwood
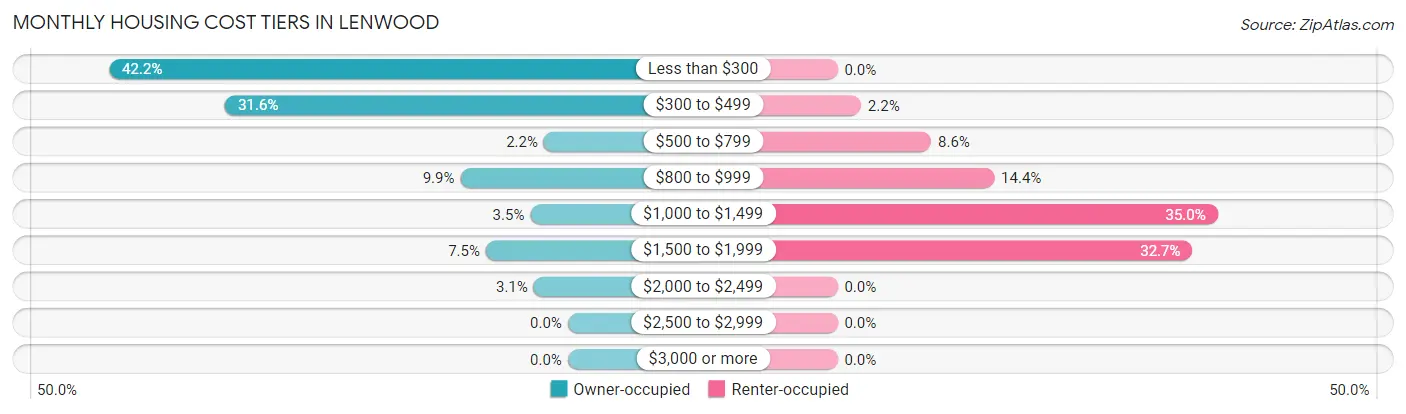
| Monthly Cost | Owner-occupied | Renter-occupied |
| Less than $300 | 269 (42.2%) | 0 (0.0%) |
| $300 to $499 | 201 (31.6%) | 13 (2.2%) |
| $500 to $799 | 14 (2.2%) | 52 (8.6%) |
| $800 to $999 | 63 (9.9%) | 87 (14.4%) |
| $1,000 to $1,499 | 22 (3.5%) | 211 (35.0%) |
| $1,500 to $1,999 | 48 (7.5%) | 197 (32.7%) |
| $2,000 to $2,499 | 20 (3.1%) | 0 (0.0%) |
| $2,500 to $2,999 | 0 (0.0%) | 0 (0.0%) |
| $3,000 or more | 0 (0.0%) | 0 (0.0%) |
| Total | 637 (100.0%) | 603 (100.0%) |
Physical Housing Characteristics in Lenwood
Housing Structures in Lenwood
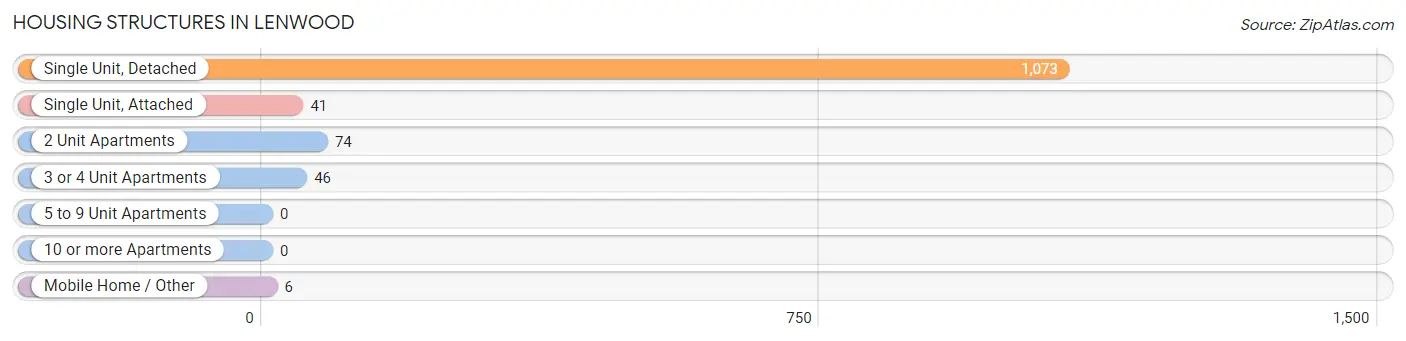
| Structure Type | # Housing Units | % Housing Units |
| Single Unit, Detached | 1,073 | 86.5% |
| Single Unit, Attached | 41 | 3.3% |
| 2 Unit Apartments | 74 | 6.0% |
| 3 or 4 Unit Apartments | 46 | 3.7% |
| 5 to 9 Unit Apartments | 0 | 0.0% |
| 10 or more Apartments | 0 | 0.0% |
| Mobile Home / Other | 6 | 0.5% |
| Total | 1,240 | 100.0% |
Housing Structures by Occupancy in Lenwood
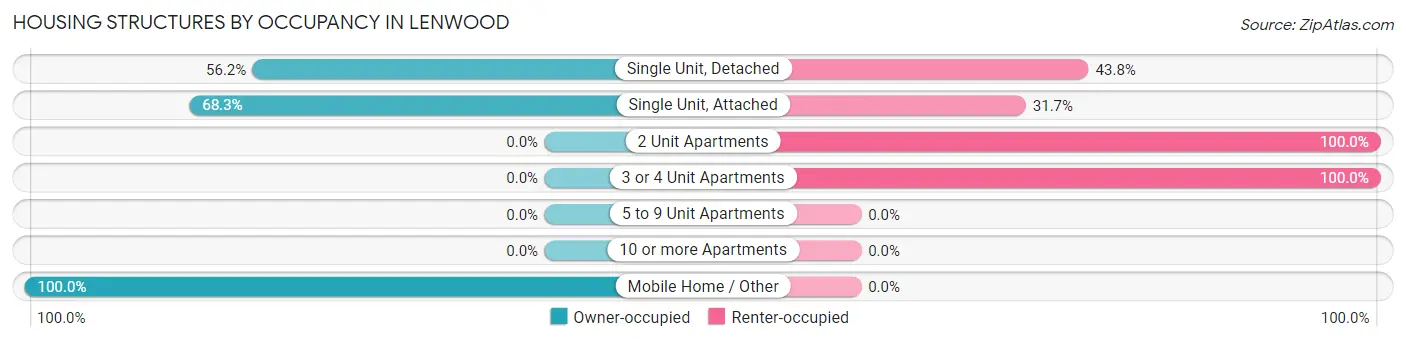
| Structure Type | Owner-occupied | Renter-occupied |
| Single Unit, Detached | 603 (56.2%) | 470 (43.8%) |
| Single Unit, Attached | 28 (68.3%) | 13 (31.7%) |
| 2 Unit Apartments | 0 (0.0%) | 74 (100.0%) |
| 3 or 4 Unit Apartments | 0 (0.0%) | 46 (100.0%) |
| 5 to 9 Unit Apartments | 0 (0.0%) | 0 (0.0%) |
| 10 or more Apartments | 0 (0.0%) | 0 (0.0%) |
| Mobile Home / Other | 6 (100.0%) | 0 (0.0%) |
| Total | 637 (51.4%) | 603 (48.6%) |
Housing Structures by Number of Rooms in Lenwood
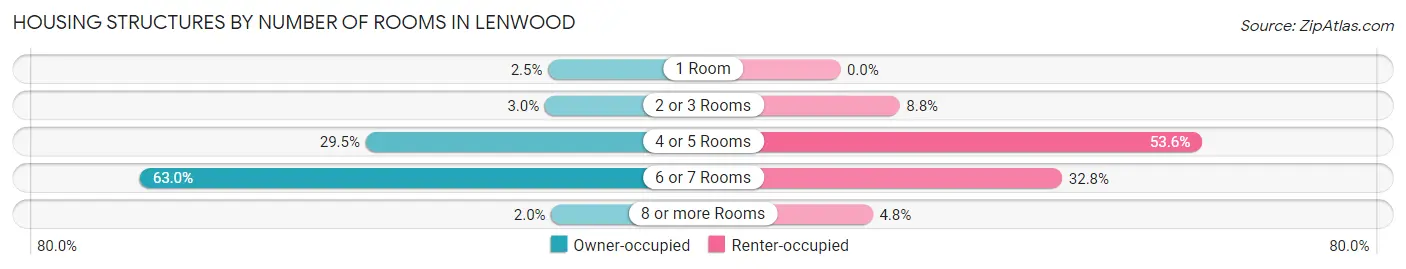
| Number of Rooms | Owner-occupied | Renter-occupied |
| 1 Room | 16 (2.5%) | 0 (0.0%) |
| 2 or 3 Rooms | 19 (3.0%) | 53 (8.8%) |
| 4 or 5 Rooms | 188 (29.5%) | 323 (53.6%) |
| 6 or 7 Rooms | 401 (62.9%) | 198 (32.8%) |
| 8 or more Rooms | 13 (2.0%) | 29 (4.8%) |
| Total | 637 (100.0%) | 603 (100.0%) |
Housing Structure by Heating Type in Lenwood
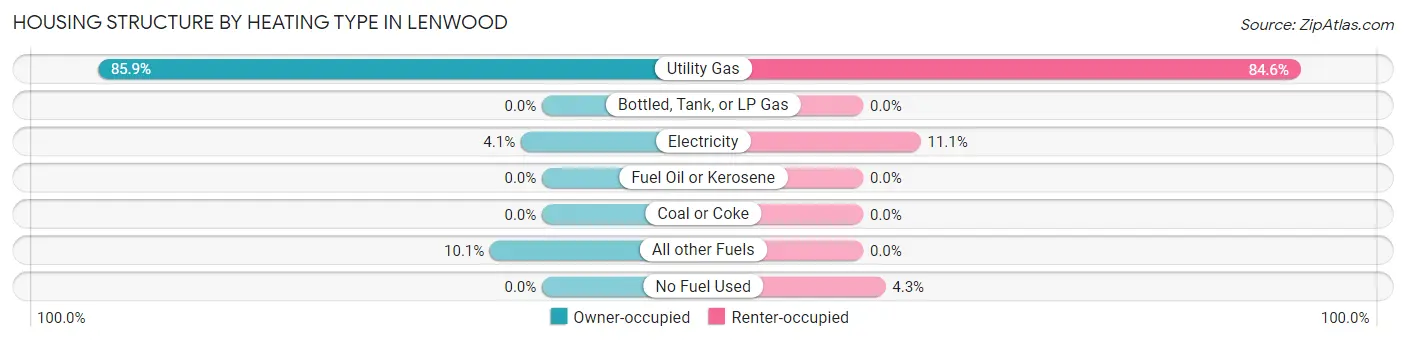
| Heating Type | Owner-occupied | Renter-occupied |
| Utility Gas | 547 (85.9%) | 510 (84.6%) |
| Bottled, Tank, or LP Gas | 0 (0.0%) | 0 (0.0%) |
| Electricity | 26 (4.1%) | 67 (11.1%) |
| Fuel Oil or Kerosene | 0 (0.0%) | 0 (0.0%) |
| Coal or Coke | 0 (0.0%) | 0 (0.0%) |
| All other Fuels | 64 (10.1%) | 0 (0.0%) |
| No Fuel Used | 0 (0.0%) | 26 (4.3%) |
| Total | 637 (100.0%) | 603 (100.0%) |
Household Vehicle Usage in Lenwood
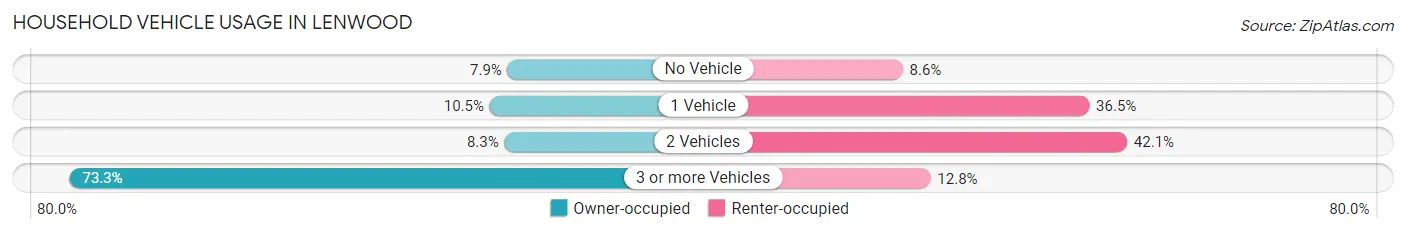
| Vehicles per Household | Owner-occupied | Renter-occupied |
| No Vehicle | 50 (7.9%) | 52 (8.6%) |
| 1 Vehicle | 67 (10.5%) | 220 (36.5%) |
| 2 Vehicles | 53 (8.3%) | 254 (42.1%) |
| 3 or more Vehicles | 467 (73.3%) | 77 (12.8%) |
| Total | 637 (100.0%) | 603 (100.0%) |
Real Estate & Mortgages in Lenwood
Real Estate and Mortgage Overview in Lenwood
| Characteristic | Without Mortgage | With Mortgage |
| Housing Units | 484 | 153 |
| Median Property Value | $89,200 | $123,800 |
| Median Household Income | - | - |
| Monthly Housing Costs | $295 | $0 |
| Real Estate Taxes | $1,108 | $0 |
Property Value by Mortgage Status in Lenwood
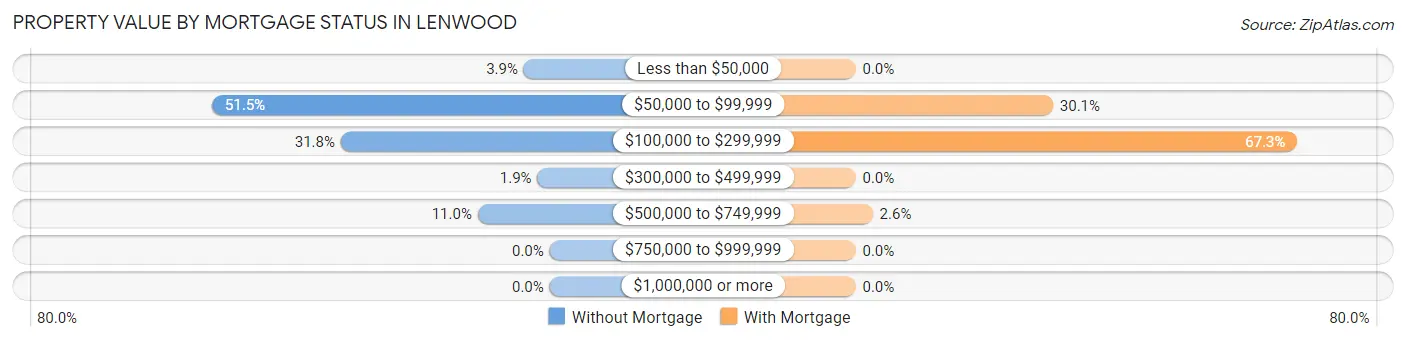
| Property Value | Without Mortgage | With Mortgage |
| Less than $50,000 | 19 (3.9%) | 0 (0.0%) |
| $50,000 to $99,999 | 249 (51.4%) | 46 (30.1%) |
| $100,000 to $299,999 | 154 (31.8%) | 103 (67.3%) |
| $300,000 to $499,999 | 9 (1.9%) | 0 (0.0%) |
| $500,000 to $749,999 | 53 (11.0%) | 4 (2.6%) |
| $750,000 to $999,999 | 0 (0.0%) | 0 (0.0%) |
| $1,000,000 or more | 0 (0.0%) | 0 (0.0%) |
| Total | 484 (100.0%) | 153 (100.0%) |
Household Income by Mortgage Status in Lenwood
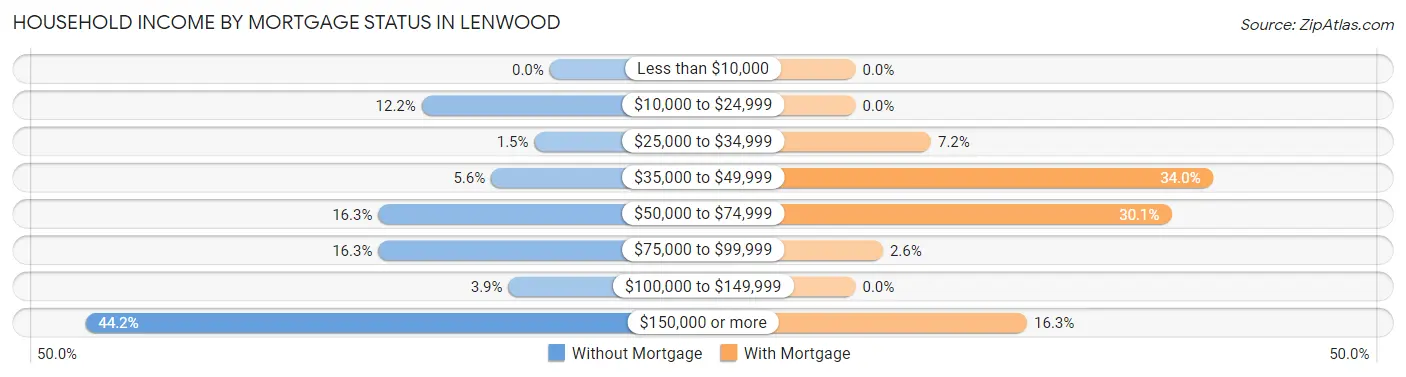
| Household Income | Without Mortgage | With Mortgage |
| Less than $10,000 | 0 (0.0%) | 0 (0.0%) |
| $10,000 to $24,999 | 59 (12.2%) | 0 (0.0%) |
| $25,000 to $34,999 | 7 (1.5%) | 11 (7.2%) |
| $35,000 to $49,999 | 27 (5.6%) | 52 (34.0%) |
| $50,000 to $74,999 | 79 (16.3%) | 46 (30.1%) |
| $75,000 to $99,999 | 79 (16.3%) | 4 (2.6%) |
| $100,000 to $149,999 | 19 (3.9%) | 0 (0.0%) |
| $150,000 or more | 214 (44.2%) | 25 (16.3%) |
| Total | 484 (100.0%) | 153 (100.0%) |
Property Value to Household Income Ratio in Lenwood
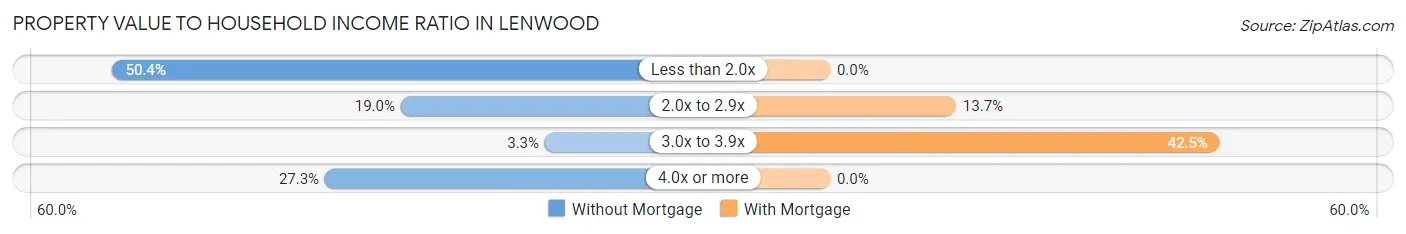
| Value-to-Income Ratio | Without Mortgage | With Mortgage |
| Less than 2.0x | 244 (50.4%) | 0 (0.0%) |
| 2.0x to 2.9x | 92 (19.0%) | 21 (13.7%) |
| 3.0x to 3.9x | 16 (3.3%) | 65 (42.5%) |
| 4.0x or more | 132 (27.3%) | 0 (0.0%) |
| Total | 484 (100.0%) | 153 (100.0%) |
Real Estate Taxes by Mortgage Status in Lenwood
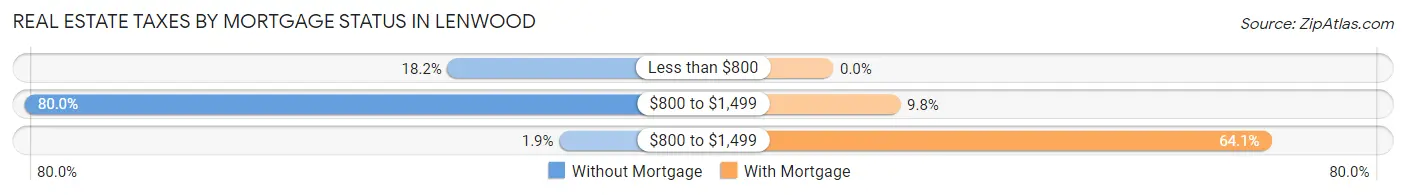
| Property Taxes | Without Mortgage | With Mortgage |
| Less than $800 | 88 (18.2%) | 0 (0.0%) |
| $800 to $1,499 | 387 (80.0%) | 15 (9.8%) |
| $800 to $1,499 | 9 (1.9%) | 98 (64.0%) |
| Total | 484 (100.0%) | 153 (100.0%) |
Health & Disability in Lenwood
Health Insurance Coverage by Age in Lenwood
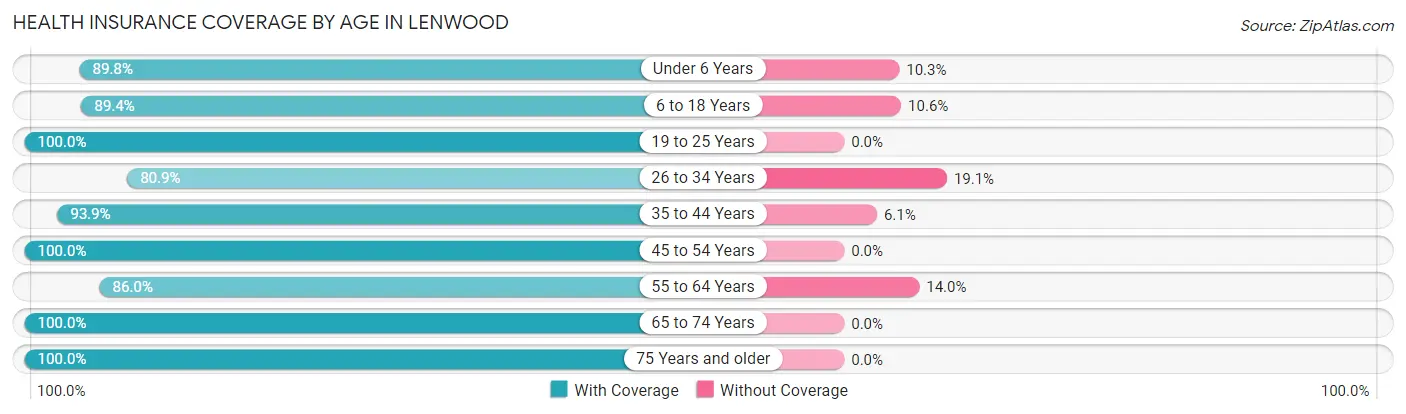
| Age Bracket | With Coverage | Without Coverage |
| Under 6 Years | 578 (89.7%) | 66 (10.2%) |
| 6 to 18 Years | 675 (89.4%) | 80 (10.6%) |
| 19 to 25 Years | 307 (100.0%) | 0 (0.0%) |
| 26 to 34 Years | 583 (80.9%) | 138 (19.1%) |
| 35 to 44 Years | 354 (93.9%) | 23 (6.1%) |
| 45 to 54 Years | 150 (100.0%) | 0 (0.0%) |
| 55 to 64 Years | 326 (86.0%) | 53 (14.0%) |
| 65 to 74 Years | 533 (100.0%) | 0 (0.0%) |
| 75 Years and older | 111 (100.0%) | 0 (0.0%) |
| Total | 3,617 (90.9%) | 360 (9.0%) |
Health Insurance Coverage by Citizenship Status in Lenwood
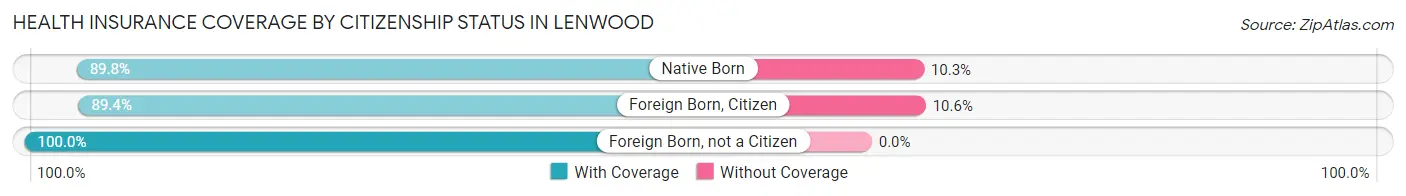
| Citizenship Status | With Coverage | Without Coverage |
| Native Born | 578 (89.7%) | 66 (10.2%) |
| Foreign Born, Citizen | 675 (89.4%) | 80 (10.6%) |
| Foreign Born, not a Citizen | 307 (100.0%) | 0 (0.0%) |
Health Insurance Coverage by Household Income in Lenwood
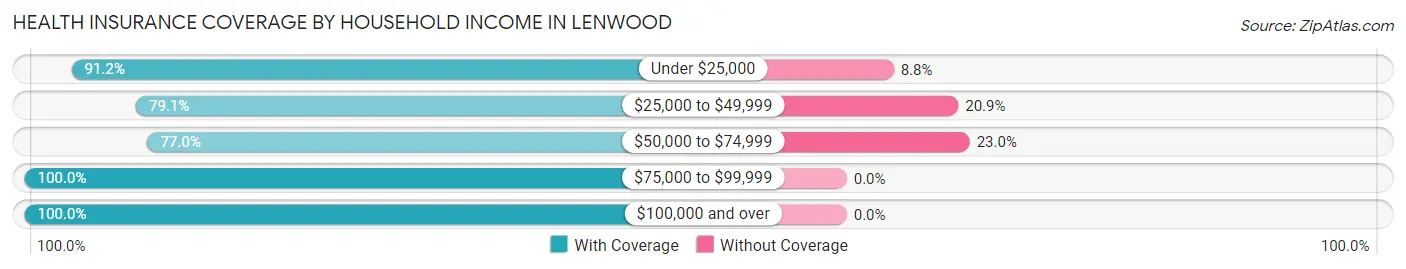
| Household Income | With Coverage | Without Coverage |
| Under $25,000 | 654 (91.2%) | 63 (8.8%) |
| $25,000 to $49,999 | 462 (79.1%) | 122 (20.9%) |
| $50,000 to $74,999 | 585 (77.0%) | 175 (23.0%) |
| $75,000 to $99,999 | 442 (100.0%) | 0 (0.0%) |
| $100,000 and over | 1,474 (100.0%) | 0 (0.0%) |
Public vs Private Health Insurance Coverage by Age in Lenwood
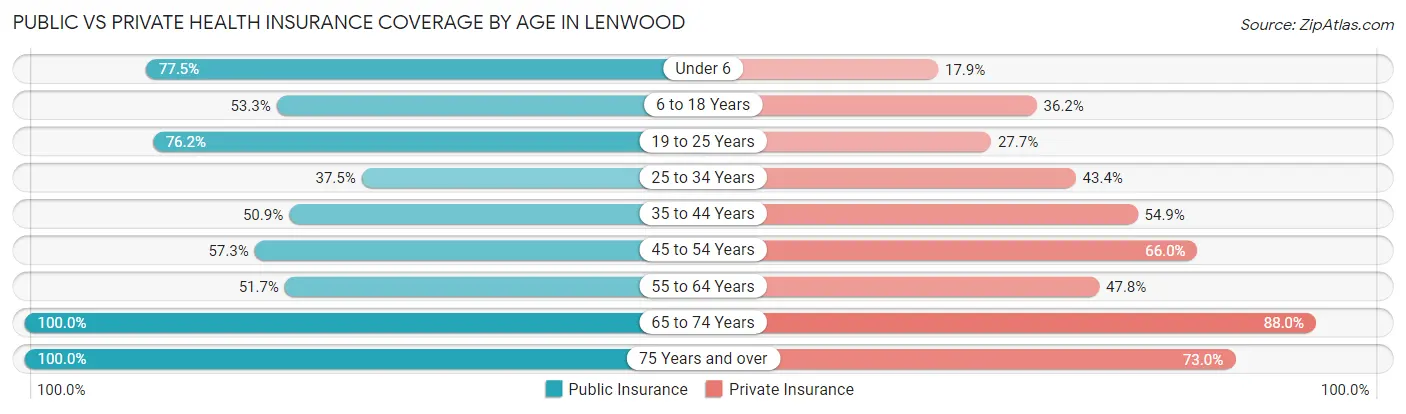
| Age Bracket | Public Insurance | Private Insurance |
| Under 6 | 499 (77.5%) | 115 (17.9%) |
| 6 to 18 Years | 402 (53.2%) | 273 (36.2%) |
| 19 to 25 Years | 234 (76.2%) | 85 (27.7%) |
| 25 to 34 Years | 270 (37.4%) | 313 (43.4%) |
| 35 to 44 Years | 192 (50.9%) | 207 (54.9%) |
| 45 to 54 Years | 86 (57.3%) | 99 (66.0%) |
| 55 to 64 Years | 196 (51.7%) | 181 (47.8%) |
| 65 to 74 Years | 533 (100.0%) | 469 (88.0%) |
| 75 Years and over | 111 (100.0%) | 81 (73.0%) |
| Total | 2,523 (63.4%) | 1,823 (45.8%) |
Disability Status by Sex by Age in Lenwood
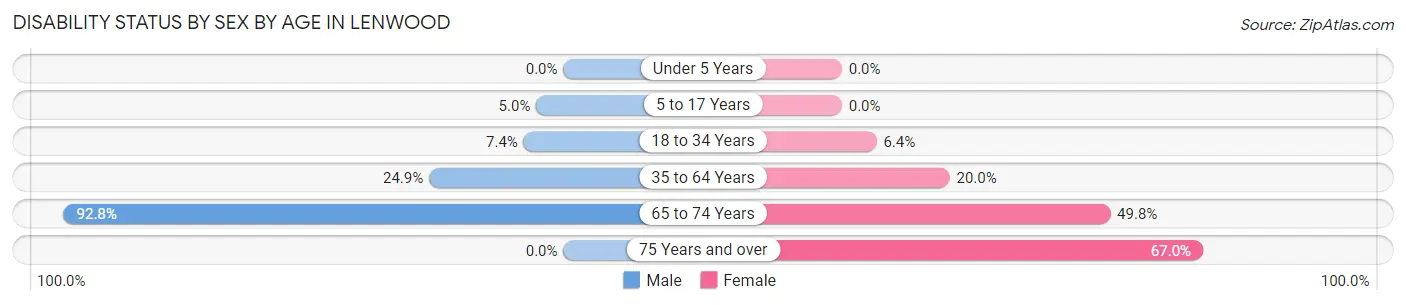
| Age Bracket | Male | Female |
| Under 5 Years | 0 (0.0%) | 0 (0.0%) |
| 5 to 17 Years | 31 (5.0%) | 0 (0.0%) |
| 18 to 34 Years | 38 (7.4%) | 34 (6.4%) |
| 35 to 64 Years | 90 (24.9%) | 109 (20.0%) |
| 65 to 74 Years | 256 (92.7%) | 128 (49.8%) |
| 75 Years and over | 0 (0.0%) | 63 (67.0%) |
Disability Class by Sex by Age in Lenwood
Disability Class: Hearing Difficulty
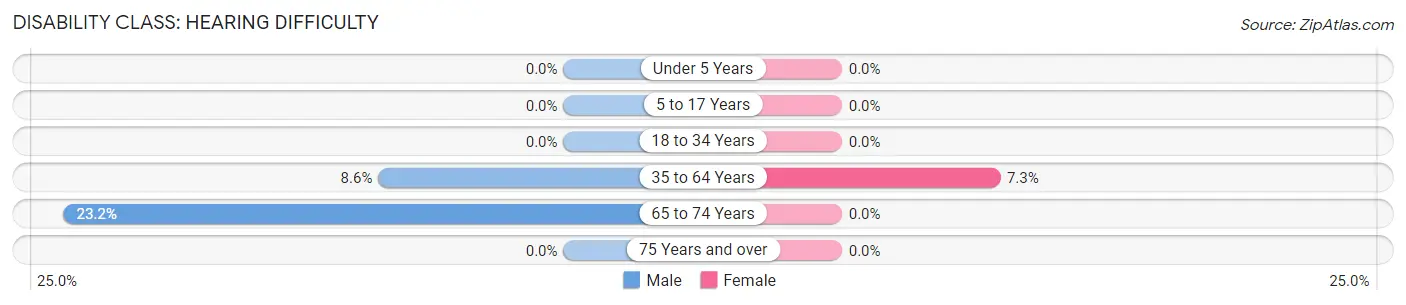
| Age Bracket | Male | Female |
| Under 5 Years | 0 (0.0%) | 0 (0.0%) |
| 5 to 17 Years | 0 (0.0%) | 0 (0.0%) |
| 18 to 34 Years | 0 (0.0%) | 0 (0.0%) |
| 35 to 64 Years | 31 (8.6%) | 40 (7.3%) |
| 65 to 74 Years | 64 (23.2%) | 0 (0.0%) |
| 75 Years and over | 0 (0.0%) | 0 (0.0%) |
Disability Class: Vision Difficulty
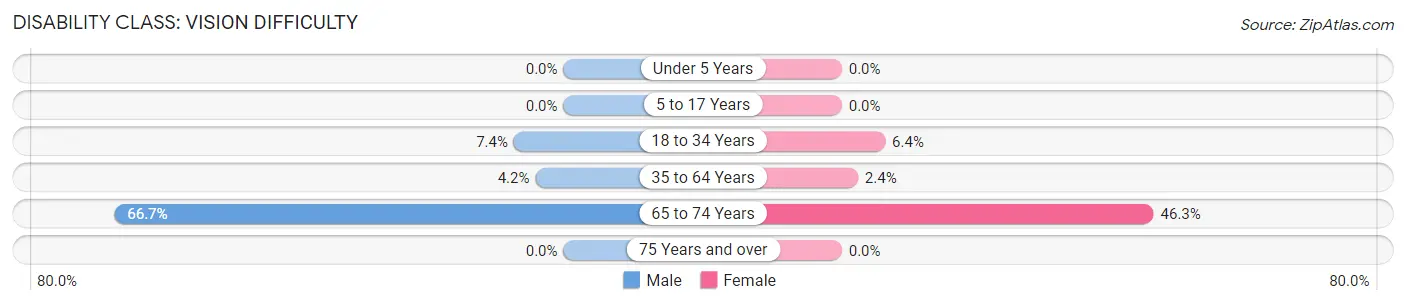
| Age Bracket | Male | Female |
| Under 5 Years | 0 (0.0%) | 0 (0.0%) |
| 5 to 17 Years | 0 (0.0%) | 0 (0.0%) |
| 18 to 34 Years | 38 (7.4%) | 34 (6.4%) |
| 35 to 64 Years | 15 (4.2%) | 13 (2.4%) |
| 65 to 74 Years | 184 (66.7%) | 119 (46.3%) |
| 75 Years and over | 0 (0.0%) | 0 (0.0%) |
Disability Class: Cognitive Difficulty
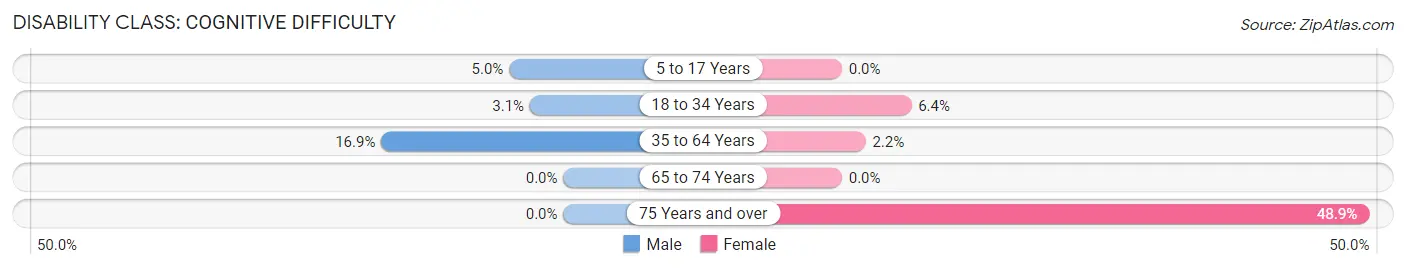
| Age Bracket | Male | Female |
| 5 to 17 Years | 31 (5.0%) | 0 (0.0%) |
| 18 to 34 Years | 16 (3.1%) | 34 (6.4%) |
| 35 to 64 Years | 61 (16.9%) | 12 (2.2%) |
| 65 to 74 Years | 0 (0.0%) | 0 (0.0%) |
| 75 Years and over | 0 (0.0%) | 46 (48.9%) |
Disability Class: Ambulatory Difficulty
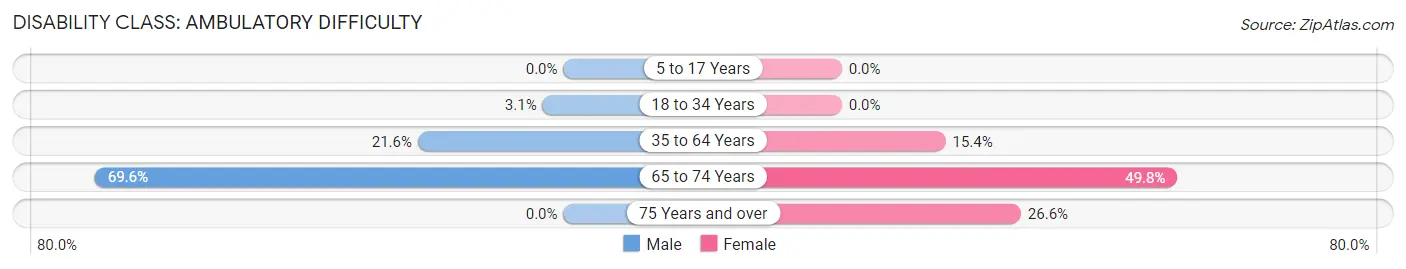
| Age Bracket | Male | Female |
| 5 to 17 Years | 0 (0.0%) | 0 (0.0%) |
| 18 to 34 Years | 16 (3.1%) | 0 (0.0%) |
| 35 to 64 Years | 78 (21.6%) | 84 (15.4%) |
| 65 to 74 Years | 192 (69.6%) | 128 (49.8%) |
| 75 Years and over | 0 (0.0%) | 25 (26.6%) |
Disability Class: Self-Care Difficulty
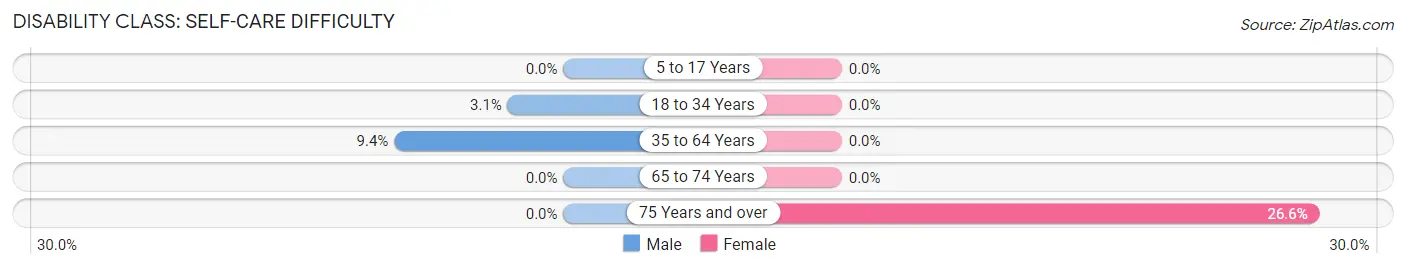
| Age Bracket | Male | Female |
| 5 to 17 Years | 0 (0.0%) | 0 (0.0%) |
| 18 to 34 Years | 16 (3.1%) | 0 (0.0%) |
| 35 to 64 Years | 34 (9.4%) | 0 (0.0%) |
| 65 to 74 Years | 0 (0.0%) | 0 (0.0%) |
| 75 Years and over | 0 (0.0%) | 25 (26.6%) |
Technology Access in Lenwood
Computing Device Access in Lenwood
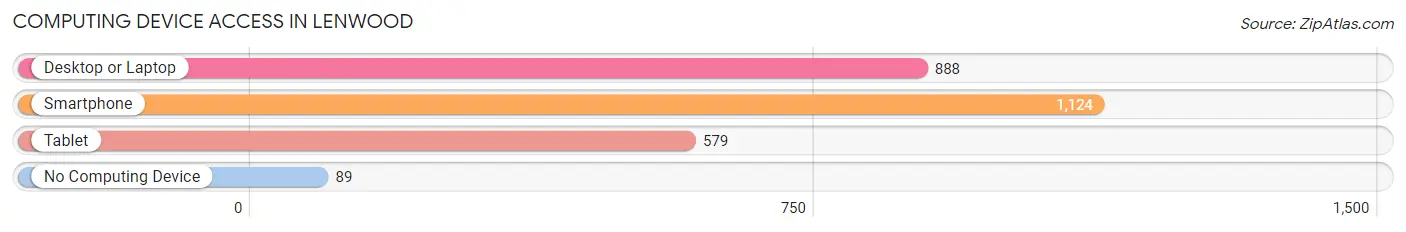
| Device Type | # Households | % Households |
| Desktop or Laptop | 888 | 71.6% |
| Smartphone | 1,124 | 90.6% |
| Tablet | 579 | 46.7% |
| No Computing Device | 89 | 7.2% |
| Total | 1,240 | 100.0% |
Internet Access in Lenwood
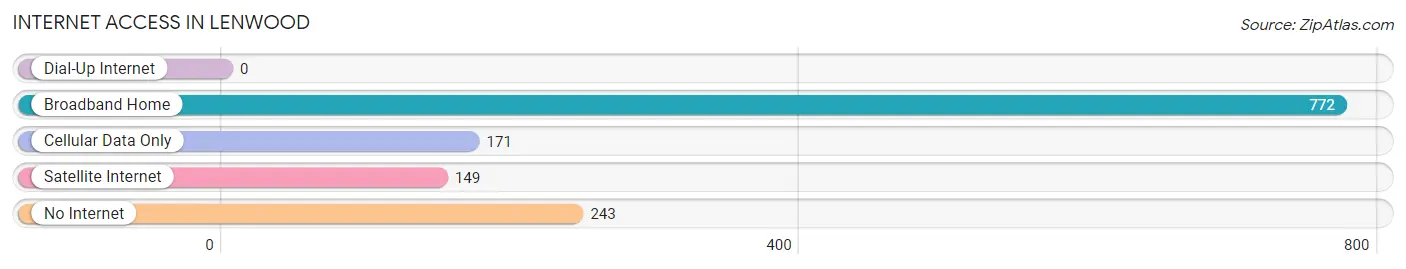
| Internet Type | # Households | % Households |
| Dial-Up Internet | 0 | 0.0% |
| Broadband Home | 772 | 62.3% |
| Cellular Data Only | 171 | 13.8% |
| Satellite Internet | 149 | 12.0% |
| No Internet | 243 | 19.6% |
| Total | 1,240 | 100.0% |
Lenwood Summary
Lenwood is a small unincorporated community located in the Mojave Desert of San Bernardino County, California. It is situated along the I-15 freeway, approximately 10 miles north of Barstow and 40 miles south of Las Vegas, Nevada. The population of Lenwood was estimated to be 1,845 in 2019.
History
Lenwood was founded in the late 1800s as a small farming community. The area was originally inhabited by the Serrano Indians, who were later displaced by the Spanish and Mexican settlers. The first settlers in the area were the Lenwood family, who established a homestead in the area in 1876. The Lenwood family was instrumental in the development of the community, and the town was named after them.
In the early 1900s, Lenwood began to grow as a small farming community. The area was known for its production of alfalfa, cotton, and other crops. The town also had a small dairy industry, and several stores and businesses were established.
In the 1950s, Lenwood began to experience a population boom as people moved to the area to take advantage of the growing economy. The town was also home to a large military base, which provided jobs and economic stability to the area.
Geography
Lenwood is located in the Mojave Desert of San Bernardino County, California. It is situated along the I-15 freeway, approximately 10 miles north of Barstow and 40 miles south of Las Vegas, Nevada. The town is surrounded by the Lenwood Hills, which are part of the San Bernardino Mountains. The area is characterized by its dry climate and sparse vegetation.
Economy
Lenwood’s economy is largely based on agriculture and tourism. The town is home to several farms and ranches, which produce alfalfa, cotton, and other crops. The area is also known for its production of wine and other agricultural products.
Lenwood is also a popular tourist destination, as it is located close to several attractions, such as the Mojave National Preserve and the Calico Ghost Town. The town is also home to several casinos, which attract visitors from all over the world.
Demographics
As of 2019, the population of Lenwood was estimated to be 1,845. The population is largely composed of White (77.3%), Hispanic or Latino (14.2%), and African American (3.2%) individuals. The median household income in Lenwood is $45,945, and the median age is 37.7 years. The town has a poverty rate of 16.2%, which is higher than the national average.
Common Questions
What is Per Capita Income in Lenwood?
Per Capita income in Lenwood is $22,620.
What is the Median Family Income in Lenwood?
Median Family Income in Lenwood is $77,661.
What is the Median Household income in Lenwood?
Median Household Income in Lenwood is $68,882.
What is Income or Wage Gap in Lenwood?
Income or Wage Gap in Lenwood is 61.5%.
Women in Lenwood earn 38.5 cents for every dollar earned by a man.
What is Inequality or Gini Index in Lenwood?
Inequality or Gini Index in Lenwood is 0.41.
What is the Total Population of Lenwood?
Total Population of Lenwood is 4,016.
What is the Total Male Population of Lenwood?
Total Male Population of Lenwood is 2,163.
What is the Total Female Population of Lenwood?
Total Female Population of Lenwood is 1,853.
What is the Ratio of Males per 100 Females in Lenwood?
There are 116.73 Males per 100 Females in Lenwood.
What is the Ratio of Females per 100 Males in Lenwood?
There are 85.67 Females per 100 Males in Lenwood.
What is the Median Population Age in Lenwood?
Median Population Age in Lenwood is 30.5 Years.
What is the Average Family Size in Lenwood
Average Family Size in Lenwood is 3.7 People.
What is the Average Household Size in Lenwood
Average Household Size in Lenwood is 3.2 People.
How Large is the Labor Force in Lenwood?
There are 1,560 People in the Labor Forcein in Lenwood.
What is the Percentage of People in the Labor Force in Lenwood?
55.8% of People are in the Labor Force in Lenwood.
What is the Unemployment Rate in Lenwood?
Unemployment Rate in Lenwood is 6.7%.