Cities with the Highest Percentage of Households With Three or more Vehicles in Virginia
RELATED REPORTS & OPTIONS
Households with 3 or more Cars
Virginia
Compare Cities
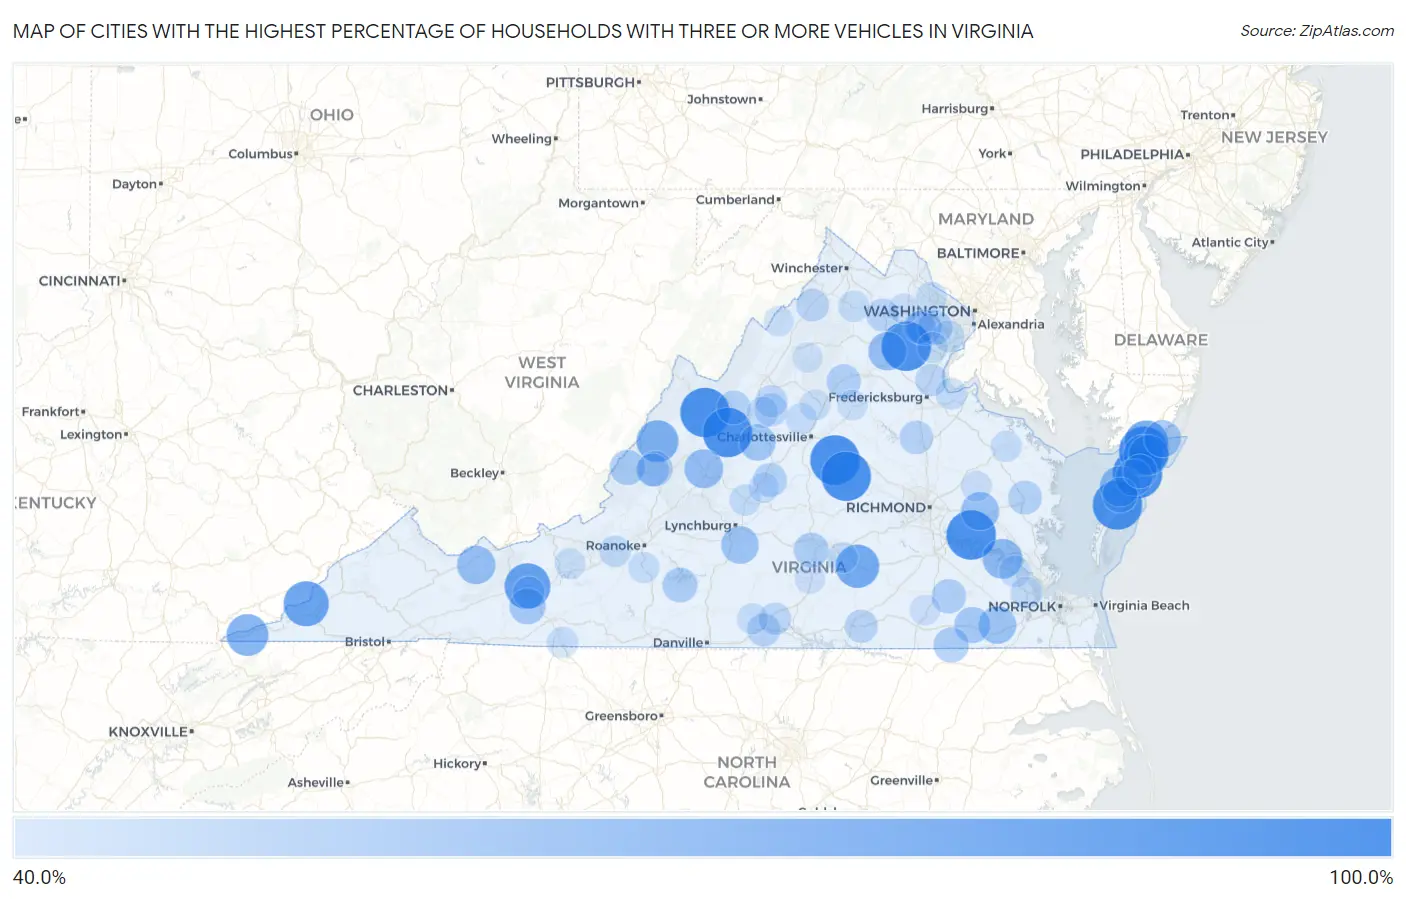
Map of Cities with the Highest Percentage of Households With Three or more Vehicles in Virginia
0.0%
100.0%
Cities with the Highest Percentage of Households With Three or more Vehicles in Virginia
| City | Housholds With 3+ Cars | vs State | vs National | |
| 1. | Deerfield | 100.0% | 33.6%(+66.4)#1 | 29.0%(+71.0)#33 |
| 2. | Metompkin | 100.0% | 33.6%(+66.4)#2 | 29.0%(+71.0)#60 |
| 3. | Catlett | 100.0% | 33.6%(+66.4)#3 | 29.0%(+71.0)#88 |
| 4. | Cats Bridge | 100.0% | 33.6%(+66.4)#4 | 29.0%(+71.0)#100 |
| 5. | Palmyra | 100.0% | 33.6%(+66.4)#5 | 29.0%(+71.0)#127 |
| 6. | Millboro | 100.0% | 33.6%(+66.4)#6 | 29.0%(+71.0)#128 |
| 7. | Paris | 100.0% | 33.6%(+66.4)#7 | 29.0%(+71.0)#214 |
| 8. | Middlebrook | 100.0% | 33.6%(+66.4)#8 | 29.0%(+71.0)#241 |
| 9. | Oak Hall | 100.0% | 33.6%(+66.4)#9 | 29.0%(+71.0)#242 |
| 10. | Columbia | 100.0% | 33.6%(+66.4)#10 | 29.0%(+71.0)#252 |
| 11. | Charles City | 100.0% | 33.6%(+66.4)#11 | 29.0%(+71.0)#276 |
| 12. | Port Republic | 90.9% | 33.6%(+57.3)#12 | 29.0%(+61.9)#412 |
| 13. | Max Meadows | 89.8% | 33.6%(+56.2)#13 | 29.0%(+60.8)#422 |
| 14. | Keokee | 88.2% | 33.6%(+54.6)#14 | 29.0%(+59.2)#436 |
| 15. | New Church | 84.7% | 33.6%(+51.1)#15 | 29.0%(+55.7)#494 |
| 16. | Nottoway Court House | 83.3% | 33.6%(+49.7)#16 | 29.0%(+54.3)#514 |
| 17. | Hot Springs | 79.4% | 33.6%(+45.8)#17 | 29.0%(+50.4)#600 |
| 18. | Ewing | 79.0% | 33.6%(+45.4)#18 | 29.0%(+50.0)#611 |
| 19. | Temperanceville | 76.4% | 33.6%(+42.8)#19 | 29.0%(+47.4)#686 |
| 20. | Savageville | 75.2% | 33.6%(+41.6)#20 | 29.0%(+46.2)#722 |
| 21. | Atlantic | 74.8% | 33.6%(+41.2)#21 | 29.0%(+45.8)#756 |
| 22. | Scotland | 73.5% | 33.6%(+39.9)#22 | 29.0%(+44.5)#790 |
| 23. | Ripplemead | 73.4% | 33.6%(+39.8)#23 | 29.0%(+44.4)#793 |
| 24. | Waterford | 73.0% | 33.6%(+39.4)#24 | 29.0%(+44.0)#802 |
| 25. | East Lexington | 71.1% | 33.6%(+37.5)#25 | 29.0%(+42.1)#856 |
| 26. | Gratton | 70.2% | 33.6%(+36.6)#26 | 29.0%(+41.2)#884 |
| 27. | Opal | 70.2% | 33.6%(+36.6)#27 | 29.0%(+41.2)#885 |
| 28. | New Kent | 69.2% | 33.6%(+35.6)#28 | 29.0%(+40.2)#923 |
| 29. | Rustburg | 67.7% | 33.6%(+34.1)#29 | 29.0%(+38.7)#1,002 |
| 30. | Carrsville | 67.7% | 33.6%(+34.1)#30 | 29.0%(+38.7)#1,004 |
| 31. | East Stone Gap | 67.1% | 33.6%(+33.5)#31 | 29.0%(+38.1)#1,036 |
| 32. | Greenbackville | 66.7% | 33.6%(+33.1)#32 | 29.0%(+37.7)#1,082 |
| 33. | Pastoria | 65.8% | 33.6%(+32.2)#33 | 29.0%(+36.8)#1,135 |
| 34. | Stickleyville | 65.5% | 33.6%(+31.9)#34 | 29.0%(+36.5)#1,148 |
| 35. | Sherando | 64.6% | 33.6%(+31.0)#35 | 29.0%(+35.6)#1,214 |
| 36. | Ivanhoe | 64.0% | 33.6%(+30.4)#36 | 29.0%(+35.0)#1,248 |
| 37. | Courtland | 63.8% | 33.6%(+30.2)#37 | 29.0%(+34.8)#1,262 |
| 38. | Loch Lomond | 62.2% | 33.6%(+28.6)#38 | 29.0%(+33.2)#1,388 |
| 39. | Selma | 61.9% | 33.6%(+28.3)#39 | 29.0%(+32.9)#1,422 |
| 40. | Branchville | 61.5% | 33.6%(+27.9)#40 | 29.0%(+32.5)#1,461 |
| 41. | Keller | 61.3% | 33.6%(+27.7)#41 | 29.0%(+32.3)#1,483 |
| 42. | Callaghan | 61.2% | 33.6%(+27.6)#42 | 29.0%(+32.2)#1,491 |
| 43. | Penhook | 60.5% | 33.6%(+26.9)#43 | 29.0%(+31.5)#1,564 |
| 44. | Breaks | 60.5% | 33.6%(+26.9)#44 | 29.0%(+31.5)#1,569 |
| 45. | Hampden Sydney | 60.4% | 33.6%(+26.8)#45 | 29.0%(+31.4)#1,574 |
| 46. | Clifton | 60.0% | 33.6%(+26.4)#46 | 29.0%(+31.0)#1,609 |
| 47. | Eggleston | 60.0% | 33.6%(+26.4)#47 | 29.0%(+31.0)#1,628 |
| 48. | Sussex | 59.7% | 33.6%(+26.1)#48 | 29.0%(+30.7)#1,676 |
| 49. | Disputanta | 59.2% | 33.6%(+25.6)#49 | 29.0%(+30.2)#1,730 |
| 50. | Brightwood | 58.4% | 33.6%(+24.8)#50 | 29.0%(+29.4)#1,821 |
| 51. | Shipman | 58.3% | 33.6%(+24.7)#51 | 29.0%(+29.3)#1,836 |
| 52. | Churchville | 58.1% | 33.6%(+24.5)#52 | 29.0%(+29.1)#1,876 |
| 53. | Saluda | 58.0% | 33.6%(+24.4)#53 | 29.0%(+29.0)#1,877 |
| 54. | Gargatha | 58.0% | 33.6%(+24.4)#54 | 29.0%(+29.0)#1,878 |
| 55. | Lake Land Or | 57.4% | 33.6%(+23.8)#55 | 29.0%(+28.4)#1,940 |
| 56. | Aldie | 56.3% | 33.6%(+22.7)#56 | 29.0%(+27.3)#2,093 |
| 57. | Riverdale | 56.2% | 33.6%(+22.6)#57 | 29.0%(+27.2)#2,109 |
| 58. | Low Moor | 56.0% | 33.6%(+22.4)#58 | 29.0%(+27.0)#2,147 |
| 59. | Brodnax | 56.0% | 33.6%(+22.4)#59 | 29.0%(+27.0)#2,149 |
| 60. | Harriston | 55.7% | 33.6%(+22.1)#60 | 29.0%(+26.7)#2,188 |
| 61. | Meadowview | 55.6% | 33.6%(+22.0)#61 | 29.0%(+26.6)#2,197 |
| 62. | Maurertown | 55.4% | 33.6%(+21.8)#62 | 29.0%(+26.4)#2,243 |
| 63. | Marshall | 55.2% | 33.6%(+21.6)#63 | 29.0%(+26.2)#2,271 |
| 64. | Bull Run | 55.0% | 33.6%(+21.4)#64 | 29.0%(+26.0)#2,298 |
| 65. | Scottsburg | 54.5% | 33.6%(+20.9)#65 | 29.0%(+25.5)#2,381 |
| 66. | Grottoes | 53.9% | 33.6%(+20.3)#66 | 29.0%(+24.9)#2,476 |
| 67. | Hutchison | 53.8% | 33.6%(+20.2)#67 | 29.0%(+24.8)#2,485 |
| 68. | Jewell Ridge | 53.8% | 33.6%(+20.2)#68 | 29.0%(+24.8)#2,511 |
| 69. | Stafford Courthouse | 53.4% | 33.6%(+19.8)#69 | 29.0%(+24.4)#2,576 |
| 70. | Fort Chiswell | 53.3% | 33.6%(+19.7)#70 | 29.0%(+24.3)#2,598 |
| 71. | Crosspointe | 52.2% | 33.6%(+18.6)#71 | 29.0%(+23.2)#2,838 |
| 72. | New Hope | 52.2% | 33.6%(+18.6)#72 | 29.0%(+23.2)#2,846 |
| 73. | Rushmere | 52.1% | 33.6%(+18.5)#73 | 29.0%(+23.1)#2,864 |
| 74. | Fairview Beach | 52.1% | 33.6%(+18.5)#74 | 29.0%(+23.1)#2,873 |
| 75. | Amherst | 52.0% | 33.6%(+18.4)#75 | 29.0%(+23.0)#2,886 |
| 76. | Benns Church | 52.0% | 33.6%(+18.4)#76 | 29.0%(+23.0)#2,891 |
| 77. | Lafayette | 51.8% | 33.6%(+18.2)#77 | 29.0%(+22.8)#2,933 |
| 78. | Apple Mountain Lake | 51.5% | 33.6%(+17.9)#78 | 29.0%(+22.5)#2,981 |
| 79. | Cana | 51.4% | 33.6%(+17.8)#79 | 29.0%(+22.4)#3,003 |
| 80. | Boones Mill | 51.3% | 33.6%(+17.7)#80 | 29.0%(+22.3)#3,030 |
| 81. | Oak Grove | 51.2% | 33.6%(+17.6)#81 | 29.0%(+22.2)#3,036 |
| 82. | Free Union | 51.0% | 33.6%(+17.4)#82 | 29.0%(+22.0)#3,077 |
| 83. | Warsaw | 50.9% | 33.6%(+17.3)#83 | 29.0%(+21.9)#3,083 |
| 84. | Mountain Road | 50.7% | 33.6%(+17.1)#84 | 29.0%(+21.7)#3,127 |
| 85. | Burkeville | 50.7% | 33.6%(+17.1)#85 | 29.0%(+21.7)#3,134 |
| 86. | Mcgaheysville | 50.5% | 33.6%(+16.9)#86 | 29.0%(+21.5)#3,170 |
| 87. | New River | 50.5% | 33.6%(+16.9)#87 | 29.0%(+21.5)#3,179 |
| 88. | Independent Hill | 50.3% | 33.6%(+16.7)#88 | 29.0%(+21.3)#3,199 |
| 89. | Pounding Mill | 50.3% | 33.6%(+16.7)#89 | 29.0%(+21.3)#3,213 |
| 90. | Twin Lakes | 50.1% | 33.6%(+16.5)#90 | 29.0%(+21.1)#3,238 |
| 91. | Eagle Rock | 50.0% | 33.6%(+16.4)#91 | 29.0%(+21.0)#3,319 |
| 92. | King William | 50.0% | 33.6%(+16.4)#92 | 29.0%(+21.0)#3,320 |
| 93. | Orange | 49.7% | 33.6%(+16.1)#93 | 29.0%(+20.7)#3,458 |
| 94. | Jarratt | 49.6% | 33.6%(+16.0)#94 | 29.0%(+20.6)#3,483 |
| 95. | Bull Run Mountain Estates | 49.5% | 33.6%(+15.9)#95 | 29.0%(+20.5)#3,497 |
| 96. | Arrington | 49.3% | 33.6%(+15.7)#96 | 29.0%(+20.3)#3,536 |
| 97. | Keysville | 49.1% | 33.6%(+15.5)#97 | 29.0%(+20.1)#3,591 |
| 98. | Basye | 49.0% | 33.6%(+15.4)#98 | 29.0%(+20.0)#3,616 |
| 99. | Great Falls Crossing | 48.7% | 33.6%(+15.1)#99 | 29.0%(+19.7)#3,694 |
| 100. | Stanley | 48.5% | 33.6%(+14.9)#100 | 29.0%(+19.5)#3,740 |
Common Questions
What are the Top 10 Cities with the Highest Percentage of Households With Three or more Vehicles in Virginia?
Top 10 Cities with the Highest Percentage of Households With Three or more Vehicles in Virginia are:
#1
100.0%
#2
100.0%
#3
100.0%
#4
100.0%
#5
100.0%
#6
100.0%
#7
100.0%
#8
100.0%
#9
100.0%
#10
89.8%
What city has the Highest Percentage of Households With Three or more Vehicles in Virginia?
Deerfield has the Highest Percentage of Households With Three or more Vehicles in Virginia with 100.0%.
What is the Percentage of Households With Three or more Vehicles in the State of Virginia?
Percentage of Households With Three or more Vehicles in Virginia is 33.6%.
What is the Percentage of Households With Three or more Vehicles in the United States?
Percentage of Households With Three or more Vehicles in the United States is 29.0%.