Cities with the Highest Percentage of Households With Three or more Vehicles in Idaho
RELATED REPORTS & OPTIONS
Households with 3 or more Cars
Idaho
Compare Cities
Map of Cities with the Highest Percentage of Households With Three or more Vehicles in Idaho
0.0%
100.0%
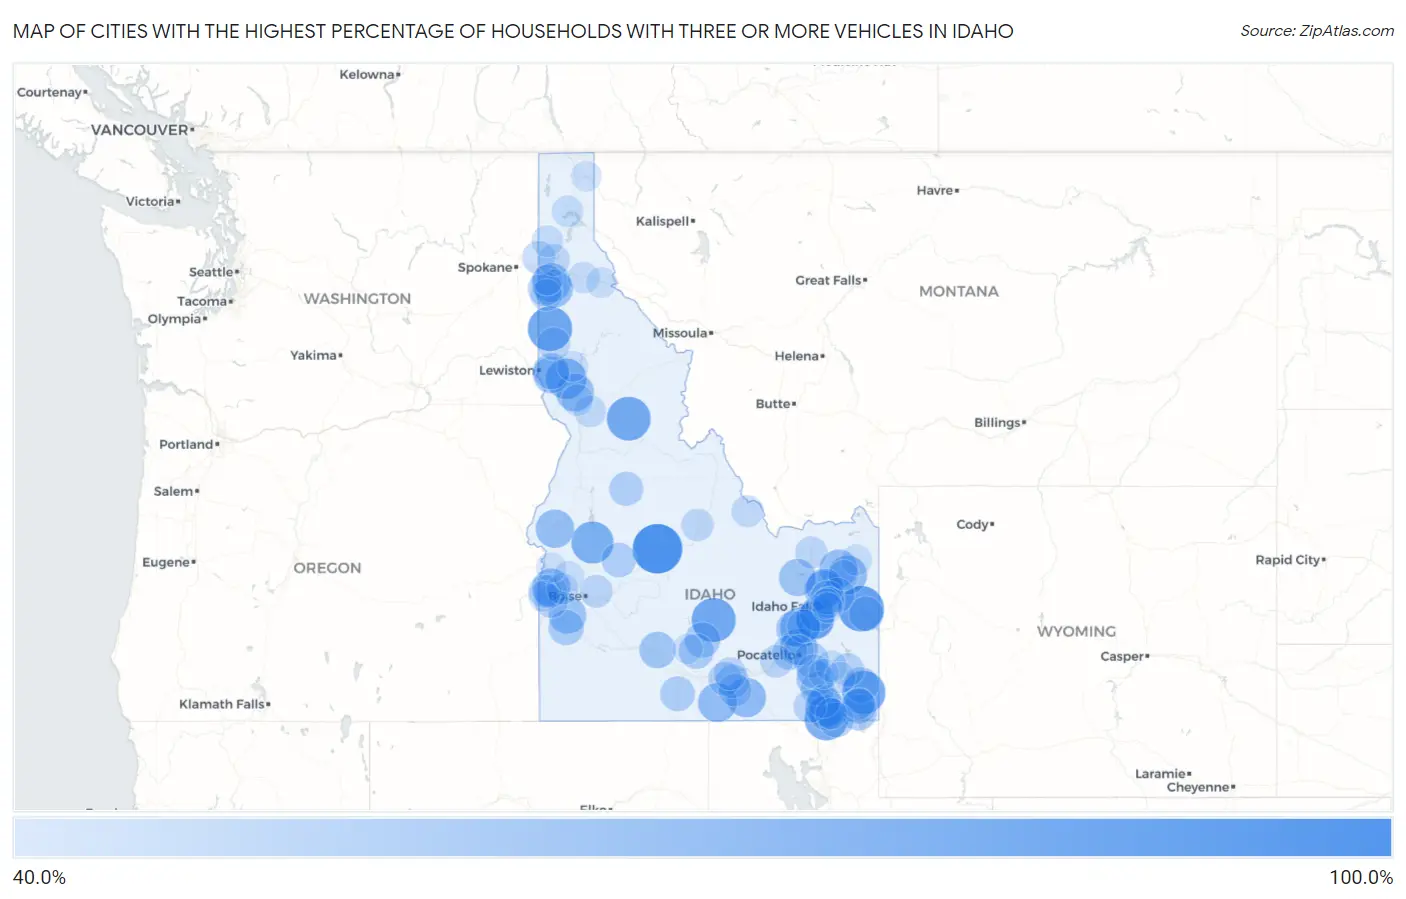
Cities with the Highest Percentage of Households With Three or more Vehicles in Idaho
| City | Housholds With 3+ Cars | vs State | vs National | |
| 1. | Stanley | 100.0% | 38.6%(+61.4)#1 | 29.0%(+71.0)#65 |
| 2. | Fernwood | 100.0% | 38.6%(+61.4)#2 | 29.0%(+71.0)#116 |
| 3. | Swan Valley | 87.7% | 38.6%(+49.1)#3 | 29.0%(+58.7)#450 |
| 4. | Princeton | 83.9% | 38.6%(+45.3)#4 | 29.0%(+54.9)#506 |
| 5. | Carey | 82.8% | 38.6%(+44.2)#5 | 29.0%(+53.8)#528 |
| 6. | Elk City | 82.0% | 38.6%(+43.4)#6 | 29.0%(+53.0)#545 |
| 7. | Bennington | 80.7% | 38.6%(+42.1)#7 | 29.0%(+51.7)#568 |
| 8. | Weston | 80.3% | 38.6%(+41.7)#8 | 29.0%(+51.3)#571 |
| 9. | Smiths Ferry | 76.7% | 38.6%(+38.1)#9 | 29.0%(+47.7)#674 |
| 10. | Reubens | 72.2% | 38.6%(+33.6)#10 | 29.0%(+43.2)#826 |
| 11. | Moreland | 70.5% | 38.6%(+31.9)#11 | 29.0%(+41.5)#873 |
| 12. | Malta | 68.5% | 38.6%(+29.9)#12 | 29.0%(+39.5)#957 |
| 13. | Clifton | 67.6% | 38.6%(+29.0)#13 | 29.0%(+38.6)#1,007 |
| 14. | Newdale | 67.4% | 38.6%(+28.8)#14 | 29.0%(+38.4)#1,018 |
| 15. | Oakley | 67.3% | 38.6%(+28.7)#15 | 29.0%(+38.3)#1,022 |
| 16. | Laclede | 67.2% | 38.6%(+28.6)#16 | 29.0%(+38.2)#1,033 |
| 17. | Firth | 66.7% | 38.6%(+28.1)#17 | 29.0%(+37.7)#1,050 |
| 18. | Harrison | 66.7% | 38.6%(+28.1)#18 | 29.0%(+37.7)#1,053 |
| 19. | Lewisville | 65.7% | 38.6%(+27.1)#19 | 29.0%(+36.7)#1,138 |
| 20. | Midvale | 65.2% | 38.6%(+26.6)#20 | 29.0%(+36.2)#1,167 |
| 21. | Parker | 64.7% | 38.6%(+26.1)#21 | 29.0%(+35.7)#1,194 |
| 22. | Conkling Park | 64.6% | 38.6%(+26.0)#22 | 29.0%(+35.6)#1,215 |
| 23. | Ferdinand | 64.2% | 38.6%(+25.6)#23 | 29.0%(+35.2)#1,242 |
| 24. | Notus | 63.9% | 38.6%(+25.3)#24 | 29.0%(+34.9)#1,254 |
| 25. | Tyhee | 63.6% | 38.6%(+25.0)#25 | 29.0%(+34.6)#1,273 |
| 26. | Menan | 62.5% | 38.6%(+23.9)#26 | 29.0%(+33.5)#1,347 |
| 27. | Melba | 62.2% | 38.6%(+23.6)#27 | 29.0%(+33.2)#1,394 |
| 28. | Basalt | 62.2% | 38.6%(+23.6)#28 | 29.0%(+33.2)#1,396 |
| 29. | Mud Lake | 61.3% | 38.6%(+22.7)#29 | 29.0%(+32.3)#1,480 |
| 30. | Arimo | 60.2% | 38.6%(+21.6)#30 | 29.0%(+31.2)#1,592 |
| 31. | Bliss | 59.7% | 38.6%(+21.1)#31 | 29.0%(+30.7)#1,674 |
| 32. | Sweetwater | 59.3% | 38.6%(+20.7)#32 | 29.0%(+30.3)#1,721 |
| 33. | Lapwai | 58.6% | 38.6%(+20.0)#33 | 29.0%(+29.6)#1,795 |
| 34. | St Charles | 57.4% | 38.6%(+18.8)#34 | 29.0%(+28.4)#1,948 |
| 35. | Dayton | 56.7% | 38.6%(+18.1)#35 | 29.0%(+27.7)#2,044 |
| 36. | Georgetown | 56.4% | 38.6%(+17.8)#36 | 29.0%(+27.4)#2,075 |
| 37. | Richfield | 56.2% | 38.6%(+17.6)#37 | 29.0%(+27.2)#2,115 |
| 38. | Rockford | 55.9% | 38.6%(+17.3)#38 | 29.0%(+26.9)#2,172 |
| 39. | Murphy | 55.8% | 38.6%(+17.2)#39 | 29.0%(+26.8)#2,182 |
| 40. | Shelley | 55.4% | 38.6%(+16.8)#40 | 29.0%(+26.4)#2,240 |
| 41. | Dietrich | 55.3% | 38.6%(+16.7)#41 | 29.0%(+26.3)#2,264 |
| 42. | Bloomington | 55.0% | 38.6%(+16.4)#42 | 29.0%(+26.0)#2,311 |
| 43. | Inkom | 54.7% | 38.6%(+16.1)#43 | 29.0%(+25.7)#2,354 |
| 44. | Franklin | 54.3% | 38.6%(+15.7)#44 | 29.0%(+25.3)#2,409 |
| 45. | Hollister | 54.2% | 38.6%(+15.6)#45 | 29.0%(+25.2)#2,430 |
| 46. | Arbon Valley | 54.1% | 38.6%(+15.5)#46 | 29.0%(+25.1)#2,447 |
| 47. | Irwin | 53.7% | 38.6%(+15.1)#47 | 29.0%(+24.7)#2,525 |
| 48. | Ririe | 53.5% | 38.6%(+14.9)#48 | 29.0%(+24.5)#2,561 |
| 49. | Lowman | 53.3% | 38.6%(+14.7)#49 | 29.0%(+24.3)#2,611 |
| 50. | Worley | 52.7% | 38.6%(+14.1)#50 | 29.0%(+23.7)#2,736 |
| 51. | Yellow Pine | 52.2% | 38.6%(+13.6)#51 | 29.0%(+23.2)#2,851 |
| 52. | Ucon | 51.9% | 38.6%(+13.3)#52 | 29.0%(+22.9)#2,908 |
| 53. | Downey | 51.6% | 38.6%(+13.0)#53 | 29.0%(+22.6)#2,966 |
| 54. | Declo | 51.2% | 38.6%(+12.6)#54 | 29.0%(+22.2)#3,041 |
| 55. | Heyburn | 51.1% | 38.6%(+12.5)#55 | 29.0%(+22.1)#3,052 |
| 56. | Mccammon | 51.1% | 38.6%(+12.5)#56 | 29.0%(+22.1)#3,057 |
| 57. | Soda Springs | 50.5% | 38.6%(+11.9)#57 | 29.0%(+21.5)#3,167 |
| 58. | Oxford | 50.0% | 38.6%(+11.4)#58 | 29.0%(+21.0)#3,386 |
| 59. | Marsing | 49.6% | 38.6%(+11.0)#59 | 29.0%(+20.6)#3,482 |
| 60. | Groveland | 49.5% | 38.6%(+10.9)#60 | 29.0%(+20.5)#3,498 |
| 61. | Greenleaf | 49.5% | 38.6%(+10.9)#61 | 29.0%(+20.5)#3,499 |
| 62. | Albion | 49.2% | 38.6%(+10.6)#62 | 29.0%(+20.2)#3,568 |
| 63. | Malad City | 48.9% | 38.6%(+10.3)#63 | 29.0%(+19.9)#3,634 |
| 64. | Hauser | 48.7% | 38.6%(+10.1)#64 | 29.0%(+19.7)#3,698 |
| 65. | Rupert | 48.3% | 38.6%(+9.70)#65 | 29.0%(+19.3)#3,799 |
| 66. | Wilder | 48.3% | 38.6%(+9.70)#66 | 29.0%(+19.3)#3,803 |
| 67. | Robie Creek | 48.3% | 38.6%(+9.70)#67 | 29.0%(+19.3)#3,806 |
| 68. | American Falls | 48.1% | 38.6%(+9.50)#68 | 29.0%(+19.1)#3,846 |
| 69. | Troy | 48.0% | 38.6%(+9.40)#69 | 29.0%(+19.0)#3,884 |
| 70. | Challis | 47.1% | 38.6%(+8.50)#70 | 29.0%(+18.1)#4,144 |
| 71. | Dubois | 46.6% | 38.6%(+8.00)#71 | 29.0%(+17.6)#4,308 |
| 72. | Dalton Gardens | 46.3% | 38.6%(+7.70)#72 | 29.0%(+17.3)#4,394 |
| 73. | Grangeville | 45.8% | 38.6%(+7.20)#73 | 29.0%(+16.8)#4,557 |
| 74. | Leadore | 45.7% | 38.6%(+7.10)#74 | 29.0%(+16.7)#4,621 |
| 75. | Plummer | 45.3% | 38.6%(+6.70)#75 | 29.0%(+16.3)#4,746 |
| 76. | Paris | 45.3% | 38.6%(+6.70)#76 | 29.0%(+16.3)#4,750 |
| 77. | Bancroft | 44.8% | 38.6%(+6.20)#77 | 29.0%(+15.8)#4,929 |
| 78. | Spirit Lake | 44.6% | 38.6%(+6.00)#78 | 29.0%(+15.6)#4,977 |
| 79. | Pinehurst | 44.6% | 38.6%(+6.00)#79 | 29.0%(+15.6)#4,979 |
| 80. | Middleton | 44.2% | 38.6%(+5.60)#80 | 29.0%(+15.2)#5,129 |
| 81. | Cottonwood | 44.2% | 38.6%(+5.60)#81 | 29.0%(+15.2)#5,145 |
| 82. | Kootenai | 44.2% | 38.6%(+5.60)#82 | 29.0%(+15.2)#5,147 |
| 83. | Viola | 43.8% | 38.6%(+5.20)#83 | 29.0%(+14.8)#5,341 |
| 84. | Ashton | 43.7% | 38.6%(+5.10)#84 | 29.0%(+14.7)#5,366 |
| 85. | Grace | 43.4% | 38.6%(+4.80)#85 | 29.0%(+14.4)#5,482 |
| 86. | Preston | 43.3% | 38.6%(+4.70)#86 | 29.0%(+14.3)#5,509 |
| 87. | Iona | 43.0% | 38.6%(+4.40)#87 | 29.0%(+14.0)#5,634 |
| 88. | Homedale | 42.9% | 38.6%(+4.30)#88 | 29.0%(+13.9)#5,659 |
| 89. | Rockford Bay | 42.5% | 38.6%(+3.90)#89 | 29.0%(+13.5)#5,869 |
| 90. | Wallace | 42.3% | 38.6%(+3.70)#90 | 29.0%(+13.3)#5,939 |
| 91. | Peck | 42.3% | 38.6%(+3.70)#91 | 29.0%(+13.3)#5,962 |
| 92. | Emmett | 42.0% | 38.6%(+3.40)#92 | 29.0%(+13.0)#6,066 |
| 93. | Moyie Springs | 41.5% | 38.6%(+2.90)#93 | 29.0%(+12.5)#6,342 |
| 94. | Lincoln | 41.4% | 38.6%(+2.80)#94 | 29.0%(+12.4)#6,373 |
| 95. | New Plymouth | 41.3% | 38.6%(+2.70)#95 | 29.0%(+12.3)#6,443 |
| 96. | Ammon | 41.0% | 38.6%(+2.40)#96 | 29.0%(+12.0)#6,575 |
| 97. | Chubbuck | 41.0% | 38.6%(+2.40)#97 | 29.0%(+12.0)#6,576 |
| 98. | Shoshone | 40.5% | 38.6%(+1.90)#98 | 29.0%(+11.5)#6,822 |
| 99. | Teton | 40.5% | 38.6%(+1.90)#99 | 29.0%(+11.5)#6,829 |
| 100. | Lava Hot Springs | 40.5% | 38.6%(+1.90)#100 | 29.0%(+11.5)#6,847 |
Common Questions
What are the Top 10 Cities with the Highest Percentage of Households With Three or more Vehicles in Idaho?
Top 10 Cities with the Highest Percentage of Households With Three or more Vehicles in Idaho are:
#1
100.0%
#2
87.7%
#3
83.9%
#4
82.8%
#5
82.0%
#6
80.7%
#7
80.3%
#8
76.7%
#9
72.2%
#10
70.5%
What city has the Highest Percentage of Households With Three or more Vehicles in Idaho?
Stanley has the Highest Percentage of Households With Three or more Vehicles in Idaho with 100.0%.
What is the Percentage of Households With Three or more Vehicles in the State of Idaho?
Percentage of Households With Three or more Vehicles in Idaho is 38.6%.
What is the Percentage of Households With Three or more Vehicles in the United States?
Percentage of Households With Three or more Vehicles in the United States is 29.0%.