Cities with the Highest Percentage of Households With Three or more Vehicles in Kansas
RELATED REPORTS & OPTIONS
Households with 3 or more Cars
Kansas
Compare Cities
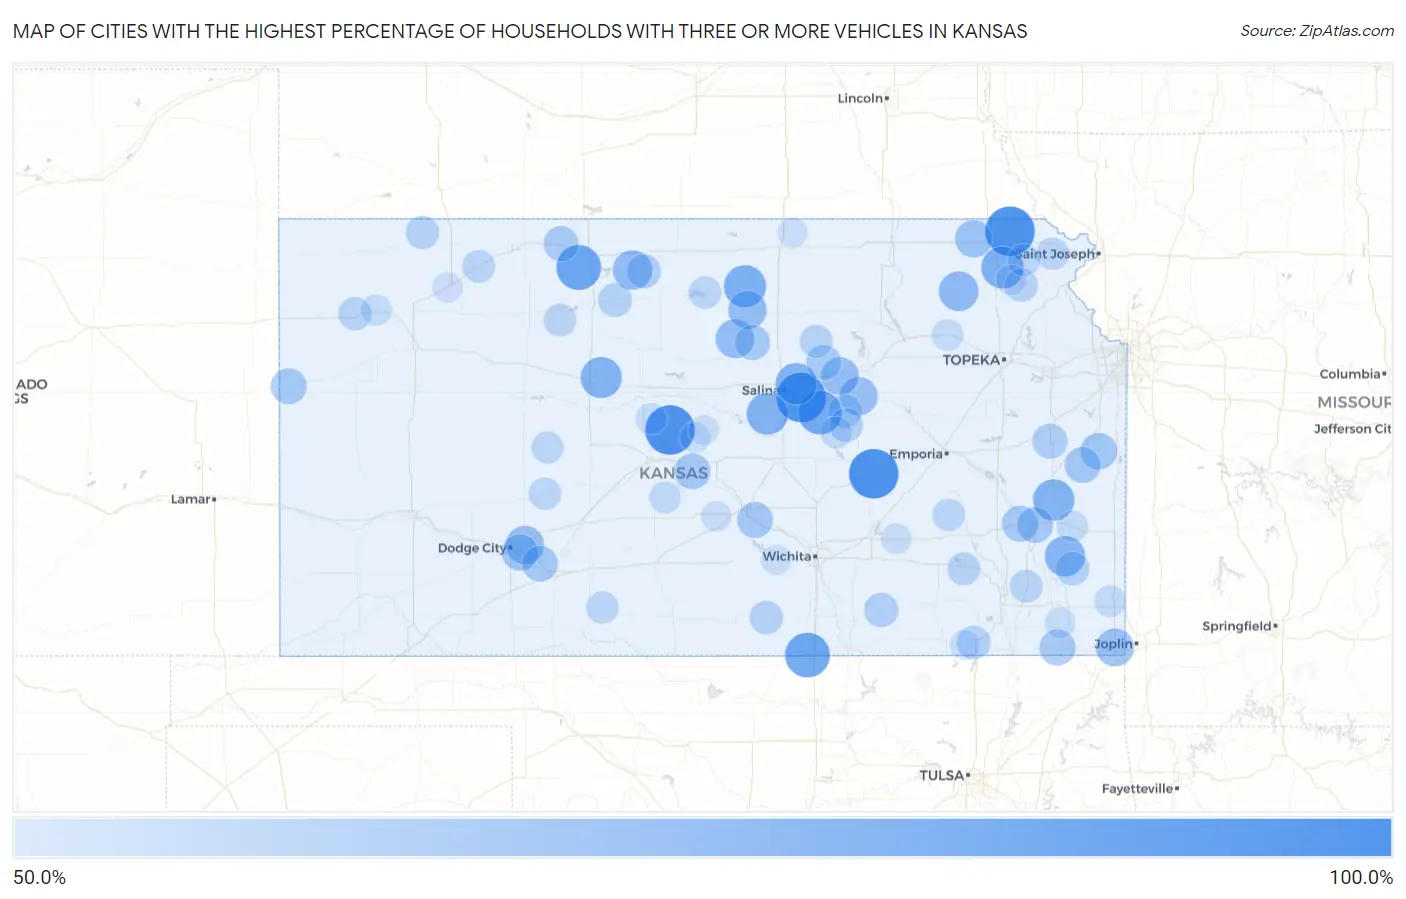
Map of Cities with the Highest Percentage of Households With Three or more Vehicles in Kansas
0.0%
100.0%
Cities with the Highest Percentage of Households With Three or more Vehicles in Kansas
| City | Housholds With 3+ Cars | vs State | vs National | |
| 1. | Odin | 100.0% | 34.5%(+65.5)#1 | 29.0%(+71.0)#124 |
| 2. | Kipp | 100.0% | 34.5%(+65.5)#2 | 29.0%(+71.0)#167 |
| 3. | Piedmont | 100.0% | 34.5%(+65.5)#3 | 29.0%(+71.0)#180 |
| 4. | Devon | 100.0% | 34.5%(+65.5)#4 | 29.0%(+71.0)#238 |
| 5. | Idana | 100.0% | 34.5%(+65.5)#5 | 29.0%(+71.0)#267 |
| 6. | St. Benedict | 100.0% | 34.5%(+65.5)#6 | 29.0%(+71.0)#268 |
| 7. | Lafontaine | 100.0% | 34.5%(+65.5)#7 | 29.0%(+71.0)#283 |
| 8. | Beaver | 100.0% | 34.5%(+65.5)#8 | 29.0%(+71.0)#323 |
| 9. | Hamlin | 100.0% | 34.5%(+65.5)#9 | 29.0%(+71.0)#335 |
| 10. | Opolis | 100.0% | 34.5%(+65.5)#10 | 29.0%(+71.0)#357 |
| 11. | Norway | 100.0% | 34.5%(+65.5)#11 | 29.0%(+71.0)#364 |
| 12. | Woodruff | 100.0% | 34.5%(+65.5)#12 | 29.0%(+71.0)#378 |
| 13. | Cedar Point | 100.0% | 34.5%(+65.5)#13 | 29.0%(+71.0)#385 |
| 14. | Bremen | 93.1% | 34.5%(+58.6)#14 | 29.0%(+64.1)#403 |
| 15. | Keats | 91.4% | 34.5%(+56.9)#15 | 29.0%(+62.4)#411 |
| 16. | Sycamore | 88.4% | 34.5%(+53.9)#16 | 29.0%(+59.4)#432 |
| 17. | Speed | 88.2% | 34.5%(+53.7)#17 | 29.0%(+59.2)#442 |
| 18. | Hunnewell | 88.0% | 34.5%(+53.5)#18 | 29.0%(+59.0)#445 |
| 19. | Carlton | 85.7% | 34.5%(+51.2)#19 | 29.0%(+56.7)#480 |
| 20. | Kickapoo Site 5 | 81.8% | 34.5%(+47.3)#20 | 29.0%(+52.8)#547 |
| 21. | Scottsville | 81.8% | 34.5%(+47.3)#21 | 29.0%(+52.8)#548 |
| 22. | Falun | 80.4% | 34.5%(+45.9)#22 | 29.0%(+51.4)#570 |
| 23. | New Cambria | 80.0% | 34.5%(+45.5)#23 | 29.0%(+51.0)#579 |
| 24. | Lone Elm | 80.0% | 34.5%(+45.5)#24 | 29.0%(+51.0)#585 |
| 25. | Catharine | 79.4% | 34.5%(+44.9)#25 | 29.0%(+50.4)#601 |
| 26. | Stark | 77.8% | 34.5%(+43.3)#26 | 29.0%(+48.8)#648 |
| 27. | Havensville | 75.7% | 34.5%(+41.2)#27 | 29.0%(+46.7)#710 |
| 28. | Mentor | 75.4% | 34.5%(+40.9)#28 | 29.0%(+46.4)#720 |
| 29. | Pilsen | 75.0% | 34.5%(+40.5)#29 | 29.0%(+46.0)#736 |
| 30. | Cedar | 75.0% | 34.5%(+40.5)#30 | 29.0%(+46.0)#753 |
| 31. | Yale | 73.9% | 34.5%(+39.4)#31 | 29.0%(+44.9)#775 |
| 32. | Barnard | 73.3% | 34.5%(+38.8)#32 | 29.0%(+44.3)#797 |
| 33. | Simpson | 72.5% | 34.5%(+38.0)#33 | 29.0%(+43.5)#819 |
| 34. | Wright | 72.4% | 34.5%(+37.9)#34 | 29.0%(+43.4)#824 |
| 35. | Woodbine | 72.1% | 34.5%(+37.6)#35 | 29.0%(+43.1)#828 |
| 36. | Detroit | 71.7% | 34.5%(+37.2)#36 | 29.0%(+42.7)#838 |
| 37. | Lowell | 71.3% | 34.5%(+36.8)#37 | 29.0%(+42.3)#853 |
| 38. | Hallowell | 70.6% | 34.5%(+36.1)#38 | 29.0%(+41.6)#872 |
| 39. | Oneida | 70.0% | 34.5%(+35.5)#39 | 29.0%(+41.0)#891 |
| 40. | Fontana | 68.1% | 34.5%(+33.6)#40 | 29.0%(+39.1)#983 |
| 41. | Wilroads Gardens | 67.8% | 34.5%(+33.3)#41 | 29.0%(+38.8)#1,001 |
| 42. | Parker | 66.9% | 34.5%(+32.4)#42 | 29.0%(+37.9)#1,044 |
| 43. | Weskan | 66.7% | 34.5%(+32.2)#43 | 29.0%(+37.7)#1,062 |
| 44. | Raymond | 66.7% | 34.5%(+32.2)#44 | 29.0%(+37.7)#1,067 |
| 45. | Bartlett | 66.7% | 34.5%(+32.2)#45 | 29.0%(+37.7)#1,075 |
| 46. | Piqua | 66.7% | 34.5%(+32.2)#46 | 29.0%(+37.7)#1,076 |
| 47. | Yoder | 66.7% | 34.5%(+32.2)#47 | 29.0%(+37.7)#1,081 |
| 48. | Bassett | 66.7% | 34.5%(+32.2)#48 | 29.0%(+37.7)#1,088 |
| 49. | Ford | 66.1% | 34.5%(+31.6)#49 | 29.0%(+37.1)#1,119 |
| 50. | Croweburg | 65.6% | 34.5%(+31.1)#50 | 29.0%(+36.6)#1,143 |
| 51. | Prairie View | 65.0% | 34.5%(+30.5)#51 | 29.0%(+36.0)#1,180 |
| 52. | Ada | 65.0% | 34.5%(+30.5)#52 | 29.0%(+36.0)#1,182 |
| 53. | Talmage | 64.7% | 34.5%(+30.2)#53 | 29.0%(+35.7)#1,203 |
| 54. | Princeton | 64.5% | 34.5%(+30.0)#54 | 29.0%(+35.5)#1,220 |
| 55. | Greeley County Unified Government (Balance) | 63.2% | 34.5%(+28.7)#55 | 29.0%(+34.2)#1,304 |
| 56. | Burden | 62.8% | 34.5%(+28.3)#56 | 29.0%(+33.8)#1,337 |
| 57. | Gaylord | 62.5% | 34.5%(+28.0)#57 | 29.0%(+33.5)#1,361 |
| 58. | Burdick | 62.5% | 34.5%(+28.0)#58 | 29.0%(+33.5)#1,372 |
| 59. | Woodston | 61.9% | 34.5%(+27.4)#59 | 29.0%(+32.9)#1,428 |
| 60. | Walnut | 61.8% | 34.5%(+27.3)#60 | 29.0%(+32.8)#1,435 |
| 61. | Hope | 61.6% | 34.5%(+27.1)#61 | 29.0%(+32.6)#1,447 |
| 62. | Havana | 61.5% | 34.5%(+27.0)#62 | 29.0%(+32.5)#1,466 |
| 63. | Ramona | 61.3% | 34.5%(+26.8)#63 | 29.0%(+32.3)#1,487 |
| 64. | Argonia | 60.9% | 34.5%(+26.4)#64 | 29.0%(+31.9)#1,528 |
| 65. | Herndon | 60.7% | 34.5%(+26.2)#65 | 29.0%(+31.7)#1,549 |
| 66. | Brewster | 60.4% | 34.5%(+25.9)#66 | 29.0%(+31.4)#1,576 |
| 67. | Muscotah | 60.4% | 34.5%(+25.9)#67 | 29.0%(+31.4)#1,580 |
| 68. | Fall River | 60.0% | 34.5%(+25.5)#68 | 29.0%(+31.0)#1,614 |
| 69. | Longford | 60.0% | 34.5%(+25.5)#69 | 29.0%(+31.0)#1,637 |
| 70. | Tecumseh | 59.8% | 34.5%(+25.3)#70 | 29.0%(+30.8)#1,664 |
| 71. | Thayer | 59.6% | 34.5%(+25.1)#71 | 29.0%(+30.6)#1,682 |
| 72. | Jennings | 59.4% | 34.5%(+24.9)#72 | 29.0%(+30.4)#1,712 |
| 73. | Damar | 59.3% | 34.5%(+24.8)#73 | 29.0%(+30.3)#1,720 |
| 74. | Hamilton | 58.8% | 34.5%(+24.3)#74 | 29.0%(+29.8)#1,780 |
| 75. | Severance | 58.8% | 34.5%(+24.3)#75 | 29.0%(+29.8)#1,784 |
| 76. | Hanston | 58.6% | 34.5%(+24.1)#76 | 29.0%(+29.6)#1,803 |
| 77. | Glen Elder | 58.5% | 34.5%(+24.0)#77 | 29.0%(+29.5)#1,810 |
| 78. | Monument | 58.3% | 34.5%(+23.8)#78 | 29.0%(+29.3)#1,846 |
| 79. | Wilmore | 58.3% | 34.5%(+23.8)#79 | 29.0%(+29.3)#1,848 |
| 80. | Willis | 58.3% | 34.5%(+23.8)#80 | 29.0%(+29.3)#1,849 |
| 81. | Bazine | 58.0% | 34.5%(+23.5)#81 | 29.0%(+29.0)#1,879 |
| 82. | Stuttgart | 57.1% | 34.5%(+22.6)#82 | 29.0%(+28.1)#1,984 |
| 83. | Tampa | 56.8% | 34.5%(+22.3)#83 | 29.0%(+27.8)#2,033 |
| 84. | Hudson | 56.8% | 34.5%(+22.3)#84 | 29.0%(+27.8)#2,034 |
| 85. | Belvue | 56.7% | 34.5%(+22.2)#85 | 29.0%(+27.7)#2,048 |
| 86. | Chicopee | 56.6% | 34.5%(+22.1)#86 | 29.0%(+27.6)#2,055 |
| 87. | Dennis | 56.5% | 34.5%(+22.0)#87 | 29.0%(+27.5)#2,070 |
| 88. | Bronson | 56.2% | 34.5%(+21.7)#88 | 29.0%(+27.2)#2,114 |
| 89. | Levant | 55.8% | 34.5%(+21.3)#89 | 29.0%(+26.8)#2,184 |
| 90. | Susank | 55.6% | 34.5%(+21.1)#90 | 29.0%(+26.6)#2,224 |
| 91. | Rosalia | 54.8% | 34.5%(+20.3)#91 | 29.0%(+25.8)#2,341 |
| 92. | Labette | 54.5% | 34.5%(+20.0)#92 | 29.0%(+25.5)#2,392 |
| 93. | Abbyville | 54.3% | 34.5%(+19.8)#93 | 29.0%(+25.3)#2,418 |
| 94. | Bushton | 54.1% | 34.5%(+19.6)#94 | 29.0%(+25.1)#2,453 |
| 95. | Whiting | 54.1% | 34.5%(+19.6)#95 | 29.0%(+25.1)#2,456 |
| 96. | Selden | 53.9% | 34.5%(+19.4)#96 | 29.0%(+24.9)#2,483 |
| 97. | Lorraine | 53.7% | 34.5%(+19.2)#97 | 29.0%(+24.7)#2,526 |
| 98. | Niotaze | 53.7% | 34.5%(+19.2)#98 | 29.0%(+24.7)#2,529 |
| 99. | Garden Plain | 53.6% | 34.5%(+19.1)#99 | 29.0%(+24.6)#2,544 |
| 100. | Munden | 53.2% | 34.5%(+18.7)#100 | 29.0%(+24.2)#2,640 |
Common Questions
What are the Top 10 Cities with the Highest Percentage of Households With Three or more Vehicles in Kansas?
Top 10 Cities with the Highest Percentage of Households With Three or more Vehicles in Kansas are:
#1
100.0%
#2
100.0%
#3
100.0%
#4
100.0%
#5
88.2%
#6
88.0%
#7
85.7%
#8
81.8%
#9
81.8%
#10
80.4%
What city has the Highest Percentage of Households With Three or more Vehicles in Kansas?
Odin has the Highest Percentage of Households With Three or more Vehicles in Kansas with 100.0%.
What is the Percentage of Households With Three or more Vehicles in the State of Kansas?
Percentage of Households With Three or more Vehicles in Kansas is 34.5%.
What is the Percentage of Households With Three or more Vehicles in the United States?
Percentage of Households With Three or more Vehicles in the United States is 29.0%.