Cities with the Highest Percentage of Households With Three or more Vehicles in New Mexico
RELATED REPORTS & OPTIONS
Households with 3 or more Cars
New Mexico
Compare Cities
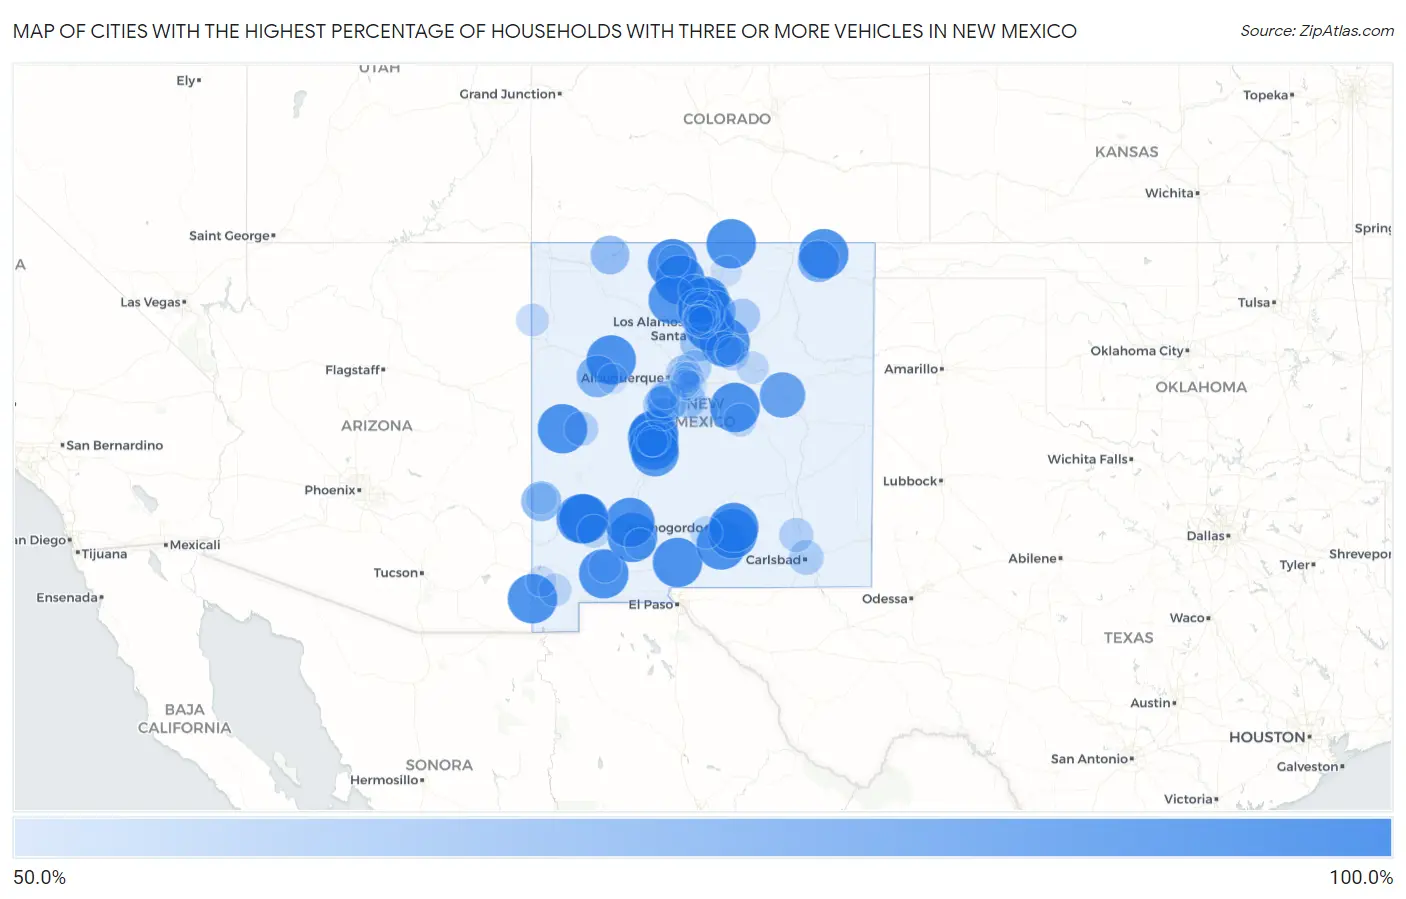
Map of Cities with the Highest Percentage of Households With Three or more Vehicles in New Mexico
0.0%
100.0%
Cities with the Highest Percentage of Households With Three or more Vehicles in New Mexico
| City | Housholds With 3+ Cars | vs State | vs National | |
| 1. | White Sands | 100.0% | 31.6%(+68.4)#1 | 29.0%(+71.0)#8 |
| 2. | Canova | 100.0% | 31.6%(+68.4)#2 | 29.0%(+71.0)#16 |
| 3. | Cuartelez | 100.0% | 31.6%(+68.4)#3 | 29.0%(+71.0)#23 |
| 4. | Costilla | 100.0% | 31.6%(+68.4)#4 | 29.0%(+71.0)#24 |
| 5. | Tierra Amarilla | 100.0% | 31.6%(+68.4)#5 | 29.0%(+71.0)#25 |
| 6. | Fort Wingate | 100.0% | 31.6%(+68.4)#6 | 29.0%(+71.0)#29 |
| 7. | East Pecos | 100.0% | 31.6%(+68.4)#7 | 29.0%(+71.0)#36 |
| 8. | Quemado | 100.0% | 31.6%(+68.4)#8 | 29.0%(+71.0)#58 |
| 9. | Broadview | 100.0% | 31.6%(+68.4)#9 | 29.0%(+71.0)#64 |
| 10. | Mount Taylor | 100.0% | 31.6%(+68.4)#10 | 29.0%(+71.0)#82 |
| 11. | Rio En Medio | 100.0% | 31.6%(+68.4)#11 | 29.0%(+71.0)#87 |
| 12. | Medanales | 100.0% | 31.6%(+68.4)#12 | 29.0%(+71.0)#99 |
| 13. | Continental Divide | 100.0% | 31.6%(+68.4)#13 | 29.0%(+71.0)#119 |
| 14. | Canjilon | 100.0% | 31.6%(+68.4)#14 | 29.0%(+71.0)#121 |
| 15. | Timberon | 100.0% | 31.6%(+68.4)#15 | 29.0%(+71.0)#131 |
| 16. | Lyden | 100.0% | 31.6%(+68.4)#16 | 29.0%(+71.0)#160 |
| 17. | Pulpotio Bareas | 100.0% | 31.6%(+68.4)#17 | 29.0%(+71.0)#161 |
| 18. | Weed | 100.0% | 31.6%(+68.4)#18 | 29.0%(+71.0)#168 |
| 19. | Garfield | 100.0% | 31.6%(+68.4)#19 | 29.0%(+71.0)#186 |
| 20. | La Boca | 100.0% | 31.6%(+68.4)#20 | 29.0%(+71.0)#187 |
| 21. | Caballo | 100.0% | 31.6%(+68.4)#21 | 29.0%(+71.0)#196 |
| 22. | Vanderwagen | 100.0% | 31.6%(+68.4)#22 | 29.0%(+71.0)#219 |
| 23. | Chamizal | 100.0% | 31.6%(+68.4)#24 | 29.0%(+71.0)#225 |
| 24. | Rodeo | 100.0% | 31.6%(+68.4)#25 | 29.0%(+71.0)#227 |
| 25. | Lake Roberts | 100.0% | 31.6%(+68.4)#26 | 29.0%(+71.0)#228 |
| 26. | Folsom | 100.0% | 31.6%(+68.4)#27 | 29.0%(+71.0)#233 |
| 27. | San Acacia | 100.0% | 31.6%(+68.4)#28 | 29.0%(+71.0)#266 |
| 28. | Encino | 100.0% | 31.6%(+68.4)#29 | 29.0%(+71.0)#267 |
| 29. | Mayhill | 100.0% | 31.6%(+68.4)#30 | 29.0%(+71.0)#282 |
| 30. | Lake Roberts Heights | 100.0% | 31.6%(+68.4)#31 | 29.0%(+71.0)#302 |
| 31. | San Mateo | 100.0% | 31.6%(+68.4)#32 | 29.0%(+71.0)#314 |
| 32. | Escondida | 100.0% | 31.6%(+68.4)#33 | 29.0%(+71.0)#324 |
| 33. | Youngsville | 96.4% | 31.6%(+64.8)#34 | 29.0%(+67.4)#390 |
| 34. | Luis Lopez | 95.7% | 31.6%(+64.1)#35 | 29.0%(+66.7)#392 |
| 35. | Puerto De Luna | 90.2% | 31.6%(+58.6)#36 | 29.0%(+61.2)#416 |
| 36. | White Cliffs | 88.7% | 31.6%(+57.1)#37 | 29.0%(+59.7)#428 |
| 37. | San Rafael | 81.1% | 31.6%(+49.5)#38 | 29.0%(+52.1)#560 |
| 38. | Capulin | 81.0% | 31.6%(+49.4)#39 | 29.0%(+52.0)#563 |
| 39. | Truchas | 80.0% | 31.6%(+48.4)#40 | 29.0%(+51.0)#574 |
| 40. | El Duende | 76.9% | 31.6%(+45.3)#41 | 29.0%(+47.9)#665 |
| 41. | Monterey Park | 76.5% | 31.6%(+44.9)#42 | 29.0%(+47.5)#676 |
| 42. | Pleasanton | 76.5% | 31.6%(+44.9)#43 | 29.0%(+47.5)#677 |
| 43. | Navajo Dam | 73.7% | 31.6%(+42.1)#44 | 29.0%(+44.7)#784 |
| 44. | La Puebla | 73.3% | 31.6%(+41.7)#45 | 29.0%(+44.3)#795 |
| 45. | Torreon Cdp Torrance County | 72.4% | 31.6%(+40.8)#46 | 29.0%(+43.4)#822 |
| 46. | La Cienega | 70.7% | 31.6%(+39.1)#47 | 29.0%(+41.7)#865 |
| 47. | Stanley | 68.8% | 31.6%(+37.2)#48 | 29.0%(+39.8)#946 |
| 48. | Sausal | 68.1% | 31.6%(+36.5)#49 | 29.0%(+39.1)#982 |
| 49. | Tajique | 67.5% | 31.6%(+35.9)#50 | 29.0%(+38.5)#1,013 |
| 50. | Polvadera | 67.3% | 31.6%(+35.7)#51 | 29.0%(+38.3)#1,023 |
| 51. | La Villita | 66.8% | 31.6%(+35.2)#52 | 29.0%(+37.8)#1,045 |
| 52. | Encantado | 66.7% | 31.6%(+35.1)#53 | 29.0%(+37.7)#1,072 |
| 53. | Mora | 65.4% | 31.6%(+33.8)#54 | 29.0%(+36.4)#1,152 |
| 54. | San Pedro | 64.8% | 31.6%(+33.2)#55 | 29.0%(+35.8)#1,189 |
| 55. | Rowe | 64.5% | 31.6%(+32.9)#56 | 29.0%(+35.5)#1,218 |
| 56. | La Huerta | 64.0% | 31.6%(+32.4)#57 | 29.0%(+35.0)#1,247 |
| 57. | Sandia Park | 63.4% | 31.6%(+31.8)#58 | 29.0%(+34.4)#1,295 |
| 58. | Atoka | 62.6% | 31.6%(+31.0)#59 | 29.0%(+33.6)#1,343 |
| 59. | Pueblito | 62.5% | 31.6%(+30.9)#60 | 29.0%(+33.5)#1,363 |
| 60. | Pie Town | 62.3% | 31.6%(+30.7)#61 | 29.0%(+33.3)#1,385 |
| 61. | Soham | 61.2% | 31.6%(+29.6)#62 | 29.0%(+32.2)#1,494 |
| 62. | Fruitland | 61.1% | 31.6%(+29.5)#63 | 29.0%(+32.1)#1,503 |
| 63. | Valle Vista | 61.0% | 31.6%(+29.4)#64 | 29.0%(+32.0)#1,520 |
| 64. | La Mesilla | 60.2% | 31.6%(+28.6)#65 | 29.0%(+31.2)#1,588 |
| 65. | Mimbres | 60.2% | 31.6%(+28.6)#66 | 29.0%(+31.2)#1,591 |
| 66. | Casa Colorada | 60.2% | 31.6%(+28.6)#67 | 29.0%(+31.2)#1,594 |
| 67. | Duran | 60.0% | 31.6%(+28.4)#68 | 29.0%(+31.0)#1,646 |
| 68. | Keeler Farm | 59.7% | 31.6%(+28.1)#69 | 29.0%(+30.7)#1,668 |
| 69. | Dona Ana | 59.7% | 31.6%(+28.1)#70 | 29.0%(+30.7)#1,669 |
| 70. | Navajo | 59.3% | 31.6%(+27.7)#71 | 29.0%(+30.3)#1,713 |
| 71. | Windmill | 59.3% | 31.6%(+27.7)#72 | 29.0%(+30.3)#1,726 |
| 72. | El Rancho | 59.1% | 31.6%(+27.5)#73 | 29.0%(+30.1)#1,737 |
| 73. | Boles Acres | 58.3% | 31.6%(+26.7)#74 | 29.0%(+29.3)#1,827 |
| 74. | Tecolotito | 58.2% | 31.6%(+26.6)#75 | 29.0%(+29.2)#1,857 |
| 75. | Ensenada | 58.2% | 31.6%(+26.6)#76 | 29.0%(+29.2)#1,860 |
| 76. | Tome | 58.1% | 31.6%(+26.5)#77 | 29.0%(+29.1)#1,863 |
| 77. | Cuyamungue | 57.2% | 31.6%(+25.6)#78 | 29.0%(+28.2)#1,954 |
| 78. | Tijeras | 56.9% | 31.6%(+25.3)#79 | 29.0%(+27.9)#2,016 |
| 79. | Los Chaves | 56.5% | 31.6%(+24.9)#80 | 29.0%(+27.5)#2,061 |
| 80. | San Jose Cdp Rio Arriba County | 56.5% | 31.6%(+24.9)#81 | 29.0%(+27.5)#2,062 |
| 81. | Glenwood | 56.3% | 31.6%(+24.7)#82 | 29.0%(+27.3)#2,098 |
| 82. | Bluewater | 56.1% | 31.6%(+24.5)#83 | 29.0%(+27.1)#2,135 |
| 83. | Willard | 55.9% | 31.6%(+24.3)#84 | 29.0%(+26.9)#2,170 |
| 84. | El Valle De Arroyo Seco | 55.7% | 31.6%(+24.1)#85 | 29.0%(+26.7)#2,187 |
| 85. | Rio Rancho Estates | 55.3% | 31.6%(+23.7)#86 | 29.0%(+26.3)#2,260 |
| 86. | Sedillo | 55.3% | 31.6%(+23.7)#87 | 29.0%(+26.3)#2,262 |
| 87. | Rodey | 55.1% | 31.6%(+23.5)#88 | 29.0%(+26.1)#2,290 |
| 88. | San Cristobal | 55.1% | 31.6%(+23.5)#89 | 29.0%(+26.1)#2,297 |
| 89. | Cotton City | 55.0% | 31.6%(+23.4)#90 | 29.0%(+26.0)#2,307 |
| 90. | Manzano Springs | 55.0% | 31.6%(+23.4)#91 | 29.0%(+26.0)#2,316 |
| 91. | Ponderosa Pine | 54.8% | 31.6%(+23.2)#92 | 29.0%(+25.8)#2,332 |
| 92. | El Rito | 54.7% | 31.6%(+23.1)#93 | 29.0%(+25.7)#2,353 |
| 93. | San Ildefonso Pueblo | 54.5% | 31.6%(+22.9)#94 | 29.0%(+25.5)#2,368 |
| 94. | Sagar | 54.4% | 31.6%(+22.8)#95 | 29.0%(+25.4)#2,402 |
| 95. | Bosque Farms | 54.2% | 31.6%(+22.6)#96 | 29.0%(+25.2)#2,419 |
| 96. | Acomita Lake | 54.0% | 31.6%(+22.4)#97 | 29.0%(+25.0)#2,469 |
| 97. | Golden Acres | 53.7% | 31.6%(+22.1)#98 | 29.0%(+24.7)#2,528 |
| 98. | North San Ysidro | 53.4% | 31.6%(+21.8)#99 | 29.0%(+24.4)#2,588 |
| 99. | Lemitar | 53.3% | 31.6%(+21.7)#100 | 29.0%(+24.3)#2,599 |
| 100. | Cedro | 53.2% | 31.6%(+21.6)#101 | 29.0%(+24.2)#2,627 |
Common Questions
What are the Top 10 Cities with the Highest Percentage of Households With Three or more Vehicles in New Mexico?
Top 10 Cities with the Highest Percentage of Households With Three or more Vehicles in New Mexico are:
#1
100.0%
#2
100.0%
#3
100.0%
#4
100.0%
#5
100.0%
#6
100.0%
#7
100.0%
#8
100.0%
#9
100.0%
#10
100.0%
What city has the Highest Percentage of Households With Three or more Vehicles in New Mexico?
White Sands has the Highest Percentage of Households With Three or more Vehicles in New Mexico with 100.0%.
What is the Percentage of Households With Three or more Vehicles in the State of New Mexico?
Percentage of Households With Three or more Vehicles in New Mexico is 31.6%.
What is the Percentage of Households With Three or more Vehicles in the United States?
Percentage of Households With Three or more Vehicles in the United States is 29.0%.