Cities with the Highest Percentage of Households With Three or more Vehicles in Tennessee
RELATED REPORTS & OPTIONS
Households with 3 or more Cars
Tennessee
Compare Cities
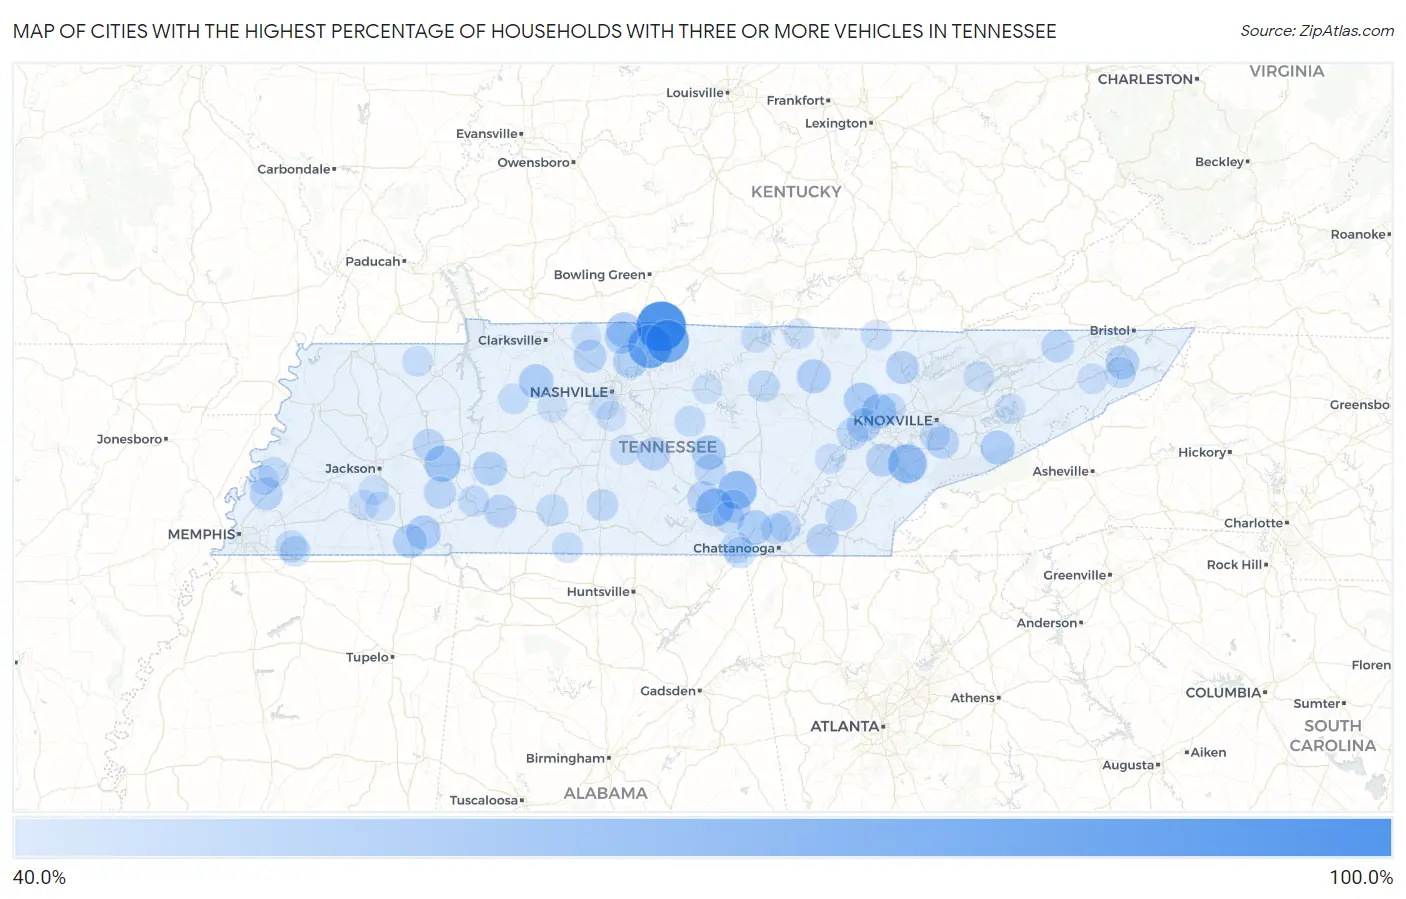
Map of Cities with the Highest Percentage of Households With Three or more Vehicles in Tennessee
0.0%
100.0%
Cities with the Highest Percentage of Households With Three or more Vehicles in Tennessee
| City | Housholds With 3+ Cars | vs State | vs National | |
| 1. | Sequatchie | 100.0% | 33.4%(+66.6)#1 | 29.0%(+71.0)#19 |
| 2. | Fairfield | 100.0% | 33.4%(+66.6)#2 | 29.0%(+71.0)#54 |
| 3. | Conasauga | 100.0% | 33.4%(+66.6)#3 | 29.0%(+71.0)#102 |
| 4. | Dellrose | 100.0% | 33.4%(+66.6)#4 | 29.0%(+71.0)#163 |
| 5. | Belvidere | 100.0% | 33.4%(+66.6)#5 | 29.0%(+71.0)#197 |
| 6. | Dancyville | 100.0% | 33.4%(+66.6)#6 | 29.0%(+71.0)#269 |
| 7. | Childers Hill | 100.0% | 33.4%(+66.6)#7 | 29.0%(+71.0)#315 |
| 8. | Luray | 83.8% | 33.4%(+50.4)#8 | 29.0%(+54.8)#507 |
| 9. | Dukedom | 82.4% | 33.4%(+49.0)#9 | 29.0%(+53.4)#538 |
| 10. | Graball | 81.6% | 33.4%(+48.2)#10 | 29.0%(+52.6)#551 |
| 11. | Huron | 81.3% | 33.4%(+47.9)#11 | 29.0%(+52.3)#557 |
| 12. | Bransford | 80.0% | 33.4%(+46.6)#12 | 29.0%(+51.0)#578 |
| 13. | Norene | 75.4% | 33.4%(+42.0)#13 | 29.0%(+46.4)#719 |
| 14. | Gladeville | 68.3% | 33.4%(+34.9)#14 | 29.0%(+39.3)#969 |
| 15. | Greenback | 67.2% | 33.4%(+33.8)#15 | 29.0%(+38.2)#1,029 |
| 16. | Beersheba Springs | 66.3% | 33.4%(+32.9)#16 | 29.0%(+37.3)#1,104 |
| 17. | Hilham | 65.3% | 33.4%(+31.9)#17 | 29.0%(+36.3)#1,163 |
| 18. | Pelham | 63.8% | 33.4%(+30.4)#18 | 29.0%(+34.8)#1,264 |
| 19. | Mcdonald | 62.1% | 33.4%(+28.7)#19 | 29.0%(+33.1)#1,407 |
| 20. | Blanche | 61.9% | 33.4%(+28.5)#20 | 29.0%(+32.9)#1,425 |
| 21. | Chesterfield | 59.9% | 33.4%(+26.5)#21 | 29.0%(+30.9)#1,651 |
| 22. | Pocahontas | 58.8% | 33.4%(+25.4)#22 | 29.0%(+29.8)#1,779 |
| 23. | Beech Bluff | 57.6% | 33.4%(+24.2)#23 | 29.0%(+28.6)#1,928 |
| 24. | Butler | 56.8% | 33.4%(+23.4)#24 | 29.0%(+27.8)#2,031 |
| 25. | Orlinda | 56.4% | 33.4%(+23.0)#25 | 29.0%(+27.4)#2,074 |
| 26. | Walnut Grove Cdp Sumner County | 56.1% | 33.4%(+22.7)#26 | 29.0%(+27.1)#2,128 |
| 27. | Wartburg | 55.2% | 33.4%(+21.8)#27 | 29.0%(+26.2)#2,272 |
| 28. | Coalfield | 55.0% | 33.4%(+21.6)#28 | 29.0%(+26.0)#2,301 |
| 29. | Delano | 54.7% | 33.4%(+21.3)#29 | 29.0%(+25.7)#2,356 |
| 30. | Whitwell | 54.5% | 33.4%(+21.1)#30 | 29.0%(+25.5)#2,367 |
| 31. | Farner | 54.3% | 33.4%(+20.9)#31 | 29.0%(+25.3)#2,417 |
| 32. | Vanleer | 54.2% | 33.4%(+20.8)#32 | 29.0%(+25.2)#2,427 |
| 33. | Centertown | 54.1% | 33.4%(+20.7)#33 | 29.0%(+25.1)#2,452 |
| 34. | Stantonville | 53.4% | 33.4%(+20.0)#34 | 29.0%(+24.4)#2,585 |
| 35. | Whiteside | 53.4% | 33.4%(+20.0)#35 | 29.0%(+24.4)#2,589 |
| 36. | Grimsley | 53.2% | 33.4%(+19.8)#36 | 29.0%(+24.2)#2,623 |
| 37. | Pittman Center | 53.2% | 33.4%(+19.8)#37 | 29.0%(+24.2)#2,628 |
| 38. | Shackle Island | 52.5% | 33.4%(+19.1)#38 | 29.0%(+23.5)#2,763 |
| 39. | Harriman | 52.4% | 33.4%(+19.0)#39 | 29.0%(+23.4)#2,791 |
| 40. | Linden | 52.4% | 33.4%(+19.0)#40 | 29.0%(+23.4)#2,796 |
| 41. | Eastview | 52.4% | 33.4%(+19.0)#41 | 29.0%(+23.4)#2,800 |
| 42. | Lenox | 51.8% | 33.4%(+18.4)#42 | 29.0%(+22.8)#2,935 |
| 43. | Watauga | 51.7% | 33.4%(+18.3)#43 | 29.0%(+22.7)#2,947 |
| 44. | Philadelphia | 50.9% | 33.4%(+17.5)#44 | 29.0%(+21.9)#3,090 |
| 45. | Christiana | 50.7% | 33.4%(+17.3)#45 | 29.0%(+21.7)#3,121 |
| 46. | Coopertown | 50.7% | 33.4%(+17.3)#46 | 29.0%(+21.7)#3,123 |
| 47. | Coalmont | 50.6% | 33.4%(+17.2)#47 | 29.0%(+21.6)#3,150 |
| 48. | Cross Plains | 50.5% | 33.4%(+17.1)#48 | 29.0%(+21.5)#3,169 |
| 49. | Caryville | 50.2% | 33.4%(+16.8)#49 | 29.0%(+21.2)#3,220 |
| 50. | Waynesboro | 50.0% | 33.4%(+16.6)#50 | 29.0%(+21.0)#3,246 |
| 51. | Bon Air | 50.0% | 33.4%(+16.6)#51 | 29.0%(+21.0)#3,268 |
| 52. | Hillsboro | 50.0% | 33.4%(+16.6)#52 | 29.0%(+21.0)#3,279 |
| 53. | Munford | 49.9% | 33.4%(+16.5)#53 | 29.0%(+20.9)#3,429 |
| 54. | Wildwood | 49.4% | 33.4%(+16.0)#54 | 29.0%(+20.4)#3,515 |
| 55. | South Cleveland | 49.2% | 33.4%(+15.8)#55 | 29.0%(+20.2)#3,553 |
| 56. | Surgoinsville | 48.7% | 33.4%(+15.3)#56 | 29.0%(+19.7)#3,690 |
| 57. | Sardis | 48.7% | 33.4%(+15.3)#57 | 29.0%(+19.7)#3,703 |
| 58. | Strawberry Plains | 48.4% | 33.4%(+15.0)#58 | 29.0%(+19.4)#3,774 |
| 59. | Parker S Crossroads | 47.4% | 33.4%(+14.0)#59 | 29.0%(+18.4)#4,063 |
| 60. | Rockwood | 47.2% | 33.4%(+13.8)#60 | 29.0%(+18.2)#4,093 |
| 61. | Morrison | 47.1% | 33.4%(+13.7)#61 | 29.0%(+18.1)#4,146 |
| 62. | Piperton | 47.0% | 33.4%(+13.6)#62 | 29.0%(+18.0)#4,177 |
| 63. | Tracy City | 46.9% | 33.4%(+13.5)#63 | 29.0%(+17.9)#4,200 |
| 64. | Cornersville | 46.5% | 33.4%(+13.1)#64 | 29.0%(+17.5)#4,323 |
| 65. | Algood | 46.4% | 33.4%(+13.0)#65 | 29.0%(+17.4)#4,347 |
| 66. | Charleston | 46.4% | 33.4%(+13.0)#66 | 29.0%(+17.4)#4,365 |
| 67. | Falling Water | 46.3% | 33.4%(+12.9)#67 | 29.0%(+17.3)#4,396 |
| 68. | Ethridge | 46.2% | 33.4%(+12.8)#68 | 29.0%(+17.2)#4,431 |
| 69. | Kimball | 45.8% | 33.4%(+12.4)#69 | 29.0%(+16.8)#4,563 |
| 70. | New Hope | 45.4% | 33.4%(+12.0)#70 | 29.0%(+16.4)#4,726 |
| 71. | Clifton | 45.3% | 33.4%(+11.9)#71 | 29.0%(+16.3)#4,741 |
| 72. | Pine Crest | 45.1% | 33.4%(+11.7)#72 | 29.0%(+16.1)#4,811 |
| 73. | Rossville | 45.0% | 33.4%(+11.6)#73 | 29.0%(+16.0)#4,854 |
| 74. | Auburntown | 45.0% | 33.4%(+11.6)#74 | 29.0%(+16.0)#4,867 |
| 75. | Oliver Springs | 44.7% | 33.4%(+11.3)#75 | 29.0%(+15.7)#4,946 |
| 76. | Fairmount | 44.7% | 33.4%(+11.3)#76 | 29.0%(+15.7)#4,954 |
| 77. | Mcewen | 44.4% | 33.4%(+11.0)#77 | 29.0%(+15.4)#5,041 |
| 78. | Sullivan Gardens | 44.4% | 33.4%(+11.0)#78 | 29.0%(+15.4)#5,042 |
| 79. | Minor Hill | 44.0% | 33.4%(+10.6)#79 | 29.0%(+15.0)#5,226 |
| 80. | Winfield | 43.9% | 33.4%(+10.5)#80 | 29.0%(+14.9)#5,269 |
| 81. | Celina | 43.8% | 33.4%(+10.4)#81 | 29.0%(+14.8)#5,306 |
| 82. | Rutledge | 43.8% | 33.4%(+10.4)#82 | 29.0%(+14.8)#5,307 |
| 83. | Garland | 43.8% | 33.4%(+10.4)#83 | 29.0%(+14.8)#5,324 |
| 84. | Cottage Grove | 43.8% | 33.4%(+10.4)#84 | 29.0%(+14.8)#5,342 |
| 85. | Ocoee | 43.6% | 33.4%(+10.2)#85 | 29.0%(+14.6)#5,419 |
| 86. | Telford | 43.3% | 33.4%(+9.90)#86 | 29.0%(+14.3)#5,524 |
| 87. | Baneberry | 43.3% | 33.4%(+9.90)#87 | 29.0%(+14.3)#5,530 |
| 88. | Gilt Edge | 43.3% | 33.4%(+9.90)#88 | 29.0%(+14.3)#5,532 |
| 89. | Byrdstown | 43.1% | 33.4%(+9.70)#89 | 29.0%(+14.1)#5,599 |
| 90. | Eagleville | 43.0% | 33.4%(+9.60)#90 | 29.0%(+14.0)#5,643 |
| 91. | Toone | 42.9% | 33.4%(+9.50)#91 | 29.0%(+13.9)#5,678 |
| 92. | Spring City | 42.5% | 33.4%(+9.10)#92 | 29.0%(+13.5)#5,846 |
| 93. | Rockford | 42.4% | 33.4%(+9.00)#93 | 29.0%(+13.4)#5,892 |
| 94. | Medon | 42.3% | 33.4%(+8.90)#94 | 29.0%(+13.3)#5,957 |
| 95. | Cedar Hill | 42.2% | 33.4%(+8.80)#95 | 29.0%(+13.2)#5,999 |
| 96. | Burns | 42.1% | 33.4%(+8.70)#96 | 29.0%(+13.1)#6,023 |
| 97. | Gordonsville | 42.1% | 33.4%(+8.70)#97 | 29.0%(+13.1)#6,025 |
| 98. | Silerton | 42.1% | 33.4%(+8.70)#98 | 29.0%(+13.1)#6,054 |
| 99. | Brentwood | 42.0% | 33.4%(+8.60)#99 | 29.0%(+13.0)#6,061 |
| 100. | Forest Hills | 41.9% | 33.4%(+8.50)#100 | 29.0%(+12.9)#6,109 |
Common Questions
What are the Top 10 Cities with the Highest Percentage of Households With Three or more Vehicles in Tennessee?
Top 10 Cities with the Highest Percentage of Households With Three or more Vehicles in Tennessee are:
#1
100.0%
#2
81.6%
#3
80.0%
#4
67.2%
#5
66.3%
#6
63.8%
#7
59.9%
#8
56.4%
#9
55.2%
#10
55.0%
What city has the Highest Percentage of Households With Three or more Vehicles in Tennessee?
Fairfield has the Highest Percentage of Households With Three or more Vehicles in Tennessee with 100.0%.
What is the Percentage of Households With Three or more Vehicles in the State of Tennessee?
Percentage of Households With Three or more Vehicles in Tennessee is 33.4%.
What is the Percentage of Households With Three or more Vehicles in the United States?
Percentage of Households With Three or more Vehicles in the United States is 29.0%.