Cities with the Highest Percentage of Households With Three or more Vehicles in Pennsylvania
RELATED REPORTS & OPTIONS
Households with 3 or more Cars
Pennsylvania
Compare Cities
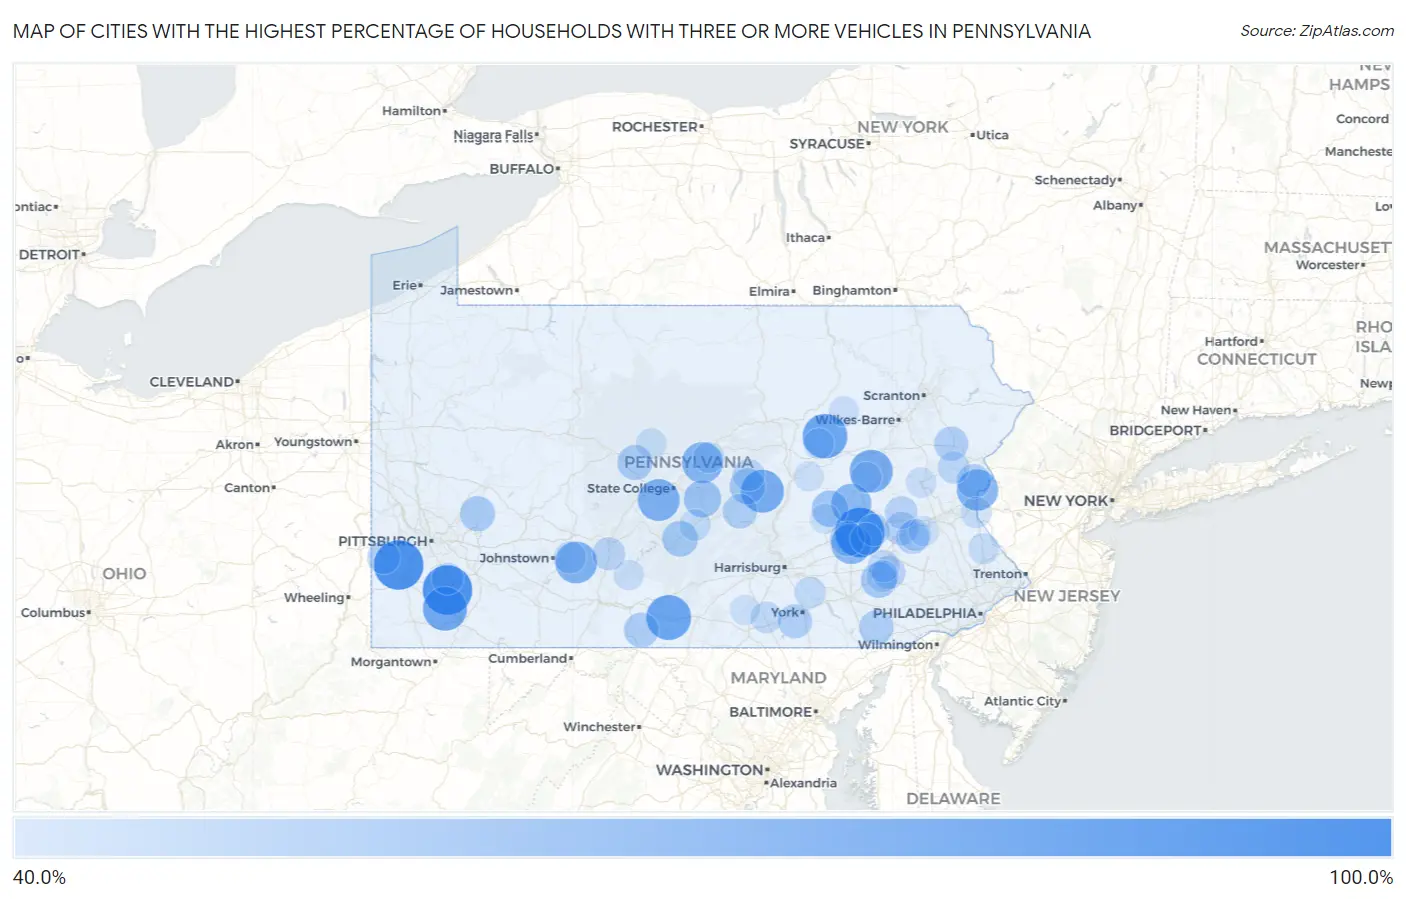
Map of Cities with the Highest Percentage of Households With Three or more Vehicles in Pennsylvania
0.0%
100.0%
Cities with the Highest Percentage of Households With Three or more Vehicles in Pennsylvania
| City | Housholds With 3+ Cars | vs State | vs National | |
| 1. | Schubert | 100.0% | 24.9%(+75.1)#1 | 29.0%(+71.0)#141 |
| 2. | Shellytown | 100.0% | 24.9%(+75.1)#2 | 29.0%(+71.0)#165 |
| 3. | Naomi | 100.0% | 24.9%(+75.1)#3 | 29.0%(+71.0)#170 |
| 4. | Peru | 100.0% | 24.9%(+75.1)#4 | 29.0%(+71.0)#206 |
| 5. | Geeseytown | 100.0% | 24.9%(+75.1)#5 | 29.0%(+71.0)#221 |
| 6. | Westland | 100.0% | 24.9%(+75.1)#6 | 29.0%(+71.0)#256 |
| 7. | Puzzletown | 89.3% | 24.9%(+64.4)#7 | 29.0%(+60.3)#424 |
| 8. | Fort Loudon | 87.3% | 24.9%(+62.4)#8 | 29.0%(+58.3)#455 |
| 9. | Iola | 86.7% | 24.9%(+61.8)#9 | 29.0%(+57.7)#463 |
| 10. | Allison | 85.2% | 24.9%(+60.3)#10 | 29.0%(+56.2)#486 |
| 11. | Oneida | 82.3% | 24.9%(+57.4)#11 | 29.0%(+53.3)#539 |
| 12. | Paxtonville | 82.1% | 24.9%(+57.2)#12 | 29.0%(+53.1)#542 |
| 13. | Baileyville | 79.2% | 24.9%(+54.3)#13 | 29.0%(+50.2)#605 |
| 14. | Dunlo | 78.9% | 24.9%(+54.0)#14 | 29.0%(+49.9)#614 |
| 15. | Martins Creek | 77.8% | 24.9%(+52.9)#15 | 29.0%(+48.8)#642 |
| 16. | Hublersburg | 76.7% | 24.9%(+51.8)#16 | 29.0%(+47.7)#672 |
| 17. | Larke | 76.2% | 24.9%(+51.3)#17 | 29.0%(+47.2)#697 |
| 18. | Mount Aetna | 75.0% | 24.9%(+50.1)#18 | 29.0%(+46.0)#724 |
| 19. | Jugtown | 75.0% | 24.9%(+50.1)#19 | 29.0%(+46.0)#751 |
| 20. | Forestville | 74.3% | 24.9%(+49.4)#20 | 29.0%(+45.3)#765 |
| 21. | Roots | 73.8% | 24.9%(+48.9)#21 | 29.0%(+44.8)#778 |
| 22. | Shelltown | 68.2% | 24.9%(+43.3)#22 | 29.0%(+39.2)#976 |
| 23. | Potlicker Flats | 66.7% | 24.9%(+41.8)#23 | 29.0%(+37.7)#1,059 |
| 24. | New Washington Borough | 66.7% | 24.9%(+41.8)#24 | 29.0%(+37.7)#1,085 |
| 25. | Fisherville | 66.7% | 24.9%(+41.8)#25 | 29.0%(+37.7)#1,086 |
| 26. | Hegins | 65.2% | 24.9%(+40.3)#26 | 29.0%(+36.2)#1,165 |
| 27. | Atkinson Mills | 63.0% | 24.9%(+38.1)#27 | 29.0%(+34.0)#1,329 |
| 28. | Fivepointville | 62.8% | 24.9%(+37.9)#28 | 29.0%(+33.8)#1,335 |
| 29. | Troxelville | 62.8% | 24.9%(+37.9)#29 | 29.0%(+33.8)#1,338 |
| 30. | Kiskimere | 61.4% | 24.9%(+36.5)#30 | 29.0%(+32.4)#1,475 |
| 31. | Allport | 61.2% | 24.9%(+36.3)#31 | 29.0%(+32.2)#1,492 |
| 32. | Royer | 61.1% | 24.9%(+36.2)#32 | 29.0%(+32.1)#1,516 |
| 33. | Needmore | 60.7% | 24.9%(+35.8)#33 | 29.0%(+31.7)#1,550 |
| 34. | Frystown | 60.5% | 24.9%(+35.6)#34 | 29.0%(+31.5)#1,571 |
| 35. | Sproul | 60.2% | 24.9%(+35.3)#35 | 29.0%(+31.2)#1,595 |
| 36. | Mcalisterville | 60.0% | 24.9%(+35.1)#36 | 29.0%(+31.0)#1,603 |
| 37. | Kirkwood | 59.6% | 24.9%(+34.7)#37 | 29.0%(+30.6)#1,684 |
| 38. | Emerald Lakes | 59.1% | 24.9%(+34.2)#38 | 29.0%(+30.1)#1,735 |
| 39. | Ackermanville | 59.1% | 24.9%(+34.2)#39 | 29.0%(+30.1)#1,746 |
| 40. | New Salem | 58.9% | 24.9%(+34.0)#40 | 29.0%(+29.9)#1,767 |
| 41. | Pinecroft | 57.8% | 24.9%(+32.9)#41 | 29.0%(+28.8)#1,899 |
| 42. | Virginville | 57.1% | 24.9%(+32.2)#42 | 29.0%(+28.1)#1,969 |
| 43. | Lewisberry Borough | 56.9% | 24.9%(+32.0)#43 | 29.0%(+27.9)#2,017 |
| 44. | Landingville Borough | 56.9% | 24.9%(+32.0)#44 | 29.0%(+27.9)#2,018 |
| 45. | Alleghenyville | 56.3% | 24.9%(+31.4)#45 | 29.0%(+27.3)#2,086 |
| 46. | Orangeville Borough | 56.3% | 24.9%(+31.4)#46 | 29.0%(+27.3)#2,089 |
| 47. | Dryville | 56.1% | 24.9%(+31.2)#47 | 29.0%(+27.1)#2,138 |
| 48. | Linds Crossing | 56.1% | 24.9%(+31.2)#48 | 29.0%(+27.1)#2,140 |
| 49. | Arendtsville Borough | 55.9% | 24.9%(+31.0)#49 | 29.0%(+26.9)#2,166 |
| 50. | Cross Creek | 55.8% | 24.9%(+30.9)#50 | 29.0%(+26.8)#2,181 |
| 51. | Prompton Borough | 55.7% | 24.9%(+30.8)#51 | 29.0%(+26.7)#2,190 |
| 52. | East Freedom | 55.6% | 24.9%(+30.7)#52 | 29.0%(+26.6)#2,199 |
| 53. | S N P J Borough | 55.6% | 24.9%(+30.7)#53 | 29.0%(+26.6)#2,229 |
| 54. | Kempton | 55.3% | 24.9%(+30.4)#54 | 29.0%(+26.3)#2,266 |
| 55. | Cove Forge | 54.5% | 24.9%(+29.6)#55 | 29.0%(+25.5)#2,377 |
| 56. | St Clairsville Borough | 54.5% | 24.9%(+29.6)#56 | 29.0%(+25.5)#2,385 |
| 57. | Trainer Borough | 54.3% | 24.9%(+29.4)#57 | 29.0%(+25.3)#2,405 |
| 58. | St Michael | 54.0% | 24.9%(+29.1)#58 | 29.0%(+25.0)#2,472 |
| 59. | Orrstown Borough | 53.9% | 24.9%(+29.0)#59 | 29.0%(+24.9)#2,482 |
| 60. | Stillwater Borough | 53.8% | 24.9%(+28.9)#60 | 29.0%(+24.8)#2,496 |
| 61. | Brodheadsville | 53.6% | 24.9%(+28.7)#61 | 29.0%(+24.6)#2,537 |
| 62. | Laurelton | 53.5% | 24.9%(+28.6)#62 | 29.0%(+24.5)#2,565 |
| 63. | Shartlesville | 53.5% | 24.9%(+28.6)#63 | 29.0%(+24.5)#2,566 |
| 64. | Maxatawny | 53.3% | 24.9%(+28.4)#64 | 29.0%(+24.3)#2,608 |
| 65. | Gouglersville | 53.2% | 24.9%(+28.3)#65 | 29.0%(+24.2)#2,626 |
| 66. | New Schaefferstown | 53.2% | 24.9%(+28.3)#66 | 29.0%(+24.2)#2,638 |
| 67. | Bowmansville | 53.0% | 24.9%(+28.1)#67 | 29.0%(+24.0)#2,659 |
| 68. | Webster | 52.9% | 24.9%(+28.0)#68 | 29.0%(+23.9)#2,702 |
| 69. | Bowers | 52.8% | 24.9%(+27.9)#69 | 29.0%(+23.8)#2,723 |
| 70. | Casselman Borough | 52.6% | 24.9%(+27.7)#70 | 29.0%(+23.6)#2,761 |
| 71. | Hampton | 52.4% | 24.9%(+27.5)#71 | 29.0%(+23.4)#2,794 |
| 72. | Bainbridge | 52.2% | 24.9%(+27.3)#72 | 29.0%(+23.2)#2,844 |
| 73. | Strodes Mills | 51.9% | 24.9%(+27.0)#73 | 29.0%(+22.9)#2,909 |
| 74. | Raubsville | 51.3% | 24.9%(+26.4)#74 | 29.0%(+22.3)#3,023 |
| 75. | Shirleysburg Borough | 51.2% | 24.9%(+26.3)#75 | 29.0%(+22.2)#3,047 |
| 76. | Robeson Extension | 51.1% | 24.9%(+26.2)#76 | 29.0%(+22.1)#3,066 |
| 77. | Nottingham | 50.8% | 24.9%(+25.9)#77 | 29.0%(+21.8)#3,105 |
| 78. | Georgetown Borough | 50.8% | 24.9%(+25.9)#78 | 29.0%(+21.8)#3,113 |
| 79. | Nittany | 50.7% | 24.9%(+25.8)#79 | 29.0%(+21.7)#3,130 |
| 80. | Pine Glen | 50.6% | 24.9%(+25.7)#80 | 29.0%(+21.6)#3,162 |
| 81. | Plumsteadville | 50.2% | 24.9%(+25.3)#81 | 29.0%(+21.2)#3,218 |
| 82. | Cokeburg Borough | 50.2% | 24.9%(+25.3)#82 | 29.0%(+21.2)#3,229 |
| 83. | Meshoppen Borough | 50.0% | 24.9%(+25.1)#83 | 29.0%(+21.0)#3,266 |
| 84. | Centerport Borough | 50.0% | 24.9%(+25.1)#84 | 29.0%(+21.0)#3,275 |
| 85. | Jerseytown | 50.0% | 24.9%(+25.1)#85 | 29.0%(+21.0)#3,316 |
| 86. | Brandonville | 50.0% | 24.9%(+25.1)#86 | 29.0%(+21.0)#3,318 |
| 87. | Rainsburg Borough | 50.0% | 24.9%(+25.1)#87 | 29.0%(+21.0)#3,329 |
| 88. | Coalmont Borough | 50.0% | 24.9%(+25.1)#88 | 29.0%(+21.0)#3,383 |
| 89. | Klahr | 50.0% | 24.9%(+25.1)#89 | 29.0%(+21.0)#3,397 |
| 90. | Martinsburg Junction | 50.0% | 24.9%(+25.1)#90 | 29.0%(+21.0)#3,408 |
| 91. | Weissport East | 49.4% | 24.9%(+24.5)#91 | 29.0%(+20.4)#3,514 |
| 92. | Stonerstown | 49.4% | 24.9%(+24.5)#92 | 29.0%(+20.4)#3,522 |
| 93. | Jamison City | 49.2% | 24.9%(+24.3)#93 | 29.0%(+20.2)#3,569 |
| 94. | Mertztown | 48.8% | 24.9%(+23.9)#94 | 29.0%(+19.8)#3,669 |
| 95. | Orwin | 48.8% | 24.9%(+23.9)#95 | 29.0%(+19.8)#3,675 |
| 96. | Aspers | 48.8% | 24.9%(+23.9)#96 | 29.0%(+19.8)#3,677 |
| 97. | Moose Run | 48.6% | 24.9%(+23.7)#97 | 29.0%(+19.6)#3,723 |
| 98. | Potters Mills | 48.6% | 24.9%(+23.7)#98 | 29.0%(+19.6)#3,724 |
| 99. | Sheakleyville Borough | 48.6% | 24.9%(+23.7)#99 | 29.0%(+19.6)#3,725 |
| 100. | Snydertown | 48.5% | 24.9%(+23.6)#100 | 29.0%(+19.5)#3,752 |
Common Questions
What are the Top 10 Cities with the Highest Percentage of Households With Three or more Vehicles in Pennsylvania?
Top 10 Cities with the Highest Percentage of Households With Three or more Vehicles in Pennsylvania are:
#1
100.0%
#2
100.0%
#3
100.0%
#4
87.3%
#5
86.7%
#6
85.2%
#7
82.3%
#8
82.1%
#9
79.2%
#10
78.9%
What city has the Highest Percentage of Households With Three or more Vehicles in Pennsylvania?
Schubert has the Highest Percentage of Households With Three or more Vehicles in Pennsylvania with 100.0%.
What is the Percentage of Households With Three or more Vehicles in the State of Pennsylvania?
Percentage of Households With Three or more Vehicles in Pennsylvania is 24.9%.
What is the Percentage of Households With Three or more Vehicles in the United States?
Percentage of Households With Three or more Vehicles in the United States is 29.0%.