Cities with the Highest Percentage of Households With Three or more Vehicles in Texas
RELATED REPORTS & OPTIONS
Households with 3 or more Cars
Texas
Compare Cities
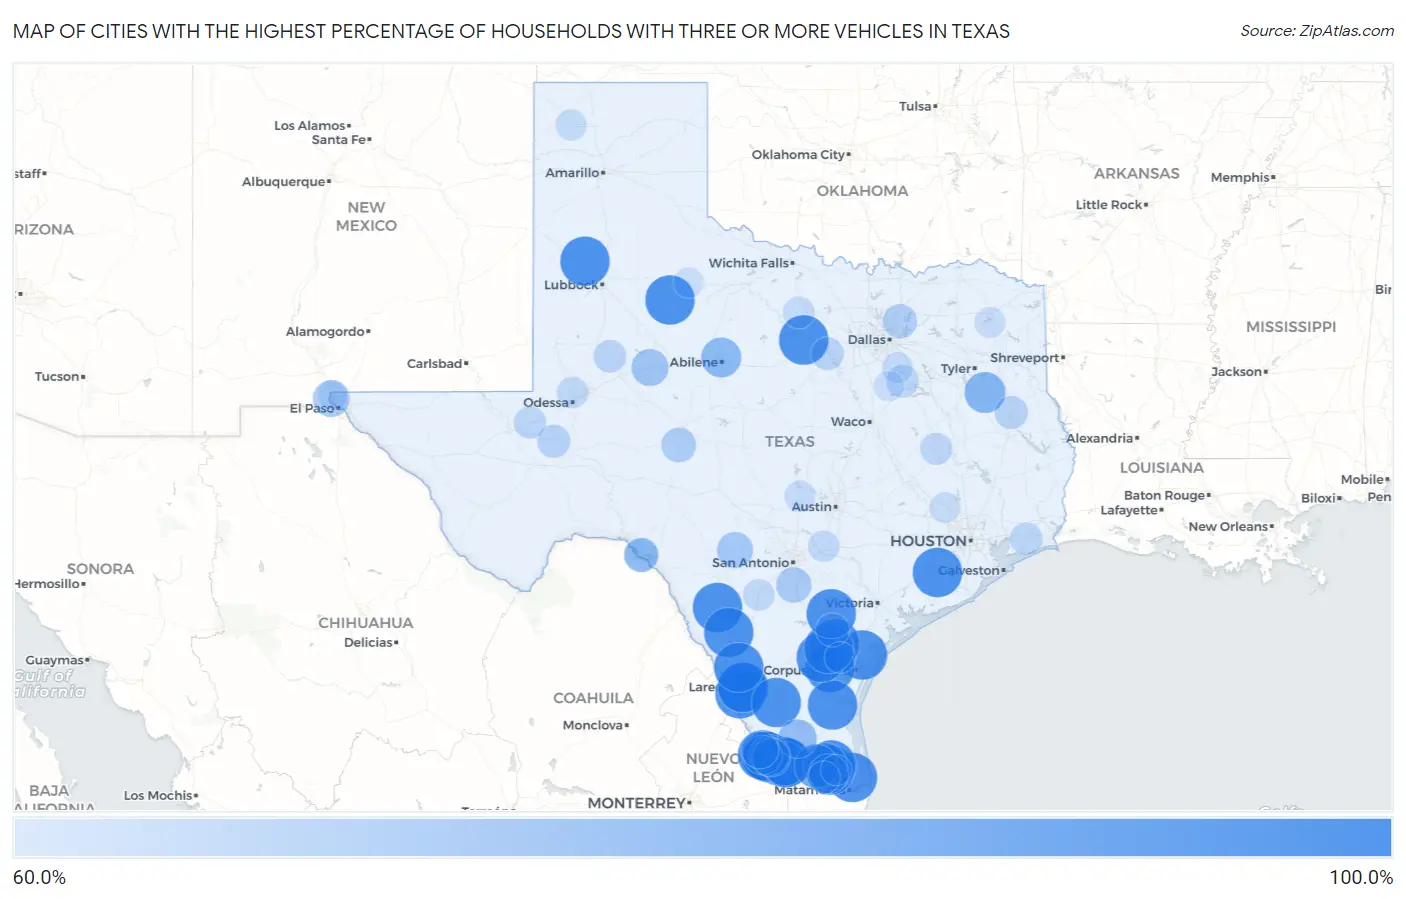
Map of Cities with the Highest Percentage of Households With Three or more Vehicles in Texas
0.0%
100.0%
Cities with the Highest Percentage of Households With Three or more Vehicles in Texas
| City | Housholds With 3+ Cars | vs State | vs National | |
| 1. | Flat | 100.0% | 30.3%(+69.7)#1 | 29.0%(+71.0)#12 |
| 2. | Orason | 100.0% | 30.3%(+69.7)#2 | 29.0%(+71.0)#14 |
| 3. | Olivia Lopez De Gutierrez | 100.0% | 30.3%(+69.7)#3 | 29.0%(+71.0)#22 |
| 4. | New Ulm | 100.0% | 30.3%(+69.7)#4 | 29.0%(+71.0)#31 |
| 5. | Tradewinds | 100.0% | 30.3%(+69.7)#5 | 29.0%(+71.0)#35 |
| 6. | J F Villareal | 100.0% | 30.3%(+69.7)#6 | 29.0%(+71.0)#40 |
| 7. | Ranchitos East | 100.0% | 30.3%(+69.7)#7 | 29.0%(+71.0)#43 |
| 8. | Pablo Pena | 100.0% | 30.3%(+69.7)#8 | 29.0%(+71.0)#45 |
| 9. | Tynan | 100.0% | 30.3%(+69.7)#9 | 29.0%(+71.0)#47 |
| 10. | Hilltop Cdp Starr County | 100.0% | 30.3%(+69.7)#10 | 29.0%(+71.0)#51 |
| 11. | Rancho Banquete | 100.0% | 30.3%(+69.7)#11 | 29.0%(+71.0)#61 |
| 12. | Shelbyville | 100.0% | 30.3%(+69.7)#12 | 29.0%(+71.0)#69 |
| 13. | La Presa | 100.0% | 30.3%(+69.7)#13 | 29.0%(+71.0)#70 |
| 14. | Tanquecitos South Acres | 100.0% | 30.3%(+69.7)#14 | 29.0%(+71.0)#71 |
| 15. | Loma Grande | 100.0% | 30.3%(+69.7)#15 | 29.0%(+71.0)#73 |
| 16. | Palo Pinto | 100.0% | 30.3%(+69.7)#17 | 29.0%(+71.0)#81 |
| 17. | La Rosita | 100.0% | 30.3%(+69.7)#18 | 29.0%(+71.0)#82 |
| 18. | Campo Verde | 100.0% | 30.3%(+69.7)#19 | 29.0%(+71.0)#83 |
| 19. | Thompsonville | 100.0% | 30.3%(+69.7)#20 | 29.0%(+71.0)#114 |
| 20. | Los Ebanos Cdp Starr County | 100.0% | 30.3%(+69.7)#21 | 29.0%(+71.0)#120 |
| 21. | Ratamosa | 100.0% | 30.3%(+69.7)#22 | 29.0%(+71.0)#122 |
| 22. | Chula Vista Cdp Cameron County | 100.0% | 30.3%(+69.7)#23 | 29.0%(+71.0)#130 |
| 23. | Sarita | 100.0% | 30.3%(+69.7)#24 | 29.0%(+71.0)#138 |
| 24. | Lelia Lake | 100.0% | 30.3%(+69.7)#25 | 29.0%(+71.0)#156 |
| 25. | Evergreen | 100.0% | 30.3%(+69.7)#26 | 29.0%(+71.0)#169 |
| 26. | Westdale | 100.0% | 30.3%(+69.7)#27 | 29.0%(+71.0)#174 |
| 27. | Pena | 100.0% | 30.3%(+69.7)#28 | 29.0%(+71.0)#189 |
| 28. | Brazos | 100.0% | 30.3%(+69.7)#29 | 29.0%(+71.0)#192 |
| 29. | Fluvanna | 100.0% | 30.3%(+69.7)#30 | 29.0%(+71.0)#195 |
| 30. | Catarina | 100.0% | 30.3%(+69.7)#31 | 29.0%(+71.0)#207 |
| 31. | Tierra Bonita | 100.0% | 30.3%(+69.7)#32 | 29.0%(+71.0)#210 |
| 32. | Sunset Cdp Starr County | 100.0% | 30.3%(+69.7)#33 | 29.0%(+71.0)#215 |
| 33. | Harwood | 100.0% | 30.3%(+69.7)#34 | 29.0%(+71.0)#232 |
| 34. | Spade | 100.0% | 30.3%(+69.7)#35 | 29.0%(+71.0)#258 |
| 35. | Brookston | 100.0% | 30.3%(+69.7)#36 | 29.0%(+71.0)#259 |
| 36. | Burlington | 100.0% | 30.3%(+69.7)#37 | 29.0%(+71.0)#261 |
| 37. | Acala | 100.0% | 30.3%(+69.7)#38 | 29.0%(+71.0)#278 |
| 38. | Farnsworth | 100.0% | 30.3%(+69.7)#39 | 29.0%(+71.0)#291 |
| 39. | Sunset Acres | 100.0% | 30.3%(+69.7)#40 | 29.0%(+71.0)#295 |
| 40. | Girard | 100.0% | 30.3%(+69.7)#41 | 29.0%(+71.0)#296 |
| 41. | La Paloma Ranchettes | 100.0% | 30.3%(+69.7)#42 | 29.0%(+71.0)#297 |
| 42. | Edgewater Estates | 100.0% | 30.3%(+69.7)#43 | 29.0%(+71.0)#309 |
| 43. | Tulsita | 100.0% | 30.3%(+69.7)#44 | 29.0%(+71.0)#328 |
| 44. | Mosheim | 100.0% | 30.3%(+69.7)#45 | 29.0%(+71.0)#333 |
| 45. | Tunis | 100.0% | 30.3%(+69.7)#46 | 29.0%(+71.0)#343 |
| 46. | Iago | 100.0% | 30.3%(+69.7)#47 | 29.0%(+71.0)#374 |
| 47. | Oklaunion | 89.3% | 30.3%(+59.0)#48 | 29.0%(+60.3)#425 |
| 48. | East Alto Bonito | 88.2% | 30.3%(+57.9)#49 | 29.0%(+59.2)#435 |
| 49. | Loving | 88.2% | 30.3%(+57.9)#50 | 29.0%(+59.2)#439 |
| 50. | Laguna Seca | 88.1% | 30.3%(+57.8)#51 | 29.0%(+59.1)#443 |
| 51. | Muniz | 87.8% | 30.3%(+57.5)#52 | 29.0%(+58.8)#448 |
| 52. | New Summerfield | 82.0% | 30.3%(+51.7)#53 | 29.0%(+53.0)#543 |
| 53. | La Esperanza | 80.0% | 30.3%(+49.7)#54 | 29.0%(+51.0)#575 |
| 54. | Bledsoe | 80.0% | 30.3%(+49.7)#55 | 29.0%(+51.0)#580 |
| 55. | Impact | 80.0% | 30.3%(+49.7)#56 | 29.0%(+51.0)#591 |
| 56. | Bixby | 79.1% | 30.3%(+48.8)#57 | 29.0%(+50.1)#608 |
| 57. | Tow | 78.9% | 30.3%(+48.6)#58 | 29.0%(+49.9)#615 |
| 58. | Miguel Barrera | 78.1% | 30.3%(+47.8)#59 | 29.0%(+49.1)#635 |
| 59. | Fronton Ranchettes | 77.8% | 30.3%(+47.5)#60 | 29.0%(+48.8)#644 |
| 60. | Delmita | 77.4% | 30.3%(+47.1)#61 | 29.0%(+48.4)#653 |
| 61. | Mi Ranchito Estate | 76.4% | 30.3%(+46.1)#62 | 29.0%(+47.4)#682 |
| 62. | Grangerland | 76.4% | 30.3%(+46.1)#63 | 29.0%(+47.4)#684 |
| 63. | Petty | 75.9% | 30.3%(+45.6)#64 | 29.0%(+46.9)#706 |
| 64. | Mccaulley | 75.0% | 30.3%(+44.7)#65 | 29.0%(+46.0)#740 |
| 65. | Westbrook | 73.8% | 30.3%(+43.5)#66 | 29.0%(+44.8)#777 |
| 66. | La Minita | 73.8% | 30.3%(+43.5)#67 | 29.0%(+44.8)#780 |
| 67. | Dennis | 73.5% | 30.3%(+43.2)#68 | 29.0%(+44.5)#788 |
| 68. | Prado Verde | 73.2% | 30.3%(+42.9)#69 | 29.0%(+44.2)#798 |
| 69. | Utopia | 72.0% | 30.3%(+41.7)#70 | 29.0%(+43.0)#829 |
| 70. | Leming | 70.7% | 30.3%(+40.4)#71 | 29.0%(+41.7)#866 |
| 71. | May | 69.8% | 30.3%(+39.5)#72 | 29.0%(+40.8)#901 |
| 72. | Christoval | 69.4% | 30.3%(+39.1)#73 | 29.0%(+40.4)#917 |
| 73. | Amistad | 69.4% | 30.3%(+39.1)#74 | 29.0%(+40.4)#919 |
| 74. | Parker | 68.3% | 30.3%(+38.0)#75 | 29.0%(+39.3)#968 |
| 75. | Box Canyon | 66.7% | 30.3%(+36.4)#76 | 29.0%(+37.7)#1,071 |
| 76. | Blue Berry Hill | 66.4% | 30.3%(+36.1)#77 | 29.0%(+37.4)#1,097 |
| 77. | Redfield | 66.3% | 30.3%(+36.0)#78 | 29.0%(+37.3)#1,106 |
| 78. | Imperial | 66.2% | 30.3%(+35.9)#79 | 29.0%(+37.2)#1,113 |
| 79. | Horseshoe Bend | 65.4% | 30.3%(+35.1)#80 | 29.0%(+36.4)#1,153 |
| 80. | Ackerly | 65.3% | 30.3%(+35.0)#81 | 29.0%(+36.3)#1,162 |
| 81. | Emhouse | 65.0% | 30.3%(+34.7)#82 | 29.0%(+36.0)#1,179 |
| 82. | Stowell | 64.9% | 30.3%(+34.6)#83 | 29.0%(+35.9)#1,183 |
| 83. | Progreso Lakes | 64.4% | 30.3%(+34.1)#84 | 29.0%(+35.4)#1,222 |
| 84. | Pyote | 64.3% | 30.3%(+34.0)#85 | 29.0%(+35.3)#1,230 |
| 85. | Leona | 64.0% | 30.3%(+33.7)#86 | 29.0%(+35.0)#1,250 |
| 86. | Gardendale | 63.2% | 30.3%(+32.9)#87 | 29.0%(+34.2)#1,299 |
| 87. | North Pearsall | 63.2% | 30.3%(+32.9)#88 | 29.0%(+34.2)#1,301 |
| 88. | Bryson | 63.0% | 30.3%(+32.7)#89 | 29.0%(+34.0)#1,322 |
| 89. | Geronimo | 62.8% | 30.3%(+32.5)#90 | 29.0%(+33.8)#1,336 |
| 90. | Hartley | 62.3% | 30.3%(+32.0)#91 | 29.0%(+33.3)#1,380 |
| 91. | Round Mountain | 62.1% | 30.3%(+31.8)#92 | 29.0%(+33.1)#1,413 |
| 92. | Garrett | 61.9% | 30.3%(+31.6)#93 | 29.0%(+32.9)#1,419 |
| 93. | Rocky Mound | 61.8% | 30.3%(+31.5)#94 | 29.0%(+32.8)#1,436 |
| 94. | Todd Mission | 61.5% | 30.3%(+31.2)#95 | 29.0%(+32.5)#1,460 |
| 95. | Edroy | 61.2% | 30.3%(+30.9)#96 | 29.0%(+32.2)#1,489 |
| 96. | Santo | 60.8% | 30.3%(+30.5)#97 | 29.0%(+31.8)#1,538 |
| 97. | Guthrie | 60.7% | 30.3%(+30.4)#98 | 29.0%(+31.7)#1,547 |
| 98. | Juarez | 60.6% | 30.3%(+30.3)#99 | 29.0%(+31.6)#1,554 |
| 99. | Vinton | 60.3% | 30.3%(+30.0)#100 | 29.0%(+31.3)#1,582 |
| 100. | Frost | 60.2% | 30.3%(+29.9)#101 | 29.0%(+31.2)#1,590 |
Common Questions
What are the Top 10 Cities with the Highest Percentage of Households With Three or more Vehicles in Texas?
Top 10 Cities with the Highest Percentage of Households With Three or more Vehicles in Texas are:
#1
100.0%
#2
100.0%
#3
100.0%
#4
100.0%
#5
100.0%
#6
100.0%
#7
100.0%
#8
100.0%
#9
100.0%
#10
100.0%
What city has the Highest Percentage of Households With Three or more Vehicles in Texas?
Orason has the Highest Percentage of Households With Three or more Vehicles in Texas with 100.0%.
What is the Percentage of Households With Three or more Vehicles in the State of Texas?
Percentage of Households With Three or more Vehicles in Texas is 30.3%.
What is the Percentage of Households With Three or more Vehicles in the United States?
Percentage of Households With Three or more Vehicles in the United States is 29.0%.