Cities with the Highest Percentage of Households With Three or more Vehicles in the United States
RELATED REPORTS & OPTIONS
Households with 3 or more Cars
United States
Compare Cities
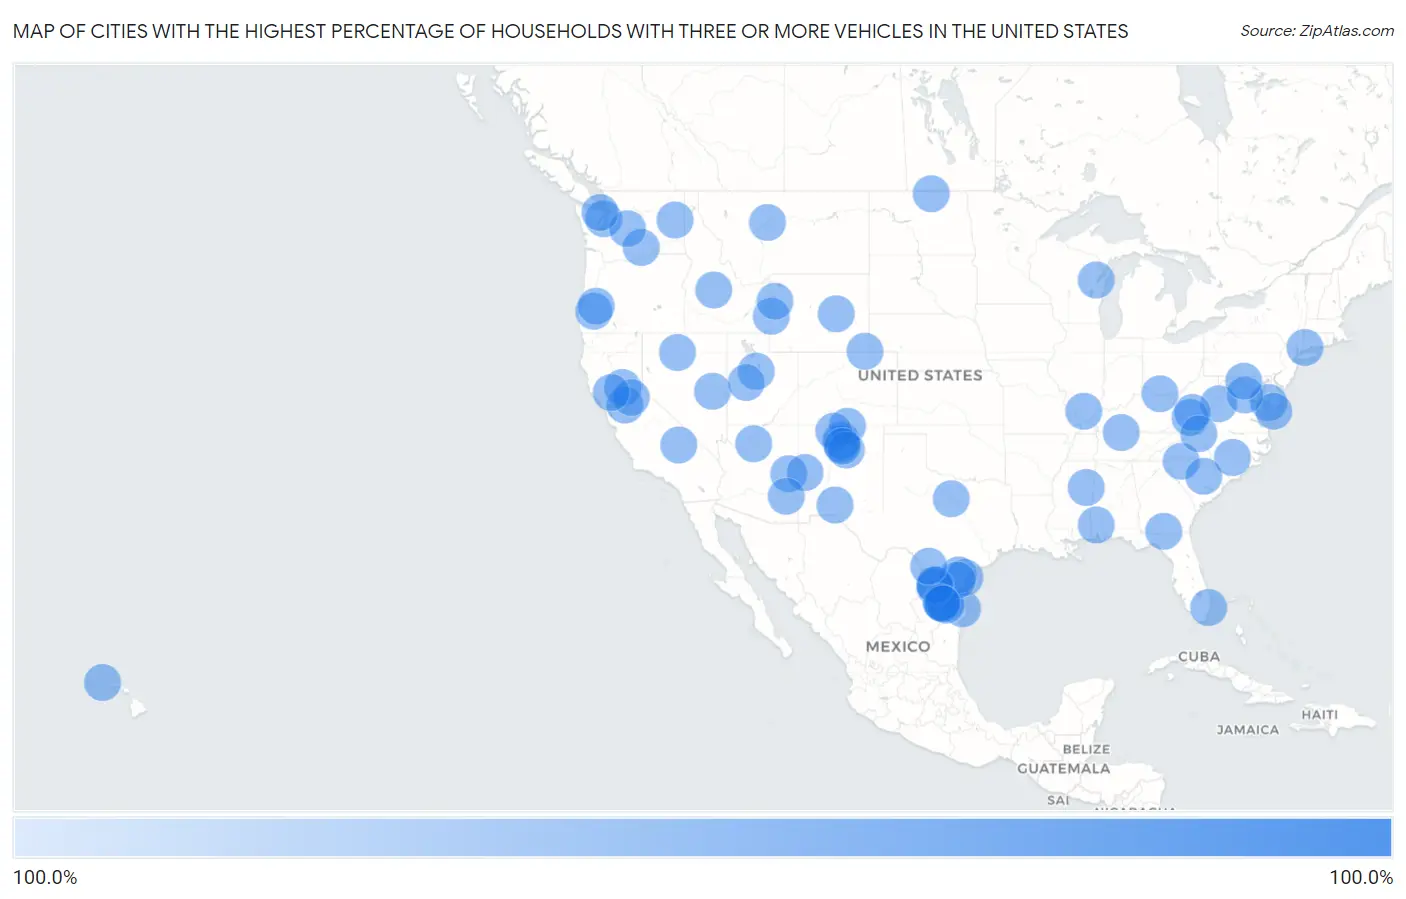
Map of Cities with the Highest Percentage of Households With Three or more Vehicles in the United States
0.0%
100.0%
Cities with the Highest Percentage of Households With Three or more Vehicles in the United States
| City | Housholds With 3+ Cars | vs State | vs National | |
| 1. | Hickam Housing | 100.0% | 31.4%(+68.6)#1 | 29.0%(+71.0)#1 |
| 2. | Bangor Base | 100.0% | 34.9%(+65.1)#1 | 29.0%(+71.0)#2 |
| 3. | Malmstrom Afb | 100.0% | 38.4%(+61.6)#1 | 29.0%(+71.0)#3 |
| 4. | Mississippi State | 100.0% | 31.5%(+68.5)#1 | 29.0%(+71.0)#4 |
| 5. | Fairchild Afb | 100.0% | 34.9%(+65.1)#2 | 29.0%(+71.0)#5 |
| 6. | Franklin Park | 100.0% | 20.9%(+79.1)#1 | 29.0%(+71.0)#6 |
| 7. | Remerton | 100.0% | 31.1%(+68.9)#1 | 29.0%(+71.0)#7 |
| 8. | White Sands | 100.0% | 31.6%(+68.4)#1 | 29.0%(+71.0)#8 |
| 9. | Beale Afb | 100.0% | 35.3%(+64.7)#1 | 29.0%(+71.0)#9 |
| 10. | Green Acres | 100.0% | 37.6%(+62.4)#1 | 29.0%(+71.0)#10 |
| 11. | Spivey S Corner | 100.0% | 32.5%(+67.5)#1 | 29.0%(+71.0)#11 |
| 12. | Flat | 100.0% | 30.3%(+69.7)#1 | 29.0%(+71.0)#12 |
| 13. | Victor | 100.0% | 35.3%(+64.7)#2 | 29.0%(+71.0)#13 |
| 14. | Orason | 100.0% | 30.3%(+69.7)#2 | 29.0%(+71.0)#14 |
| 15. | Lewis | 100.0% | 30.3%(+69.7)#1 | 29.0%(+71.0)#15 |
| 16. | Canova | 100.0% | 31.6%(+68.4)#2 | 29.0%(+71.0)#16 |
| 17. | Startex | 100.0% | 28.9%(+71.1)#1 | 29.0%(+71.0)#17 |
| 18. | Cannondale | 100.0% | 28.1%(+71.9)#1 | 29.0%(+71.0)#18 |
| 19. | Sequatchie | 100.0% | 33.4%(+66.6)#1 | 29.0%(+71.0)#19 |
| 20. | Edison | 100.0% | 35.3%(+64.7)#3 | 29.0%(+71.0)#20 |
| 21. | River Pines | 100.0% | 35.3%(+64.7)#4 | 29.0%(+71.0)#21 |
| 22. | Olivia Lopez De Gutierrez | 100.0% | 30.3%(+69.7)#3 | 29.0%(+71.0)#22 |
| 23. | Cuartelez | 100.0% | 31.6%(+68.4)#3 | 29.0%(+71.0)#23 |
| 24. | Costilla | 100.0% | 31.6%(+68.4)#4 | 29.0%(+71.0)#24 |
| 25. | Tierra Amarilla | 100.0% | 31.6%(+68.4)#5 | 29.0%(+71.0)#25 |
| 26. | Servia | 100.0% | 30.3%(+69.7)#2 | 29.0%(+71.0)#26 |
| 27. | Tusayan | 100.0% | 27.6%(+72.4)#1 | 29.0%(+71.0)#27 |
| 28. | Glacier Colony | 100.0% | 38.4%(+61.6)#2 | 29.0%(+71.0)#28 |
| 29. | Fort Wingate | 100.0% | 31.6%(+68.4)#6 | 29.0%(+71.0)#29 |
| 30. | Vibbard | 100.0% | 29.8%(+70.2)#1 | 29.0%(+71.0)#30 |
| 31. | New Ulm | 100.0% | 30.3%(+69.7)#4 | 29.0%(+71.0)#31 |
| 32. | Hortense | 100.0% | 31.1%(+68.9)#2 | 29.0%(+71.0)#32 |
| 33. | Nanticoke | 100.0% | 29.5%(+70.5)#1 | 29.0%(+71.0)#34 |
| 34. | Deerfield | 100.0% | 33.6%(+66.4)#1 | 29.0%(+71.0)#35 |
| 35. | Tradewinds | 100.0% | 30.3%(+69.7)#5 | 29.0%(+71.0)#36 |
| 36. | East Pecos | 100.0% | 31.6%(+68.4)#7 | 29.0%(+71.0)#37 |
| 37. | Outlook | 100.0% | 34.9%(+65.1)#3 | 29.0%(+71.0)#38 |
| 38. | Mongo | 100.0% | 30.3%(+69.7)#3 | 29.0%(+71.0)#39 |
| 39. | Vernon | 100.0% | 27.6%(+72.4)#2 | 29.0%(+71.0)#40 |
| 40. | J F Villareal | 100.0% | 30.3%(+69.7)#6 | 29.0%(+71.0)#41 |
| 41. | Gillisonville | 100.0% | 28.9%(+71.1)#2 | 29.0%(+71.0)#42 |
| 42. | Dillard | 100.0% | 31.7%(+68.3)#1 | 29.0%(+71.0)#43 |
| 43. | Ranchitos East | 100.0% | 30.3%(+69.7)#7 | 29.0%(+71.0)#44 |
| 44. | Elberta | 100.0% | 39.8%(+60.2)#1 | 29.0%(+71.0)#45 |
| 45. | Pablo Pena | 100.0% | 30.3%(+69.7)#8 | 29.0%(+71.0)#46 |
| 46. | Beverly | 100.0% | 34.9%(+65.1)#4 | 29.0%(+71.0)#47 |
| 47. | Tynan | 100.0% | 30.3%(+69.7)#9 | 29.0%(+71.0)#48 |
| 48. | Blooming Grove | 100.0% | 30.3%(+69.7)#4 | 29.0%(+71.0)#49 |
| 49. | Kimball | 100.0% | 25.8%(+74.2)#1 | 29.0%(+71.0)#50 |
| 50. | Hilltop Cdp Starr County | 100.0% | 30.3%(+69.7)#10 | 29.0%(+71.0)#51 |
| 51. | Sobieski | 100.0% | 28.0%(+72.0)#1 | 29.0%(+71.0)#52 |
| 52. | Bowdens | 100.0% | 32.5%(+67.5)#2 | 29.0%(+71.0)#53 |
| 53. | Rio | 100.0% | 23.1%(+76.9)#1 | 29.0%(+71.0)#54 |
| 54. | Fairfield | 100.0% | 33.4%(+66.6)#2 | 29.0%(+71.0)#55 |
| 55. | Skene | 100.0% | 31.5%(+68.5)#2 | 29.0%(+71.0)#56 |
| 56. | Rembert | 100.0% | 28.9%(+71.1)#3 | 29.0%(+71.0)#57 |
| 57. | Ronald | 100.0% | 34.9%(+65.1)#5 | 29.0%(+71.0)#58 |
| 58. | Quemado | 100.0% | 31.6%(+68.4)#8 | 29.0%(+71.0)#59 |
| 59. | Jackson Springs | 100.0% | 32.5%(+67.5)#3 | 29.0%(+71.0)#60 |
| 60. | Metompkin | 100.0% | 33.6%(+66.4)#2 | 29.0%(+71.0)#61 |
| 61. | Rancho Banquete | 100.0% | 30.3%(+69.7)#11 | 29.0%(+71.0)#62 |
| 62. | Mormon Lake | 100.0% | 27.6%(+72.4)#3 | 29.0%(+71.0)#63 |
| 63. | Grace | 100.0% | 31.5%(+68.5)#3 | 29.0%(+71.0)#64 |
| 64. | Bedford | 100.0% | 41.3%(+58.7)#1 | 29.0%(+71.0)#66 |
| 65. | Broadview | 100.0% | 31.6%(+68.4)#9 | 29.0%(+71.0)#67 |
| 66. | Stanley | 100.0% | 38.6%(+61.4)#1 | 29.0%(+71.0)#68 |
| 67. | Homewood Canyon | 100.0% | 35.3%(+64.7)#5 | 29.0%(+71.0)#69 |
| 68. | Shelbyville | 100.0% | 30.3%(+69.7)#12 | 29.0%(+71.0)#70 |
| 69. | Mcallister | 100.0% | 38.4%(+61.6)#3 | 29.0%(+71.0)#71 |
| 70. | La Presa | 100.0% | 30.3%(+69.7)#13 | 29.0%(+71.0)#72 |
| 71. | Tanquecitos South Acres | 100.0% | 30.3%(+69.7)#14 | 29.0%(+71.0)#73 |
| 72. | Mongaup Valley | 100.0% | 20.2%(+79.8)#1 | 29.0%(+71.0)#74 |
| 73. | Loma Grande | 100.0% | 30.3%(+69.7)#15 | 29.0%(+71.0)#75 |
| 74. | Lamington | 100.0% | 25.8%(+74.2)#1 | 29.0%(+71.0)#76 |
| 75. | Kelly | 100.0% | 41.3%(+58.7)#2 | 29.0%(+71.0)#77 |
| 76. | Serena | 100.0% | 24.5%(+75.5)#1 | 29.0%(+71.0)#78 |
| 77. | Fair Oaks | 100.0% | 31.7%(+68.3)#2 | 29.0%(+71.0)#79 |
| 78. | Preston | 100.0% | 29.9%(+70.1)#1 | 29.0%(+71.0)#80 |
| 79. | Homa Hills | 100.0% | 41.3%(+58.7)#3 | 29.0%(+71.0)#81 |
| 80. | Palo Pinto | 100.0% | 30.3%(+69.7)#17 | 29.0%(+71.0)#82 |
| 81. | La Rosita | 100.0% | 30.3%(+69.7)#18 | 29.0%(+71.0)#83 |
| 82. | Mount Taylor | 100.0% | 31.6%(+68.4)#10 | 29.0%(+71.0)#84 |
| 83. | Campo Verde | 100.0% | 30.3%(+69.7)#19 | 29.0%(+71.0)#85 |
| 84. | Guinda | 100.0% | 35.3%(+64.7)#6 | 29.0%(+71.0)#86 |
| 85. | Glen White | 100.0% | 25.8%(+74.2)#2 | 29.0%(+71.0)#87 |
| 86. | Millville | 100.0% | 30.3%(+69.7)#5 | 29.0%(+71.0)#88 |
| 87. | Catlett | 100.0% | 33.6%(+66.4)#3 | 29.0%(+71.0)#89 |
| 88. | Rio En Medio | 100.0% | 31.6%(+68.4)#11 | 29.0%(+71.0)#90 |
| 89. | Bentonville | 100.0% | 28.1%(+71.9)#1 | 29.0%(+71.0)#91 |
| 90. | Whiteash | 100.0% | 24.5%(+75.5)#2 | 29.0%(+71.0)#92 |
| 91. | Lowgap | 100.0% | 32.5%(+67.5)#4 | 29.0%(+71.0)#93 |
| 92. | Fairford | 100.0% | 33.3%(+66.7)#1 | 29.0%(+71.0)#94 |
| 93. | Sutherland | 100.0% | 39.8%(+60.2)#2 | 29.0%(+71.0)#95 |
| 94. | Bryce | 100.0% | 27.6%(+72.4)#4 | 29.0%(+71.0)#96 |
| 95. | Golconda | 100.0% | 29.9%(+70.1)#2 | 29.0%(+71.0)#97 |
| 96. | Mount Briar | 100.0% | 29.5%(+70.5)#2 | 29.0%(+71.0)#98 |
| 97. | Blyn | 100.0% | 34.9%(+65.1)#6 | 29.0%(+71.0)#99 |
| 98. | Carpenter | 100.0% | 41.3%(+58.7)#4 | 29.0%(+71.0)#100 |
| 99. | Medanales | 100.0% | 31.6%(+68.4)#12 | 29.0%(+71.0)#101 |
| 100. | Cats Bridge | 100.0% | 33.6%(+66.4)#4 | 29.0%(+71.0)#102 |
Common Questions
What are the Top 10 Cities with the Highest Percentage of Households With Three or more Vehicles in the United States?
Top 10 Cities with the Highest Percentage of Households With Three or more Vehicles in the United States are:
#1
100.0%
#2
100.0%
#3
100.0%
#4
100.0%
#5
100.0%
#6
100.0%
#7
100.0%
#8
100.0%
#9
100.0%
#10
100.0%
What city has the Highest Percentage of Households With Three or more Vehicles in the United States?
Hickam Housing has the Highest Percentage of Households With Three or more Vehicles in the United States with 100.0%.
What is the Percentage of Households With Three or more Vehicles in the United States?
Percentage of Households With Three or more Vehicles in the United States is 29.0%.