Cities with the Highest Percentage of Households With Three or more Vehicles in New York
RELATED REPORTS & OPTIONS
Households with 3 or more Cars
New York
Compare Cities
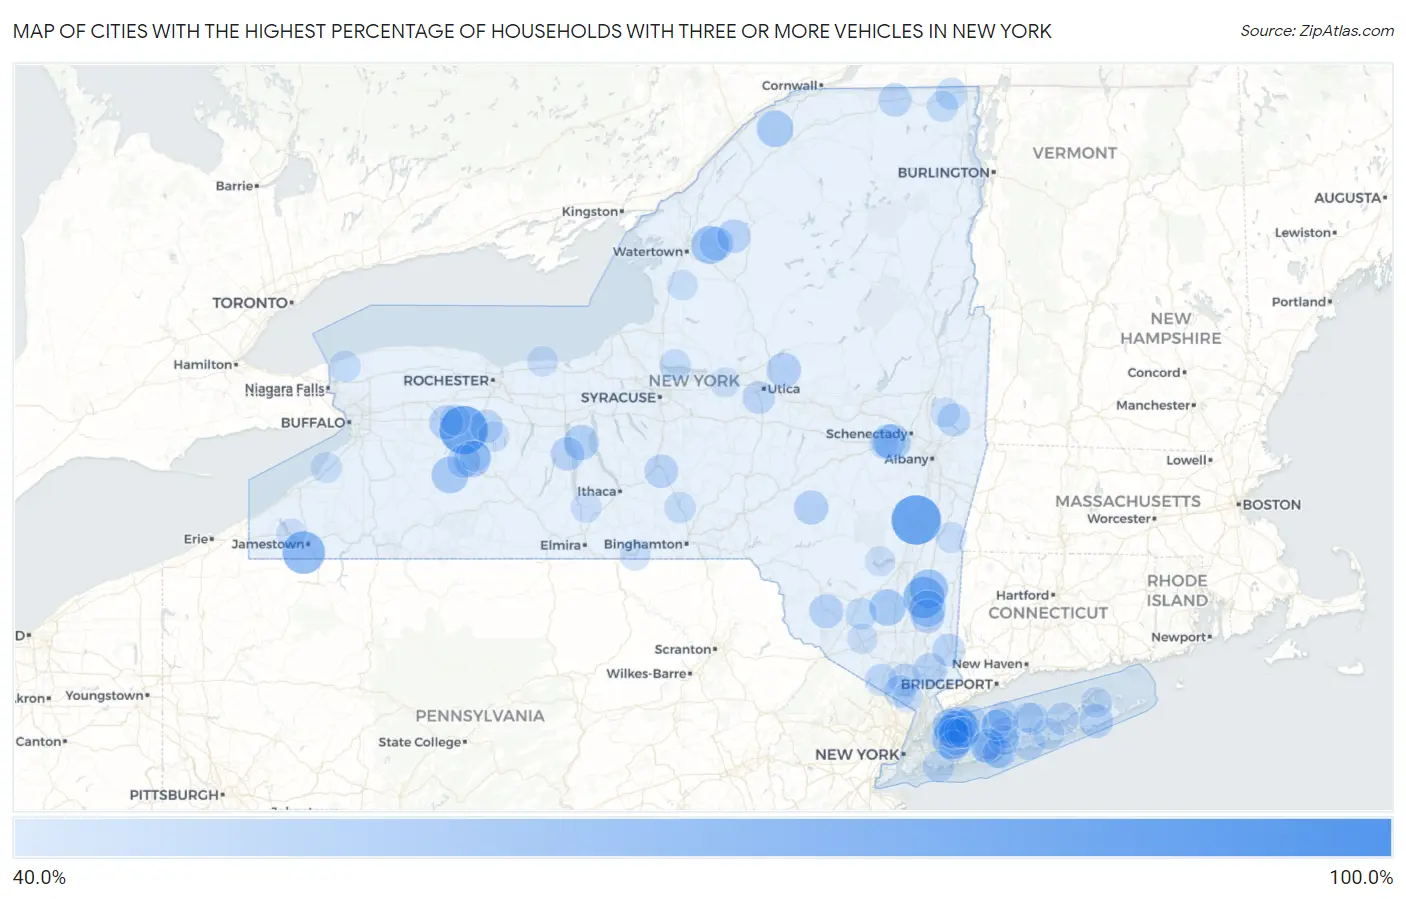
Map of Cities with the Highest Percentage of Households With Three or more Vehicles in New York
0.0%
100.0%
Cities with the Highest Percentage of Households With Three or more Vehicles in New York
| City | Housholds With 3+ Cars | vs State | vs National | |
| 1. | Mongaup Valley | 100.0% | 20.2%(+79.8)#1 | 29.0%(+71.0)#72 |
| 2. | Leeds | 85.7% | 20.2%(+65.5)#2 | 29.0%(+56.7)#474 |
| 3. | Retsof | 82.7% | 20.2%(+62.5)#3 | 29.0%(+53.7)#532 |
| 4. | Busti | 69.6% | 20.2%(+49.4)#4 | 29.0%(+40.6)#908 |
| 5. | North Granville | 66.3% | 20.2%(+46.1)#5 | 29.0%(+37.3)#1,103 |
| 6. | Pleasant Valley | 66.1% | 20.2%(+45.9)#6 | 29.0%(+37.1)#1,116 |
| 7. | Brookville | 64.7% | 20.2%(+44.5)#7 | 29.0%(+35.7)#1,190 |
| 8. | Salt Point | 60.5% | 20.2%(+40.3)#8 | 29.0%(+31.5)#1,566 |
| 9. | Cove Neck | 59.2% | 20.2%(+39.0)#9 | 29.0%(+30.2)#1,732 |
| 10. | Great Bend | 59.1% | 20.2%(+38.9)#10 | 29.0%(+30.1)#1,738 |
| 11. | Wells Bridge | 57.9% | 20.2%(+37.7)#11 | 29.0%(+28.9)#1,886 |
| 12. | Kysorville | 56.5% | 20.2%(+36.3)#12 | 29.0%(+27.5)#2,072 |
| 13. | Madrid | 56.1% | 20.2%(+35.9)#13 | 29.0%(+27.1)#2,125 |
| 14. | Salisbury Center | 56.1% | 20.2%(+35.9)#14 | 29.0%(+27.1)#2,134 |
| 15. | Hunt | 56.1% | 20.2%(+35.9)#15 | 29.0%(+27.1)#2,141 |
| 16. | Freedom Plains | 55.9% | 20.2%(+35.7)#16 | 29.0%(+26.9)#2,167 |
| 17. | Gardiner | 55.8% | 20.2%(+35.6)#17 | 29.0%(+26.8)#2,177 |
| 18. | Centre Island | 55.6% | 20.2%(+35.4)#18 | 29.0%(+26.6)#2,203 |
| 19. | Duane Lake | 55.4% | 20.2%(+35.2)#19 | 29.0%(+26.4)#2,251 |
| 20. | Head Of The Harbor | 54.7% | 20.2%(+34.5)#20 | 29.0%(+25.7)#2,351 |
| 21. | Muttontown | 54.6% | 20.2%(+34.4)#21 | 29.0%(+25.6)#2,361 |
| 22. | North Blenheim | 54.2% | 20.2%(+34.0)#22 | 29.0%(+25.2)#2,438 |
| 23. | Romulus | 52.6% | 20.2%(+32.4)#23 | 29.0%(+23.6)#2,751 |
| 24. | East Worcester | 52.1% | 20.2%(+31.9)#24 | 29.0%(+23.1)#2,876 |
| 25. | Lattingtown | 52.0% | 20.2%(+31.8)#25 | 29.0%(+23.0)#2,887 |
| 26. | North Bay Shore | 51.6% | 20.2%(+31.4)#26 | 29.0%(+22.6)#2,957 |
| 27. | Poland | 51.4% | 20.2%(+31.2)#27 | 29.0%(+22.4)#3,006 |
| 28. | Stittville | 51.4% | 20.2%(+31.2)#28 | 29.0%(+22.4)#3,009 |
| 29. | Bloomville | 50.8% | 20.2%(+30.6)#29 | 29.0%(+21.8)#3,112 |
| 30. | Oak Beach | 50.8% | 20.2%(+30.6)#30 | 29.0%(+21.8)#3,117 |
| 31. | Pavilion | 50.7% | 20.2%(+30.5)#31 | 29.0%(+21.7)#3,132 |
| 32. | Marcy | 50.5% | 20.2%(+30.3)#32 | 29.0%(+21.5)#3,174 |
| 33. | Duanesburg | 50.4% | 20.2%(+30.2)#33 | 29.0%(+21.4)#3,194 |
| 34. | Yorktown Heights | 50.2% | 20.2%(+30.0)#34 | 29.0%(+21.2)#3,221 |
| 35. | Monticello | 50.1% | 20.2%(+29.9)#35 | 29.0%(+21.1)#3,232 |
| 36. | Lake Huntington | 50.0% | 20.2%(+29.8)#36 | 29.0%(+21.0)#3,287 |
| 37. | Herrings | 50.0% | 20.2%(+29.8)#37 | 29.0%(+21.0)#3,391 |
| 38. | Bridgehampton | 49.8% | 20.2%(+29.6)#38 | 29.0%(+20.8)#3,443 |
| 39. | Hillside Lake | 49.7% | 20.2%(+29.5)#39 | 29.0%(+20.7)#3,468 |
| 40. | Mill Neck | 49.7% | 20.2%(+29.5)#40 | 29.0%(+20.7)#3,469 |
| 41. | Matinecock | 49.6% | 20.2%(+29.4)#41 | 29.0%(+20.6)#3,485 |
| 42. | Natural Bridge | 49.3% | 20.2%(+29.1)#42 | 29.0%(+20.3)#3,550 |
| 43. | Tuscarora | 49.2% | 20.2%(+29.0)#43 | 29.0%(+20.2)#3,574 |
| 44. | Blodgett Mills | 49.1% | 20.2%(+28.9)#44 | 29.0%(+20.1)#3,604 |
| 45. | Dresden | 49.0% | 20.2%(+28.8)#45 | 29.0%(+20.0)#3,623 |
| 46. | South Edmeston | 48.9% | 20.2%(+28.7)#46 | 29.0%(+19.9)#3,653 |
| 47. | Chateaugay | 48.5% | 20.2%(+28.3)#47 | 29.0%(+19.5)#3,747 |
| 48. | South Lima | 48.3% | 20.2%(+28.1)#48 | 29.0%(+19.3)#3,819 |
| 49. | Valley Falls | 48.0% | 20.2%(+27.8)#49 | 29.0%(+19.0)#3,891 |
| 50. | West Haverstraw | 47.5% | 20.2%(+27.3)#50 | 29.0%(+18.5)#4,021 |
| 51. | Brewster | 47.4% | 20.2%(+27.2)#51 | 29.0%(+18.4)#4,052 |
| 52. | Washington Mills | 47.2% | 20.2%(+27.0)#52 | 29.0%(+18.2)#4,101 |
| 53. | Aquebogue | 47.1% | 20.2%(+26.9)#53 | 29.0%(+18.1)#4,135 |
| 54. | South Lansing | 47.0% | 20.2%(+26.8)#54 | 29.0%(+18.0)#4,180 |
| 55. | Haines Falls | 46.9% | 20.2%(+26.7)#55 | 29.0%(+17.9)#4,212 |
| 56. | Tuxedo Park | 46.6% | 20.2%(+26.4)#56 | 29.0%(+17.6)#4,307 |
| 57. | Hillcrest | 46.5% | 20.2%(+26.3)#57 | 29.0%(+17.5)#4,315 |
| 58. | Great River | 46.4% | 20.2%(+26.2)#58 | 29.0%(+17.4)#4,351 |
| 59. | Brookhaven | 46.2% | 20.2%(+26.0)#59 | 29.0%(+17.2)#4,417 |
| 60. | East Shoreham | 46.1% | 20.2%(+25.9)#60 | 29.0%(+17.1)#4,471 |
| 61. | Eatons Neck | 45.8% | 20.2%(+25.6)#61 | 29.0%(+16.8)#4,565 |
| 62. | Walker Valley | 45.3% | 20.2%(+25.1)#62 | 29.0%(+16.3)#4,744 |
| 63. | Hewlett Bay Park | 45.1% | 20.2%(+24.9)#63 | 29.0%(+16.1)#4,827 |
| 64. | Mooers | 45.0% | 20.2%(+24.8)#64 | 29.0%(+16.0)#4,862 |
| 65. | Whitney Point | 44.8% | 20.2%(+24.6)#65 | 29.0%(+15.8)#4,921 |
| 66. | Eastport | 44.7% | 20.2%(+24.5)#66 | 29.0%(+15.7)#4,950 |
| 67. | Ransomville | 44.6% | 20.2%(+24.4)#67 | 29.0%(+15.6)#4,985 |
| 68. | Altona | 44.6% | 20.2%(+24.4)#68 | 29.0%(+15.6)#4,994 |
| 69. | Constantia | 44.3% | 20.2%(+24.1)#69 | 29.0%(+15.3)#5,106 |
| 70. | Brentwood | 44.2% | 20.2%(+24.0)#70 | 29.0%(+15.2)#5,125 |
| 71. | New Cassel | 43.9% | 20.2%(+23.7)#71 | 29.0%(+14.9)#5,253 |
| 72. | Vassar College | 43.9% | 20.2%(+23.7)#72 | 29.0%(+14.9)#5,259 |
| 73. | Shelter Island | 43.9% | 20.2%(+23.7)#73 | 29.0%(+14.9)#5,261 |
| 74. | Laurel Hollow | 43.9% | 20.2%(+23.7)#74 | 29.0%(+14.9)#5,263 |
| 75. | Hemlock | 43.9% | 20.2%(+23.7)#75 | 29.0%(+14.9)#5,273 |
| 76. | Farnham | 43.9% | 20.2%(+23.7)#76 | 29.0%(+14.9)#5,278 |
| 77. | Copake Lake | 43.8% | 20.2%(+23.6)#77 | 29.0%(+14.8)#5,313 |
| 78. | Linwood | 43.8% | 20.2%(+23.6)#78 | 29.0%(+14.8)#5,346 |
| 79. | Nichols | 43.7% | 20.2%(+23.5)#79 | 29.0%(+14.7)#5,373 |
| 80. | Lake Grove | 43.5% | 20.2%(+23.3)#80 | 29.0%(+14.5)#5,424 |
| 81. | Oyster Bay Cove | 43.3% | 20.2%(+23.1)#81 | 29.0%(+14.3)#5,514 |
| 82. | Groveland Station | 43.3% | 20.2%(+23.1)#82 | 29.0%(+14.3)#5,536 |
| 83. | Conesus | 43.3% | 20.2%(+23.1)#83 | 29.0%(+14.3)#5,542 |
| 84. | East Islip | 43.0% | 20.2%(+22.8)#84 | 29.0%(+14.0)#5,628 |
| 85. | Upper Brookville | 42.7% | 20.2%(+22.5)#85 | 29.0%(+13.7)#5,761 |
| 86. | Odessa | 42.7% | 20.2%(+22.5)#86 | 29.0%(+13.7)#5,770 |
| 87. | Pultneyville | 42.6% | 20.2%(+22.4)#87 | 29.0%(+13.6)#5,812 |
| 88. | Lorraine | 42.5% | 20.2%(+22.3)#88 | 29.0%(+13.5)#5,874 |
| 89. | Scotchtown | 42.4% | 20.2%(+22.2)#89 | 29.0%(+13.4)#5,878 |
| 90. | Bemus Point | 42.3% | 20.2%(+22.1)#90 | 29.0%(+13.3)#5,959 |
| 91. | Ronkonkoma | 42.2% | 20.2%(+22.0)#91 | 29.0%(+13.2)#5,973 |
| 92. | Baywood | 42.2% | 20.2%(+22.0)#92 | 29.0%(+13.2)#5,975 |
| 93. | Old Field | 42.2% | 20.2%(+22.0)#93 | 29.0%(+13.2)#5,985 |
| 94. | Shoreham | 42.2% | 20.2%(+22.0)#94 | 29.0%(+13.2)#5,989 |
| 95. | West Nyack | 42.0% | 20.2%(+21.8)#95 | 29.0%(+13.0)#6,068 |
| 96. | Shokan | 41.9% | 20.2%(+21.7)#96 | 29.0%(+12.9)#6,125 |
| 97. | Stillwater | 41.8% | 20.2%(+21.6)#97 | 29.0%(+12.8)#6,174 |
| 98. | Verona | 41.8% | 20.2%(+21.6)#98 | 29.0%(+12.8)#6,181 |
| 99. | Delanson | 41.7% | 20.2%(+21.5)#99 | 29.0%(+12.7)#6,252 |
| 100. | Nissequogue | 41.5% | 20.2%(+21.3)#100 | 29.0%(+12.5)#6,341 |
Common Questions
What are the Top 10 Cities with the Highest Percentage of Households With Three or more Vehicles in New York?
Top 10 Cities with the Highest Percentage of Households With Three or more Vehicles in New York are:
#1
85.7%
#2
82.7%
#3
69.6%
#4
66.1%
#5
64.7%
#6
60.5%
#7
59.2%
#8
59.1%
#9
56.5%
#10
56.1%
What city has the Highest Percentage of Households With Three or more Vehicles in New York?
Leeds has the Highest Percentage of Households With Three or more Vehicles in New York with 85.7%.
What is the Percentage of Households With Three or more Vehicles in the State of New York?
Percentage of Households With Three or more Vehicles in New York is 20.2%.
What is the Percentage of Households With Three or more Vehicles in the United States?
Percentage of Households With Three or more Vehicles in the United States is 29.0%.