Cities with the Highest Percentage of African Population in Illinois
RELATED REPORTS & OPTIONS
African
Illinois
Compare Cities
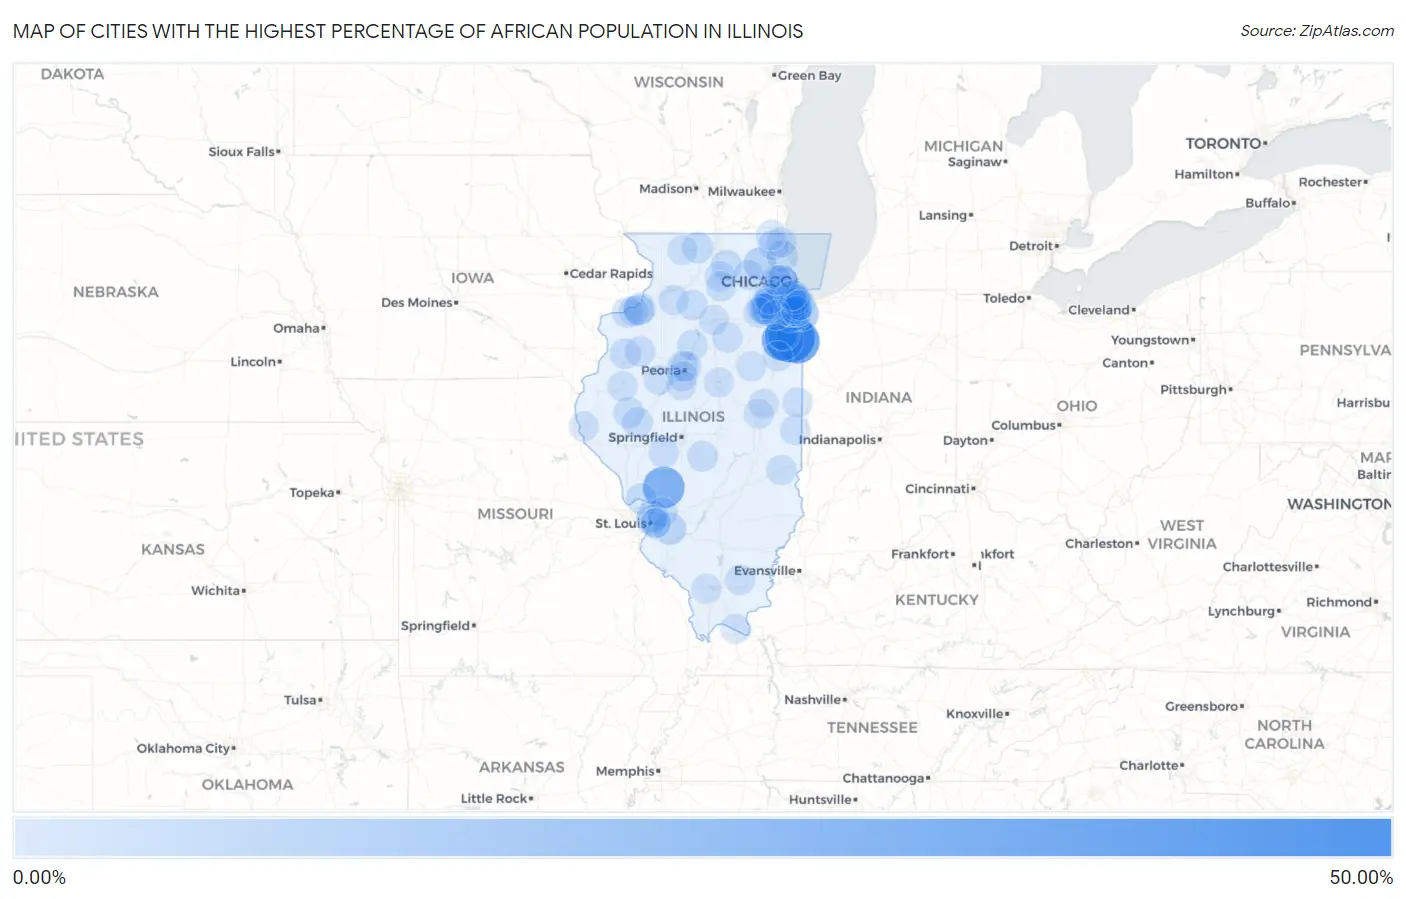
Map of Cities with the Highest Percentage of African Population in Illinois
0.00%
50.00%
Cities with the Highest Percentage of African Population in Illinois
| City | African | vs State | vs National | |
| 1. | Sun River Terrace | 41.76% | 0.56%(+41.2)#1 | 0.57%(+41.2)#8 |
| 2. | Hopkins Park | 30.36% | 0.56%(+29.8)#2 | 0.57%(+29.8)#12 |
| 3. | Royal Lakes | 24.91% | 0.56%(+24.3)#3 | 0.57%(+24.3)#20 |
| 4. | Kankakee | 24.38% | 0.56%(+23.8)#4 | 0.57%(+23.8)#21 |
| 5. | University Park | 12.90% | 0.56%(+12.3)#5 | 0.57%(+12.3)#66 |
| 6. | Willowbrook | 10.71% | 0.56%(+10.2)#6 | 0.57%(+10.1)#92 |
| 7. | Nachusa | 7.97% | 0.56%(+7.41)#7 | 0.57%(+7.41)#156 |
| 8. | Preston Heights | 7.00% | 0.56%(+6.44)#8 | 0.57%(+6.43)#196 |
| 9. | Monee | 6.95% | 0.56%(+6.39)#9 | 0.57%(+6.39)#199 |
| 10. | East Dundee | 6.27% | 0.56%(+5.71)#10 | 0.57%(+5.71)#224 |
| 11. | Hillside | 5.92% | 0.56%(+5.36)#11 | 0.57%(+5.35)#247 |
| 12. | Scott Afb | 5.59% | 0.56%(+5.03)#12 | 0.57%(+5.03)#274 |
| 13. | Frankfort Square | 5.03% | 0.56%(+4.47)#13 | 0.57%(+4.46)#320 |
| 14. | Bourbonnais | 4.64% | 0.56%(+4.08)#14 | 0.57%(+4.07)#361 |
| 15. | Flossmoor | 4.49% | 0.56%(+3.93)#15 | 0.57%(+3.92)#379 |
| 16. | Rockdale | 4.17% | 0.56%(+3.61)#16 | 0.57%(+3.60)#416 |
| 17. | Madison | 4.11% | 0.56%(+3.55)#17 | 0.57%(+3.54)#425 |
| 18. | East Moline | 4.10% | 0.56%(+3.54)#18 | 0.57%(+3.54)#426 |
| 19. | Rest Haven | 3.61% | 0.56%(+3.05)#19 | 0.57%(+3.04)#486 |
| 20. | Crete | 3.57% | 0.56%(+3.01)#20 | 0.57%(+3.01)#495 |
| 21. | Bannockburn | 3.38% | 0.56%(+2.82)#21 | 0.57%(+2.81)#526 |
| 22. | Bradley | 3.24% | 0.56%(+2.68)#22 | 0.57%(+2.68)#554 |
| 23. | Dolton | 3.15% | 0.56%(+2.59)#23 | 0.57%(+2.59)#581 |
| 24. | Pecatonica | 2.99% | 0.56%(+2.43)#24 | 0.57%(+2.42)#630 |
| 25. | East Hazel Crest | 2.98% | 0.56%(+2.42)#25 | 0.57%(+2.42)#632 |
| 26. | Country Club Hills | 2.96% | 0.56%(+2.40)#26 | 0.57%(+2.40)#642 |
| 27. | Park Forest | 2.85% | 0.56%(+2.29)#27 | 0.57%(+2.28)#672 |
| 28. | Ingalls Park | 2.74% | 0.56%(+2.18)#28 | 0.57%(+2.17)#703 |
| 29. | Joliet | 2.60% | 0.56%(+2.04)#29 | 0.57%(+2.04)#742 |
| 30. | Hazel Crest | 2.55% | 0.56%(+1.99)#30 | 0.57%(+1.98)#767 |
| 31. | Rock Island | 2.48% | 0.56%(+1.92)#31 | 0.57%(+1.91)#794 |
| 32. | Justice | 2.41% | 0.56%(+1.85)#32 | 0.57%(+1.85)#815 |
| 33. | Steger | 2.30% | 0.56%(+1.74)#33 | 0.57%(+1.74)#865 |
| 34. | Elsah | 2.23% | 0.56%(+1.67)#34 | 0.57%(+1.66)#895 |
| 35. | Rushville | 2.22% | 0.56%(+1.66)#35 | 0.57%(+1.66)#899 |
| 36. | Beardstown | 2.06% | 0.56%(+1.50)#36 | 0.57%(+1.49)#988 |
| 37. | Crest Hill | 2.03% | 0.56%(+1.47)#37 | 0.57%(+1.47)#1,003 |
| 38. | Bolingbrook | 1.98% | 0.56%(+1.42)#38 | 0.57%(+1.41)#1,039 |
| 39. | Taylorville | 1.93% | 0.56%(+1.37)#39 | 0.57%(+1.37)#1,066 |
| 40. | Peoria | 1.93% | 0.56%(+1.37)#40 | 0.57%(+1.37)#1,067 |
| 41. | Monmouth | 1.92% | 0.56%(+1.36)#41 | 0.57%(+1.35)#1,083 |
| 42. | Calumet Park | 1.89% | 0.56%(+1.33)#42 | 0.57%(+1.33)#1,096 |
| 43. | Kirkland | 1.88% | 0.56%(+1.31)#43 | 0.57%(+1.31)#1,106 |
| 44. | Silvis | 1.85% | 0.56%(+1.29)#44 | 0.57%(+1.29)#1,118 |
| 45. | Frankfort | 1.83% | 0.56%(+1.27)#45 | 0.57%(+1.26)#1,133 |
| 46. | Creston | 1.81% | 0.56%(+1.24)#46 | 0.57%(+1.24)#1,142 |
| 47. | Olympia Fields | 1.79% | 0.56%(+1.23)#47 | 0.57%(+1.22)#1,155 |
| 48. | Phoenix | 1.72% | 0.56%(+1.16)#48 | 0.57%(+1.16)#1,204 |
| 49. | Grayslake | 1.70% | 0.56%(+1.14)#49 | 0.57%(+1.14)#1,223 |
| 50. | Crystal Lawns | 1.68% | 0.56%(+1.12)#50 | 0.57%(+1.11)#1,245 |
| 51. | Galesburg | 1.67% | 0.56%(+1.11)#51 | 0.57%(+1.11)#1,247 |
| 52. | Sparland | 1.67% | 0.56%(+1.11)#52 | 0.57%(+1.10)#1,257 |
| 53. | Broadview | 1.66% | 0.56%(+1.10)#53 | 0.57%(+1.09)#1,262 |
| 54. | Ohio | 1.61% | 0.56%(+1.04)#54 | 0.57%(+1.04)#1,321 |
| 55. | Fairmont | 1.54% | 0.56%(+0.981)#55 | 0.57%(+0.976)#1,367 |
| 56. | Lee | 1.54% | 0.56%(+0.978)#56 | 0.57%(+0.973)#1,370 |
| 57. | Peoria Heights | 1.48% | 0.56%(+0.916)#57 | 0.57%(+0.912)#1,436 |
| 58. | Tampico | 1.48% | 0.56%(+0.916)#58 | 0.57%(+0.911)#1,437 |
| 59. | Streator | 1.47% | 0.56%(+0.913)#59 | 0.57%(+0.909)#1,440 |
| 60. | Glen Carbon | 1.46% | 0.56%(+0.904)#60 | 0.57%(+0.899)#1,459 |
| 61. | Richton Park | 1.46% | 0.56%(+0.901)#61 | 0.57%(+0.897)#1,462 |
| 62. | Venice | 1.42% | 0.56%(+0.858)#62 | 0.57%(+0.853)#1,516 |
| 63. | Chicago Heights | 1.40% | 0.56%(+0.835)#63 | 0.57%(+0.831)#1,546 |
| 64. | South Pekin | 1.40% | 0.56%(+0.835)#64 | 0.57%(+0.830)#1,547 |
| 65. | Shorewood | 1.39% | 0.56%(+0.831)#65 | 0.57%(+0.826)#1,557 |
| 66. | Minooka | 1.37% | 0.56%(+0.812)#66 | 0.57%(+0.807)#1,572 |
| 67. | Lily Lake | 1.37% | 0.56%(+0.806)#67 | 0.57%(+0.802)#1,582 |
| 68. | Galatia | 1.35% | 0.56%(+0.788)#68 | 0.57%(+0.783)#1,602 |
| 69. | Waverly | 1.27% | 0.56%(+0.709)#69 | 0.57%(+0.704)#1,726 |
| 70. | Ridge Farm | 1.19% | 0.56%(+0.626)#70 | 0.57%(+0.621)#1,826 |
| 71. | Waukegan | 1.19% | 0.56%(+0.625)#71 | 0.57%(+0.620)#1,828 |
| 72. | Bismarck | 1.18% | 0.56%(+0.624)#72 | 0.57%(+0.619)#1,831 |
| 73. | Romeoville | 1.18% | 0.56%(+0.623)#73 | 0.57%(+0.618)#1,832 |
| 74. | Martinsville | 1.17% | 0.56%(+0.605)#74 | 0.57%(+0.600)#1,858 |
| 75. | East St Louis | 1.12% | 0.56%(+0.557)#75 | 0.57%(+0.552)#1,937 |
| 76. | Washington Park | 1.09% | 0.56%(+0.529)#76 | 0.57%(+0.524)#1,983 |
| 77. | Thomasboro | 1.08% | 0.56%(+0.515)#77 | 0.57%(+0.510)#2,009 |
| 78. | Macomb | 1.06% | 0.56%(+0.498)#78 | 0.57%(+0.493)#2,039 |
| 79. | Canton | 1.05% | 0.56%(+0.493)#79 | 0.57%(+0.488)#2,046 |
| 80. | North Pekin | 1.05% | 0.56%(+0.487)#80 | 0.57%(+0.483)#2,055 |
| 81. | Alsip | 1.00% | 0.56%(+0.436)#81 | 0.57%(+0.431)#2,141 |
| 82. | Lasalle | 0.99% | 0.56%(+0.433)#82 | 0.57%(+0.428)#2,151 |
| 83. | Forrest | 0.98% | 0.56%(+0.421)#83 | 0.57%(+0.416)#2,168 |
| 84. | Quincy | 0.98% | 0.56%(+0.418)#84 | 0.57%(+0.413)#2,179 |
| 85. | Glenwood | 0.97% | 0.56%(+0.411)#85 | 0.57%(+0.406)#2,191 |
| 86. | Ashkum | 0.97% | 0.56%(+0.405)#86 | 0.57%(+0.401)#2,203 |
| 87. | South Chicago Heights | 0.95% | 0.56%(+0.393)#87 | 0.57%(+0.388)#2,226 |
| 88. | Riverdale | 0.95% | 0.56%(+0.389)#88 | 0.57%(+0.384)#2,235 |
| 89. | Lansing | 0.94% | 0.56%(+0.383)#89 | 0.57%(+0.378)#2,243 |
| 90. | Manhattan | 0.94% | 0.56%(+0.378)#90 | 0.57%(+0.373)#2,257 |
| 91. | Champaign | 0.93% | 0.56%(+0.366)#91 | 0.57%(+0.361)#2,287 |
| 92. | Carbondale | 0.92% | 0.56%(+0.360)#92 | 0.57%(+0.356)#2,307 |
| 93. | Antioch | 0.92% | 0.56%(+0.357)#93 | 0.57%(+0.352)#2,312 |
| 94. | Normal | 0.91% | 0.56%(+0.350)#94 | 0.57%(+0.345)#2,322 |
| 95. | Moline | 0.91% | 0.56%(+0.349)#95 | 0.57%(+0.344)#2,326 |
| 96. | Freeport | 0.88% | 0.56%(+0.323)#96 | 0.57%(+0.318)#2,376 |
| 97. | Bellwood | 0.82% | 0.56%(+0.261)#97 | 0.57%(+0.257)#2,526 |
| 98. | Metropolis | 0.80% | 0.56%(+0.244)#98 | 0.57%(+0.240)#2,569 |
| 99. | Villa Park | 0.80% | 0.56%(+0.235)#99 | 0.57%(+0.230)#2,599 |
| 100. | Merrionette Park | 0.79% | 0.56%(+0.234)#100 | 0.57%(+0.229)#2,602 |
Common Questions
What are the Top 10 Cities with the Highest Percentage of African Population in Illinois?
Top 10 Cities with the Highest Percentage of African Population in Illinois are:
#1
41.76%
#2
30.36%
#3
24.91%
#4
24.38%
#5
12.90%
#6
10.71%
#7
7.00%
#8
6.95%
#9
6.27%
#10
5.92%
What city has the Highest Percentage of African Population in Illinois?
Sun River Terrace has the Highest Percentage of African Population in Illinois with 41.76%.
What is the Percentage of African Population in the State of Illinois?
Percentage of African Population in Illinois is 0.56%.
What is the Percentage of African Population in the United States?
Percentage of African Population in the United States is 0.57%.