Angwin, CA Map & Demographics
Angwin Map
Angwin Overview
$41,599
PER CAPITA INCOME
$133,438
AVG FAMILY INCOME
$117,813
AVG HOUSEHOLD INCOME
0.43
INEQUALITY / GINI INDEX
2,731
TOTAL POPULATION
1,476
MALE POPULATION
1,255
FEMALE POPULATION
117.61
MALES / 100 FEMALES
85.03
FEMALES / 100 MALES
24.7
MEDIAN AGE
3.0
AVG FAMILY SIZE
2.4
AVG HOUSEHOLD SIZE
1,504
LABOR FORCE [ PEOPLE ]
62.7%
PERCENT IN LABOR FORCE
5.8%
UNEMPLOYMENT RATE
Angwin Zip Codes
Angwin Area Codes
Income in Angwin
Income Overview in Angwin
Per Capita Income in Angwin is $41,599, while median incomes of families and households are $133,438 and $117,813 respectively.
| Characteristic | Number | Measure |
| Per Capita Income | 2,731 | $41,599 |
| Median Family Income | 430 | $133,438 |
| Mean Family Income | 430 | $166,103 |
| Median Household Income | 741 | $117,813 |
| Mean Household Income | 741 | $141,944 |
| Income Deficit | 430 | $0 |
| Wage / Income Gap (%) | 2,731 | 0.00% |
| Wage / Income Gap ($) | 2,731 | 100.00¢ per $1 |
| Gini / Inequality Index | 2,731 | 0.43 |
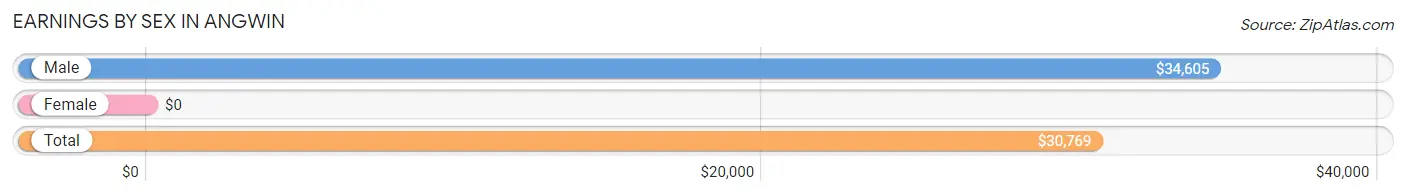
Earnings by Sex in Angwin
| Sex | Number | Average Earnings |
| Male | 992 (58.2%) | $34,605 |
| Female | 712 (41.8%) | $0 |
| Total | 1,704 (100.0%) | $30,769 |
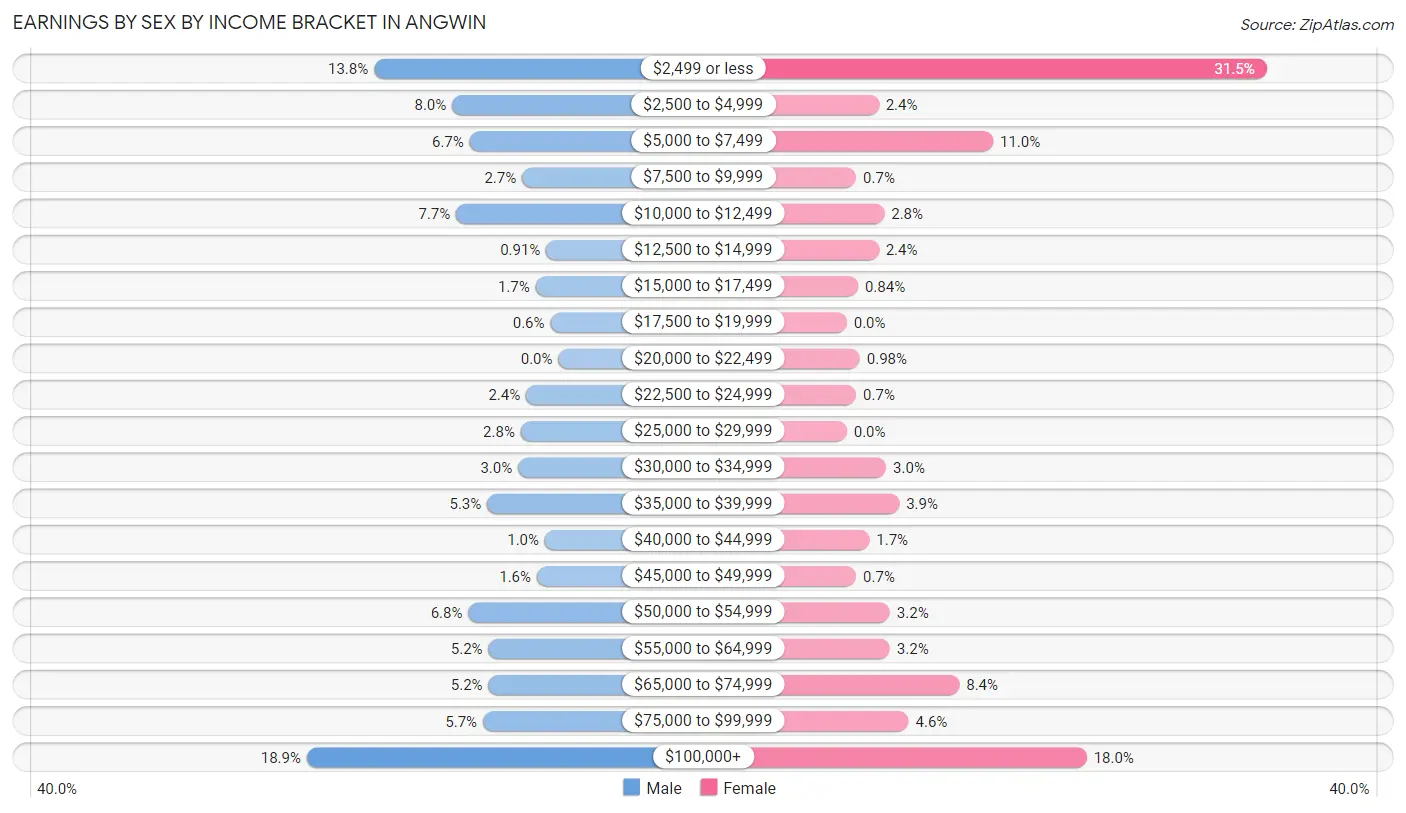
Earnings by Sex by Income Bracket in Angwin
The most common earnings brackets in Angwin are $100,000+ for men (187 | 18.9%) and $2,499 or less for women (224 | 31.5%).
| Income | Male | Female |
| $2,499 or less | 137 (13.8%) | 224 (31.5%) |
| $2,500 to $4,999 | 79 (8.0%) | 17 (2.4%) |
| $5,000 to $7,499 | 66 (6.7%) | 78 (11.0%) |
| $7,500 to $9,999 | 27 (2.7%) | 5 (0.7%) |
| $10,000 to $12,499 | 76 (7.7%) | 20 (2.8%) |
| $12,500 to $14,999 | 9 (0.9%) | 17 (2.4%) |
| $15,000 to $17,499 | 17 (1.7%) | 6 (0.8%) |
| $17,500 to $19,999 | 6 (0.6%) | 0 (0.0%) |
| $20,000 to $22,499 | 0 (0.0%) | 7 (1.0%) |
| $22,500 to $24,999 | 24 (2.4%) | 5 (0.7%) |
| $25,000 to $29,999 | 28 (2.8%) | 0 (0.0%) |
| $30,000 to $34,999 | 30 (3.0%) | 21 (2.9%) |
| $35,000 to $39,999 | 53 (5.3%) | 28 (3.9%) |
| $40,000 to $44,999 | 10 (1.0%) | 12 (1.7%) |
| $45,000 to $49,999 | 16 (1.6%) | 5 (0.7%) |
| $50,000 to $54,999 | 67 (6.8%) | 23 (3.2%) |
| $55,000 to $64,999 | 52 (5.2%) | 23 (3.2%) |
| $65,000 to $74,999 | 52 (5.2%) | 60 (8.4%) |
| $75,000 to $99,999 | 56 (5.7%) | 33 (4.6%) |
| $100,000+ | 187 (18.9%) | 128 (18.0%) |
| Total | 992 (100.0%) | 712 (100.0%) |
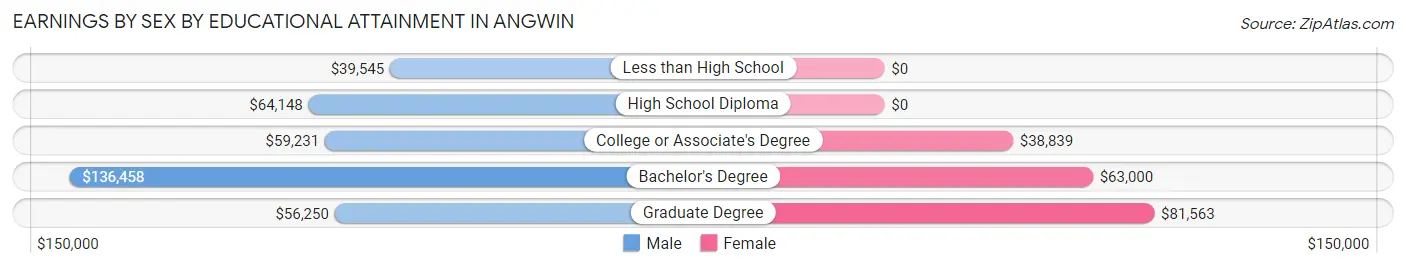
Earnings by Sex by Educational Attainment in Angwin
Average earnings in Angwin are $64,318 for men and $68,833 for women, a difference of 6.6%. Men with an educational attainment of bachelor's degree enjoy the highest average annual earnings of $136,458, while those with less than high school education earn the least with $39,545. Women with an educational attainment of graduate degree earn the most with the average annual earnings of $81,563, while those with college or associate's degree education have the smallest earnings of $38,839.
| Educational Attainment | Male Income | Female Income |
| Less than High School | $39,545 | $0 |
| High School Diploma | $64,148 | $0 |
| College or Associate's Degree | $59,231 | $38,839 |
| Bachelor's Degree | $136,458 | $63,000 |
| Graduate Degree | $56,250 | $81,563 |
| Total | $64,318 | $68,833 |
Family Income in Angwin
Family Income Brackets in Angwin
According to the Angwin family income data, there are 146 families falling into the $100,000 to $149,999 income range, which is the most common income bracket and makes up 34.0% of all families.
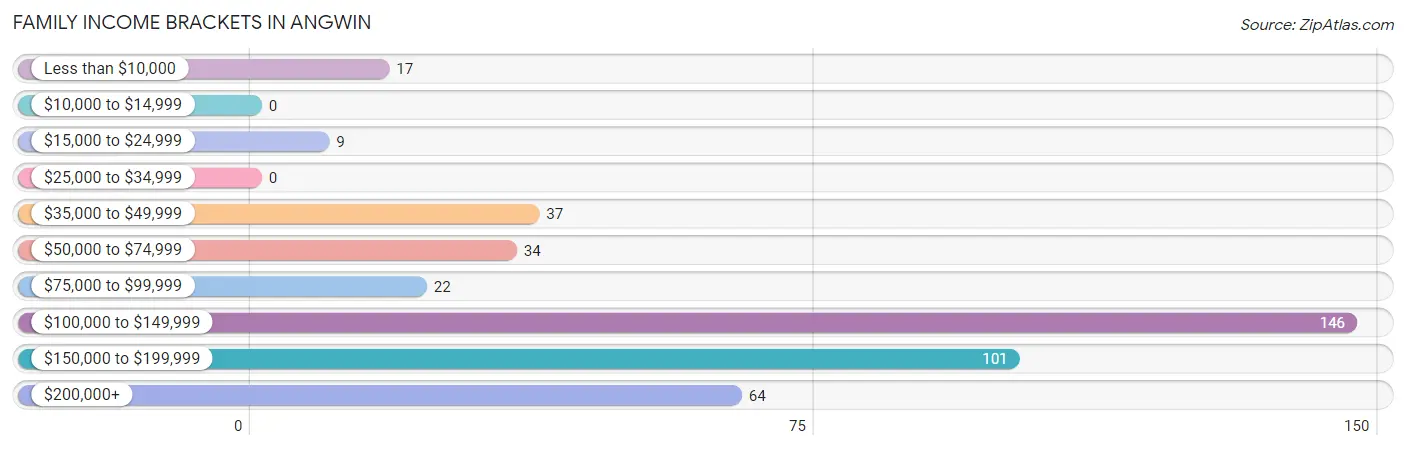
| Income Bracket | # Families | % Families |
| Less than $10,000 | 17 | 4.0% |
| $10,000 to $14,999 | 0 | 0.0% |
| $15,000 to $24,999 | 9 | 2.1% |
| $25,000 to $34,999 | 0 | 0.0% |
| $35,000 to $49,999 | 37 | 8.6% |
| $50,000 to $74,999 | 34 | 7.9% |
| $75,000 to $99,999 | 22 | 5.1% |
| $100,000 to $149,999 | 146 | 34.0% |
| $150,000 to $199,999 | 101 | 23.5% |
| $200,000+ | 64 | 14.9% |
Family Income by Famaliy Size in Angwin
4-person families (49 | 11.4%) account for the highest median family income in Angwin with $146,250 per family, while 2-person families (188 | 43.7%) have the highest median income of $53,750 per family member.
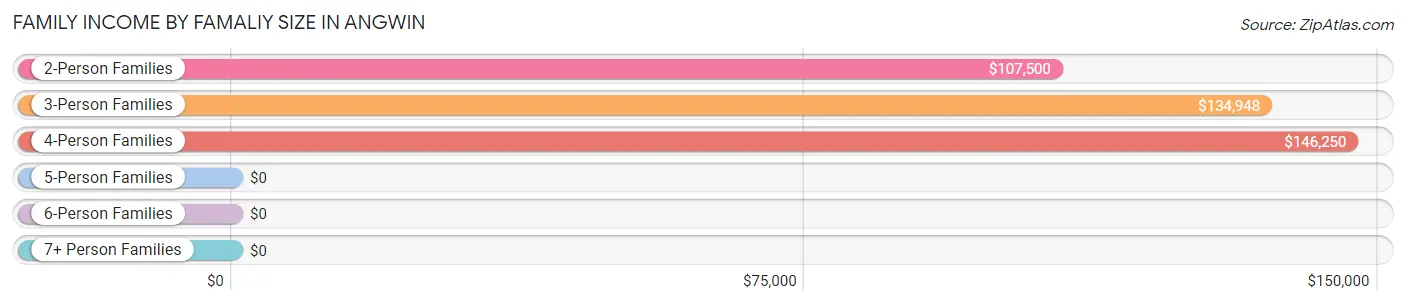
| Income Bracket | # Families | Median Income |
| 2-Person Families | 188 (43.7%) | $107,500 |
| 3-Person Families | 133 (30.9%) | $134,948 |
| 4-Person Families | 49 (11.4%) | $146,250 |
| 5-Person Families | 60 (14.0%) | $0 |
| 6-Person Families | 0 (0.0%) | $0 |
| 7+ Person Families | 0 (0.0%) | $0 |
| Total | 430 (100.0%) | $133,438 |
Family Income by Number of Earners in Angwin
The median family income in Angwin is $133,438, with families comprising 2 earners (233) having the highest median family income of $150,428, while families with no earners (81) have the lowest median family income of $83,125, accounting for 54.2% and 18.8% of families, respectively.
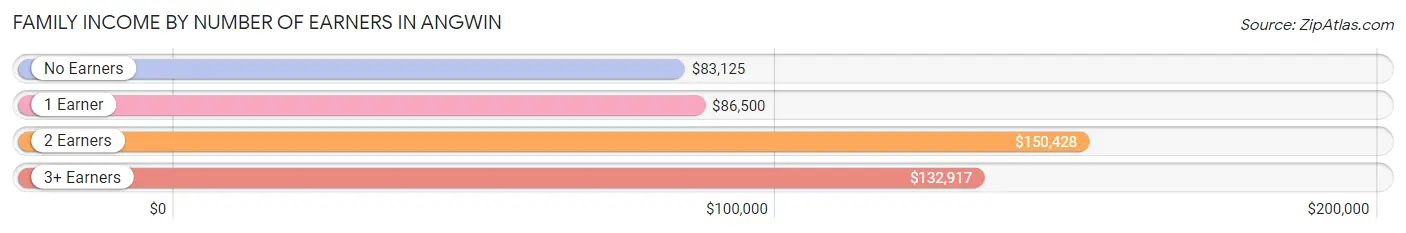
| Number of Earners | # Families | Median Income |
| No Earners | 81 (18.8%) | $83,125 |
| 1 Earner | 86 (20.0%) | $86,500 |
| 2 Earners | 233 (54.2%) | $150,428 |
| 3+ Earners | 30 (7.0%) | $132,917 |
| Total | 430 (100.0%) | $133,438 |
Household Income in Angwin
Household Income Brackets in Angwin
With 235 households falling in the category, the $100,000 to $149,999 income range is the most frequent in Angwin, accounting for 31.7% of all households. In contrast, only 4 households (0.5%) fall into the $10,000 to $14,999 income bracket, making it the least populous group.
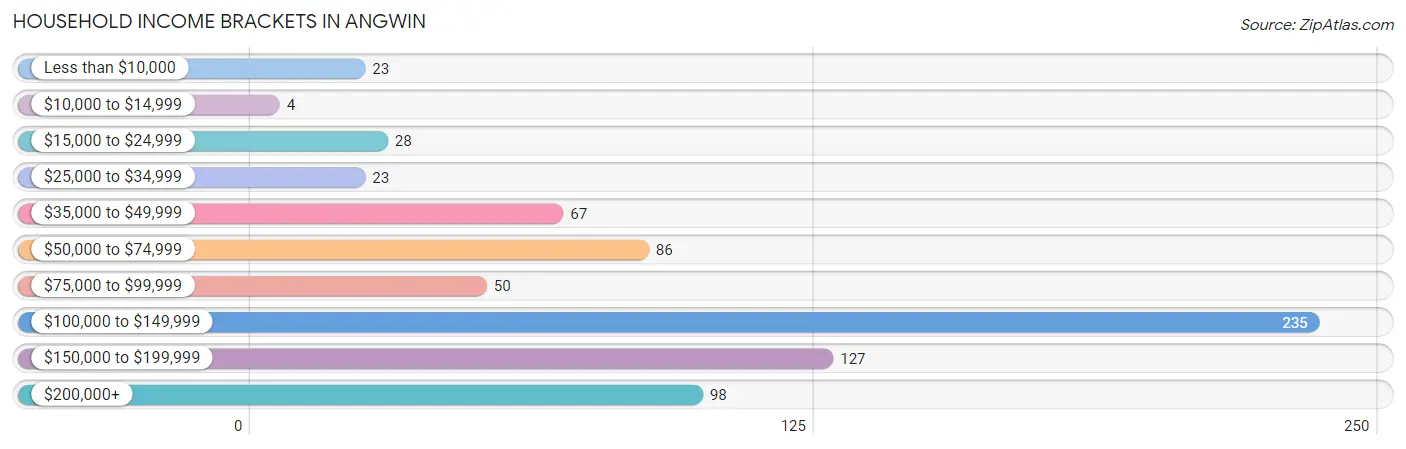
| Income Bracket | # Households | % Households |
| Less than $10,000 | 23 | 3.1% |
| $10,000 to $14,999 | 4 | 0.5% |
| $15,000 to $24,999 | 28 | 3.8% |
| $25,000 to $34,999 | 23 | 3.1% |
| $35,000 to $49,999 | 67 | 9.0% |
| $50,000 to $74,999 | 86 | 11.6% |
| $75,000 to $99,999 | 50 | 6.7% |
| $100,000 to $149,999 | 235 | 31.7% |
| $150,000 to $199,999 | 127 | 17.1% |
| $200,000+ | 98 | 13.2% |
Household Income by Householder Age in Angwin
The median household income in Angwin is $117,813, with the highest median household income of $136,250 found in the 45 to 64 years age bracket for the primary householder. A total of 289 households (39.0%) fall into this category. Meanwhile, the 15 to 24 years age bracket for the primary householder has the lowest median household income of $0, with 13 households (1.8%) in this group.
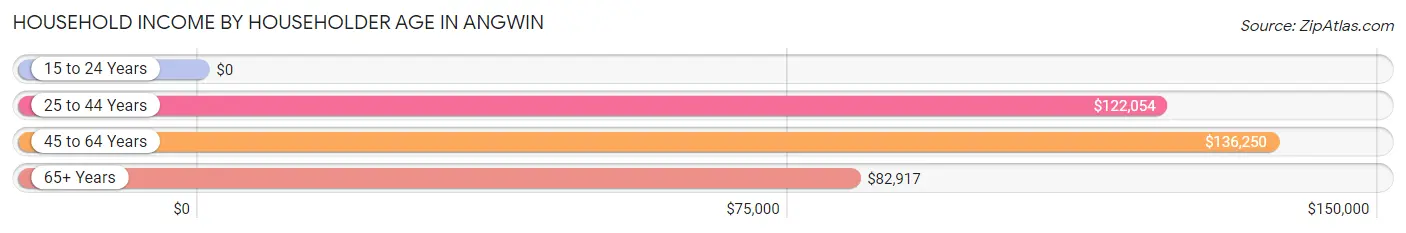
| Income Bracket | # Households | Median Income |
| 15 to 24 Years | 13 (1.8%) | $0 |
| 25 to 44 Years | 297 (40.1%) | $122,054 |
| 45 to 64 Years | 289 (39.0%) | $136,250 |
| 65+ Years | 142 (19.2%) | $82,917 |
| Total | 741 (100.0%) | $117,813 |
Poverty in Angwin
Income Below Poverty by Sex and Age in Angwin
With 11.4% poverty level for males and 10.2% for females among the residents of Angwin, 35 to 44 year old males and 18 to 24 year old females are the most vulnerable to poverty, with 36 males (27.3%) and 17 females (32.7%) in their respective age groups living below the poverty level.
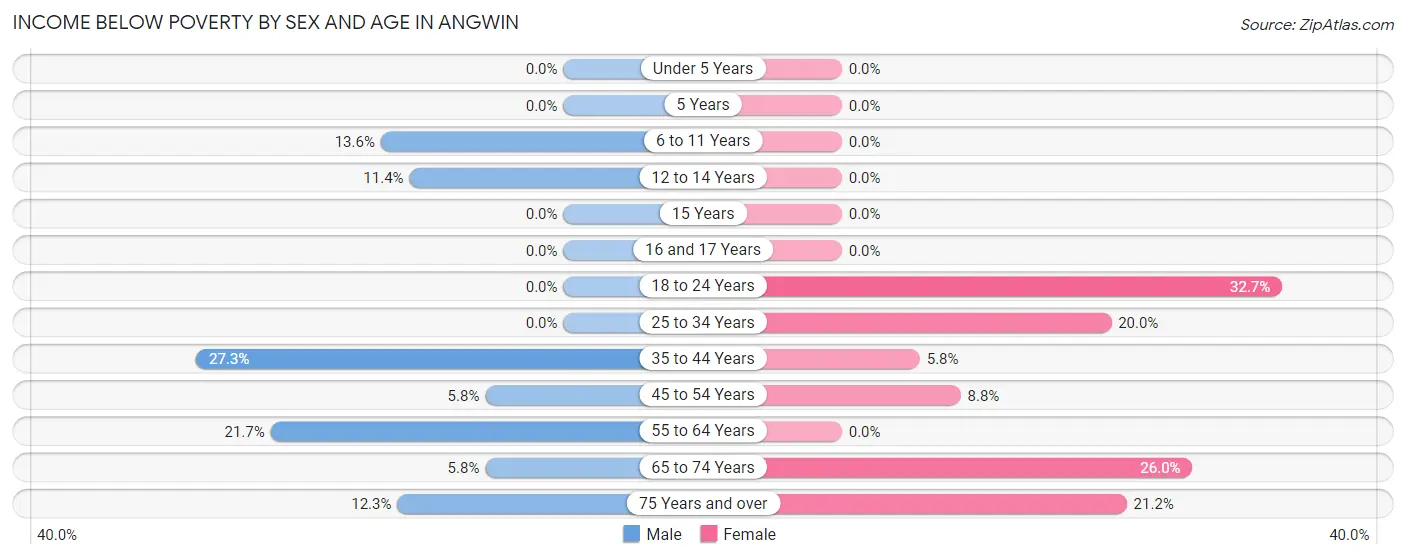
| Age Bracket | Male | Female |
| Under 5 Years | 0 (0.0%) | 0 (0.0%) |
| 5 Years | 0 (0.0%) | 0 (0.0%) |
| 6 to 11 Years | 8 (13.6%) | 0 (0.0%) |
| 12 to 14 Years | 8 (11.4%) | 0 (0.0%) |
| 15 Years | 0 (0.0%) | 0 (0.0%) |
| 16 and 17 Years | 0 (0.0%) | 0 (0.0%) |
| 18 to 24 Years | 0 (0.0%) | 17 (32.7%) |
| 25 to 34 Years | 0 (0.0%) | 16 (20.0%) |
| 35 to 44 Years | 36 (27.3%) | 11 (5.8%) |
| 45 to 54 Years | 8 (5.8%) | 9 (8.8%) |
| 55 to 64 Years | 45 (21.7%) | 0 (0.0%) |
| 65 to 74 Years | 4 (5.8%) | 19 (26.0%) |
| 75 Years and over | 9 (12.3%) | 11 (21.1%) |
| Total | 118 (11.4%) | 83 (10.2%) |
Income Above Poverty by Sex and Age in Angwin
According to the poverty statistics in Angwin, males aged under 5 years and females aged under 5 years are the age groups that are most secure financially, with 100.0% of males and 100.0% of females in these age groups living above the poverty line.
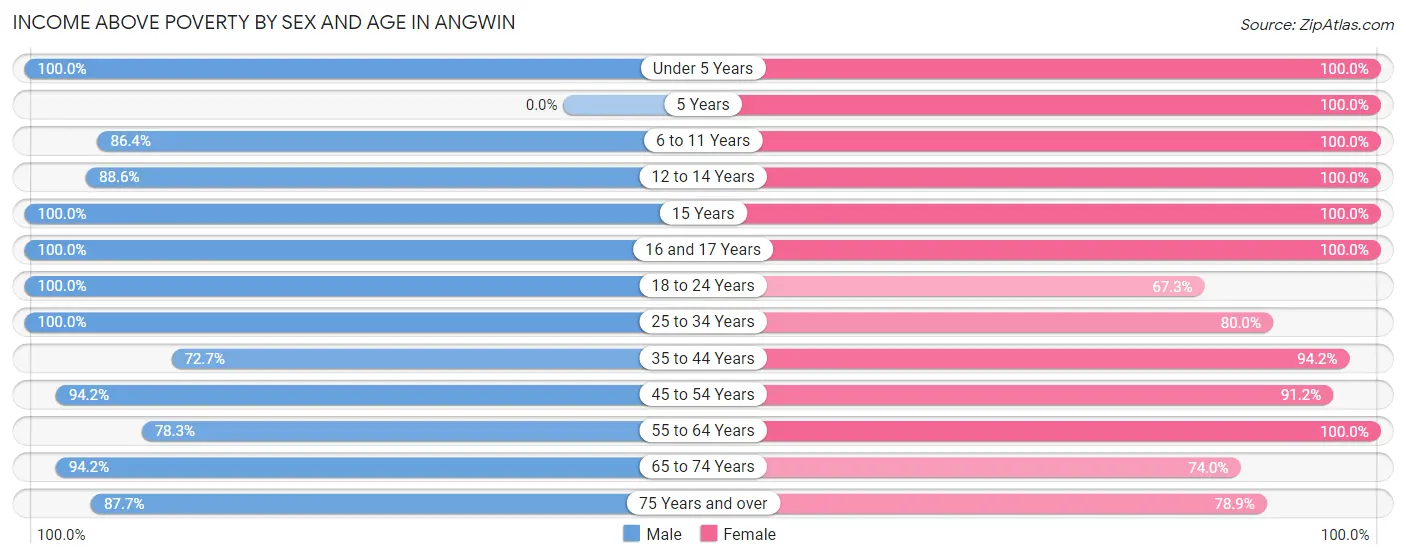
| Age Bracket | Male | Female |
| Under 5 Years | 23 (100.0%) | 59 (100.0%) |
| 5 Years | 0 (0.0%) | 6 (100.0%) |
| 6 to 11 Years | 51 (86.4%) | 50 (100.0%) |
| 12 to 14 Years | 62 (88.6%) | 34 (100.0%) |
| 15 Years | 14 (100.0%) | 18 (100.0%) |
| 16 and 17 Years | 46 (100.0%) | 20 (100.0%) |
| 18 to 24 Years | 47 (100.0%) | 35 (67.3%) |
| 25 to 34 Years | 154 (100.0%) | 64 (80.0%) |
| 35 to 44 Years | 96 (72.7%) | 179 (94.2%) |
| 45 to 54 Years | 130 (94.2%) | 93 (91.2%) |
| 55 to 64 Years | 162 (78.3%) | 74 (100.0%) |
| 65 to 74 Years | 65 (94.2%) | 54 (74.0%) |
| 75 Years and over | 64 (87.7%) | 41 (78.8%) |
| Total | 914 (88.6%) | 727 (89.7%) |
Income Below Poverty Among Married-Couple Families in Angwin
The poverty statistics for married-couple families in Angwin show that 4.7% or 18 of the total 383 families live below the poverty line. Families with 1 or 2 children have the highest poverty rate of 6.4%, comprising of 9 families. On the other hand, families with 3 or 4 children have the lowest poverty rate of 0.0%, which includes 0 families.
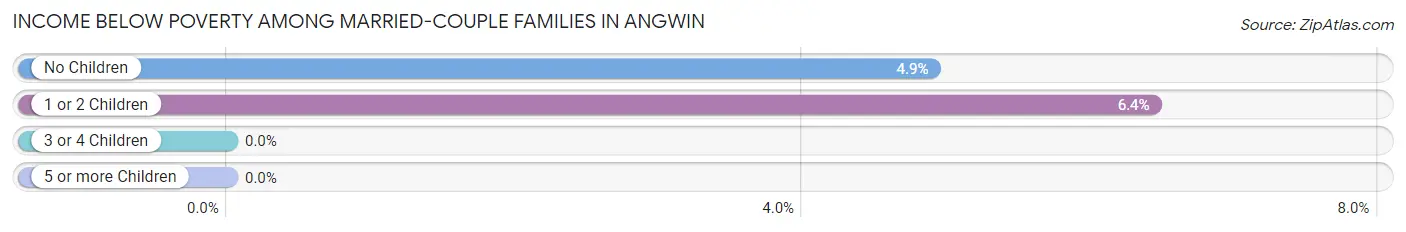
| Children | Above Poverty | Below Poverty |
| No Children | 175 (95.1%) | 9 (4.9%) |
| 1 or 2 Children | 131 (93.6%) | 9 (6.4%) |
| 3 or 4 Children | 59 (100.0%) | 0 (0.0%) |
| 5 or more Children | 0 (0.0%) | 0 (0.0%) |
| Total | 365 (95.3%) | 18 (4.7%) |
Income Below Poverty Among Single-Parent Households in Angwin
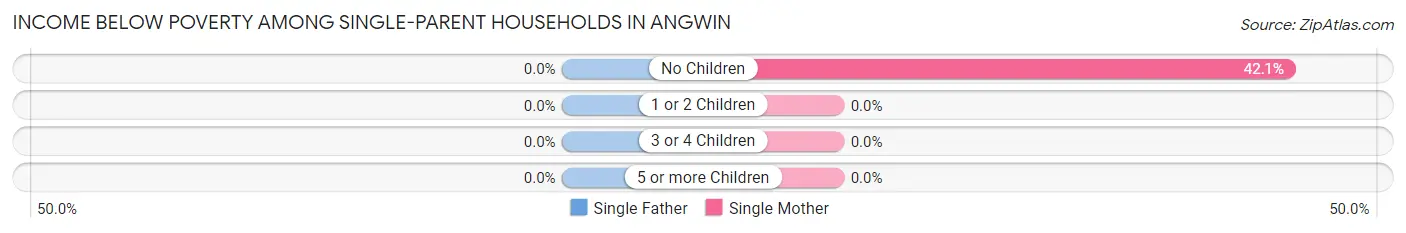
| Children | Single Father | Single Mother |
| No Children | 0 (0.0%) | 8 (42.1%) |
| 1 or 2 Children | 0 (0.0%) | 0 (0.0%) |
| 3 or 4 Children | 0 (0.0%) | 0 (0.0%) |
| 5 or more Children | 0 (0.0%) | 0 (0.0%) |
| Total | 0 (0.0%) | 8 (19.1%) |
Income Below Poverty Among Married-Couple vs Single-Parent Households in Angwin
The poverty data for Angwin shows that 18 of the married-couple family households (4.7%) and 8 of the single-parent households (17.0%) are living below the poverty level. Within the married-couple family households, those with 1 or 2 children have the highest poverty rate, with 9 households (6.4%) falling below the poverty line. Among the single-parent households, those with no children have the highest poverty rate, with 8 household (42.1%) living below poverty.
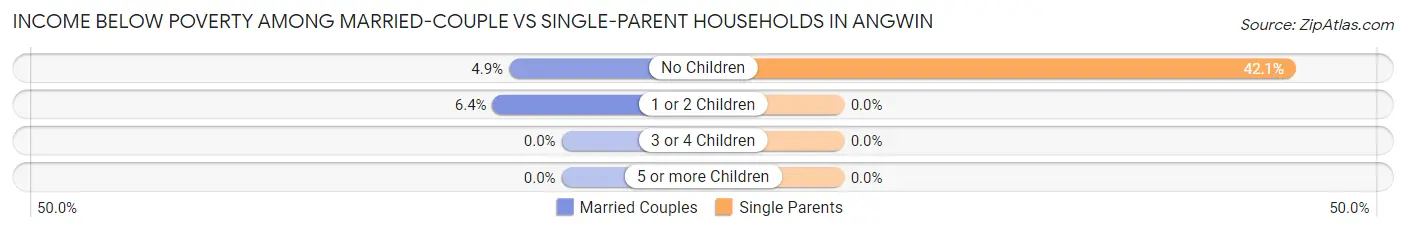
| Children | Married-Couple Families | Single-Parent Households |
| No Children | 9 (4.9%) | 8 (42.1%) |
| 1 or 2 Children | 9 (6.4%) | 0 (0.0%) |
| 3 or 4 Children | 0 (0.0%) | 0 (0.0%) |
| 5 or more Children | 0 (0.0%) | 0 (0.0%) |
| Total | 18 (4.7%) | 8 (17.0%) |
Race in Angwin
The most populous races in Angwin are White / Caucasian (1,537 | 56.3%), Hispanic or Latino (564 | 20.6%), and Asian (482 | 17.6%).
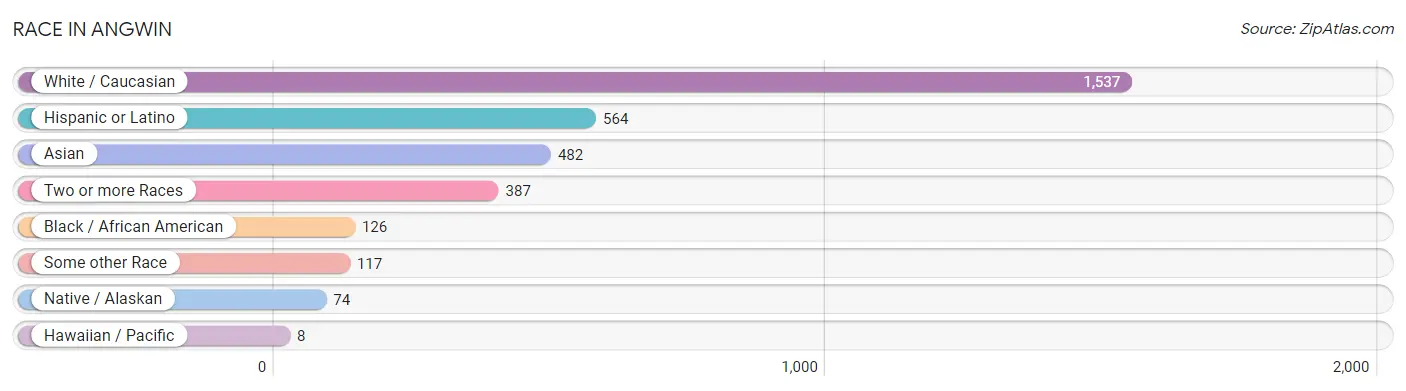
| Race | # Population | % Population |
| Asian | 482 | 17.6% |
| Black / African American | 126 | 4.6% |
| Hawaiian / Pacific | 8 | 0.3% |
| Hispanic or Latino | 564 | 20.6% |
| Native / Alaskan | 74 | 2.7% |
| White / Caucasian | 1,537 | 56.3% |
| Two or more Races | 387 | 14.2% |
| Some other Race | 117 | 4.3% |
| Total | 2,731 | 100.0% |
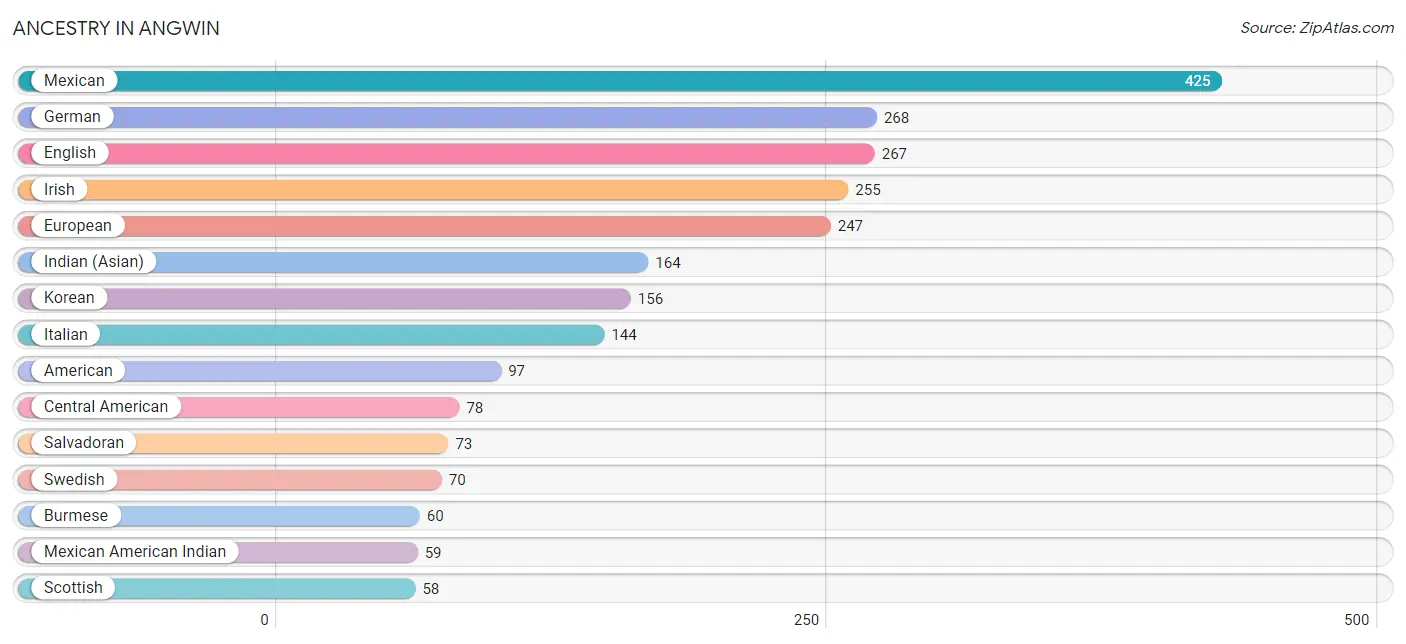
Ancestry in Angwin
The most populous ancestries reported in Angwin are Mexican (425 | 15.6%), German (268 | 9.8%), English (267 | 9.8%), Irish (255 | 9.3%), and European (247 | 9.0%), together accounting for 53.5% of all Angwin residents.
| Ancestry | # Population | % Population |
| African | 31 | 1.1% |
| American | 97 | 3.5% |
| Arab | 7 | 0.3% |
| Australian | 21 | 0.8% |
| Bangladeshi | 51 | 1.9% |
| Basque | 8 | 0.3% |
| Bermudan | 20 | 0.7% |
| Bhutanese | 36 | 1.3% |
| Blackfeet | 8 | 0.3% |
| British | 13 | 0.5% |
| British West Indian | 3 | 0.1% |
| Burmese | 60 | 2.2% |
| Central American | 78 | 2.9% |
| Cherokee | 22 | 0.8% |
| Chickasaw | 22 | 0.8% |
| Chilean | 8 | 0.3% |
| Cuban | 23 | 0.8% |
| Danish | 19 | 0.7% |
| Dutch | 25 | 0.9% |
| Egyptian | 7 | 0.3% |
| English | 267 | 9.8% |
| European | 247 | 9.0% |
| Filipino | 6 | 0.2% |
| French | 24 | 0.9% |
| German | 268 | 9.8% |
| Guamanian / Chamorro | 8 | 0.3% |
| Guatemalan | 5 | 0.2% |
| Hungarian | 6 | 0.2% |
| Indian (Asian) | 164 | 6.0% |
| Iranian | 21 | 0.8% |
| Irish | 255 | 9.3% |
| Italian | 144 | 5.3% |
| Jamaican | 29 | 1.1% |
| Korean | 156 | 5.7% |
| Laotian | 16 | 0.6% |
| Mexican | 425 | 15.6% |
| Mexican American Indian | 59 | 2.2% |
| Norwegian | 39 | 1.4% |
| Pakistani | 6 | 0.2% |
| Polish | 12 | 0.4% |
| Portuguese | 10 | 0.4% |
| Salvadoran | 73 | 2.7% |
| Scandinavian | 3 | 0.1% |
| Scotch-Irish | 21 | 0.8% |
| Scottish | 58 | 2.1% |
| Serbian | 15 | 0.5% |
| Slovak | 22 | 0.8% |
| South African | 8 | 0.3% |
| South American | 8 | 0.3% |
| Spaniard | 13 | 0.5% |
| Spanish | 13 | 0.5% |
| Sri Lankan | 26 | 0.9% |
| Subsaharan African | 39 | 1.4% |
| Swedish | 70 | 2.6% |
| Swiss | 16 | 0.6% |
| Thai | 43 | 1.6% |
| Turkish | 5 | 0.2% |
| Welsh | 4 | 0.2% | View All 58 Rows |
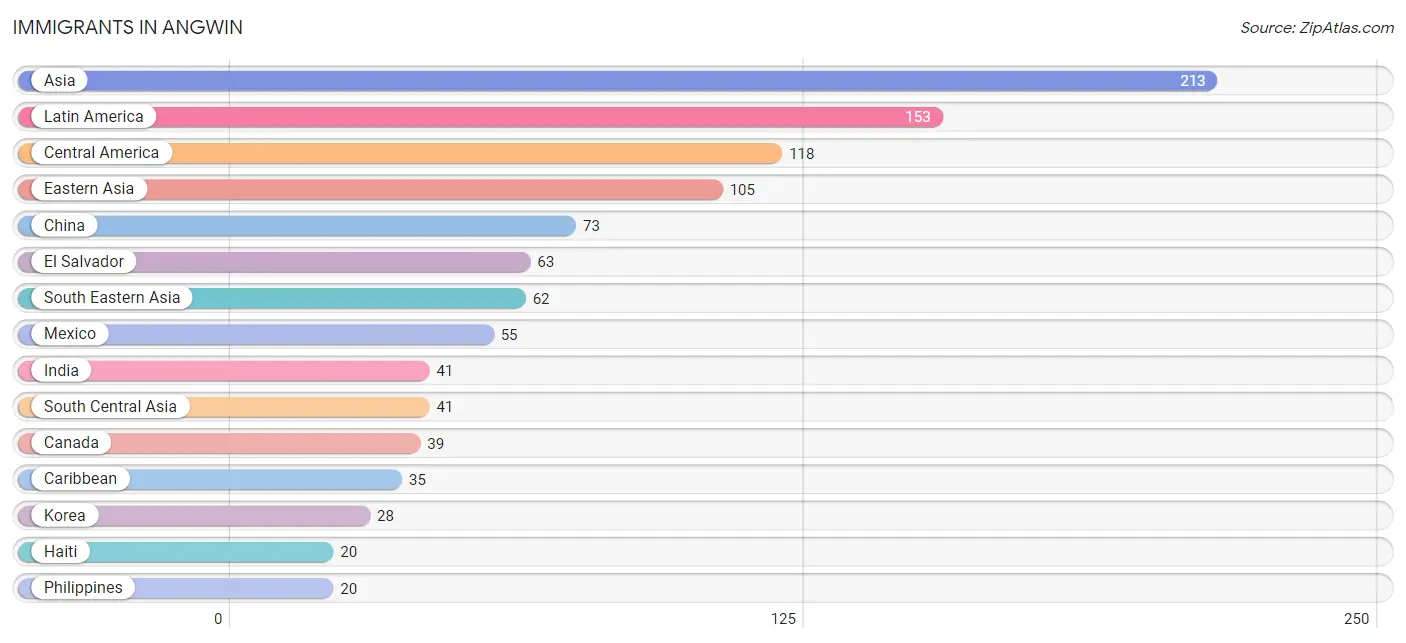
Immigrants in Angwin
The most numerous immigrant groups reported in Angwin came from Asia (213 | 7.8%), Latin America (153 | 5.6%), Central America (118 | 4.3%), Eastern Asia (105 | 3.8%), and China (73 | 2.7%), together accounting for 24.2% of all Angwin residents.
| Immigration Origin | # Population | % Population |
| Africa | 16 | 0.6% |
| Asia | 213 | 7.8% |
| Australia | 8 | 0.3% |
| Canada | 39 | 1.4% |
| Caribbean | 35 | 1.3% |
| Central America | 118 | 4.3% |
| China | 73 | 2.7% |
| Cuba | 15 | 0.5% |
| Eastern Africa | 6 | 0.2% |
| Eastern Asia | 105 | 3.8% |
| Eastern Europe | 5 | 0.2% |
| Egypt | 7 | 0.3% |
| El Salvador | 63 | 2.3% |
| Europe | 13 | 0.5% |
| Haiti | 20 | 0.7% |
| India | 41 | 1.5% |
| Indonesia | 16 | 0.6% |
| Japan | 4 | 0.2% |
| Korea | 28 | 1.0% |
| Latin America | 153 | 5.6% |
| Malaysia | 7 | 0.3% |
| Mexico | 55 | 2.0% |
| Middle Africa | 3 | 0.1% |
| Northern Africa | 7 | 0.3% |
| Northern Europe | 8 | 0.3% |
| Oceania | 8 | 0.3% |
| Philippines | 20 | 0.7% |
| Romania | 5 | 0.2% |
| South Central Asia | 41 | 1.5% |
| South Eastern Asia | 62 | 2.3% |
| Turkey | 5 | 0.2% |
| Vietnam | 19 | 0.7% |
| Western Asia | 5 | 0.2% | View All 33 Rows |
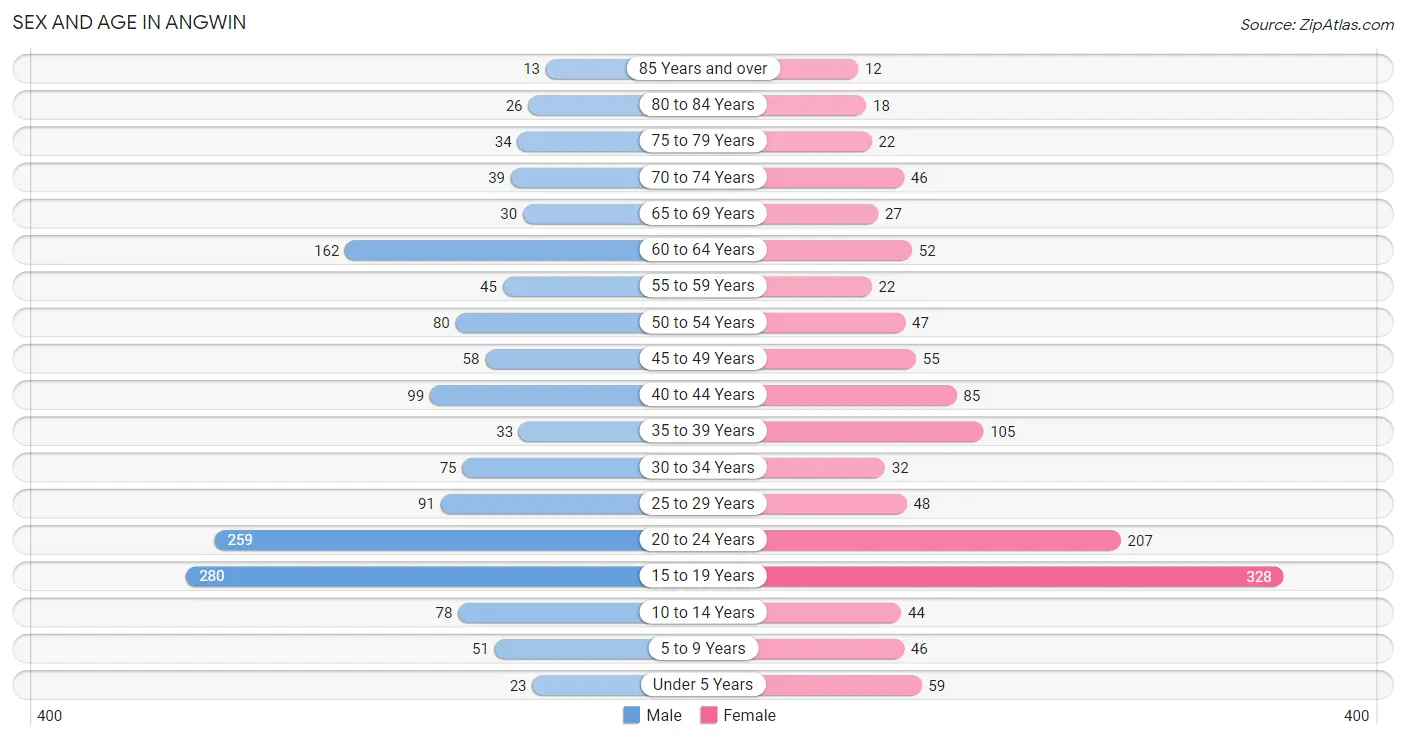
Sex and Age in Angwin
Sex and Age in Angwin
The most populous age groups in Angwin are 15 to 19 Years (280 | 19.0%) for men and 15 to 19 Years (328 | 26.1%) for women.
| Age Bracket | Male | Female |
| Under 5 Years | 23 (1.6%) | 59 (4.7%) |
| 5 to 9 Years | 51 (3.5%) | 46 (3.7%) |
| 10 to 14 Years | 78 (5.3%) | 44 (3.5%) |
| 15 to 19 Years | 280 (19.0%) | 328 (26.1%) |
| 20 to 24 Years | 259 (17.5%) | 207 (16.5%) |
| 25 to 29 Years | 91 (6.2%) | 48 (3.8%) |
| 30 to 34 Years | 75 (5.1%) | 32 (2.5%) |
| 35 to 39 Years | 33 (2.2%) | 105 (8.4%) |
| 40 to 44 Years | 99 (6.7%) | 85 (6.8%) |
| 45 to 49 Years | 58 (3.9%) | 55 (4.4%) |
| 50 to 54 Years | 80 (5.4%) | 47 (3.7%) |
| 55 to 59 Years | 45 (3.0%) | 22 (1.8%) |
| 60 to 64 Years | 162 (11.0%) | 52 (4.1%) |
| 65 to 69 Years | 30 (2.0%) | 27 (2.1%) |
| 70 to 74 Years | 39 (2.6%) | 46 (3.7%) |
| 75 to 79 Years | 34 (2.3%) | 22 (1.8%) |
| 80 to 84 Years | 26 (1.8%) | 18 (1.4%) |
| 85 Years and over | 13 (0.9%) | 12 (1.0%) |
| Total | 1,476 (100.0%) | 1,255 (100.0%) |
Families and Households in Angwin
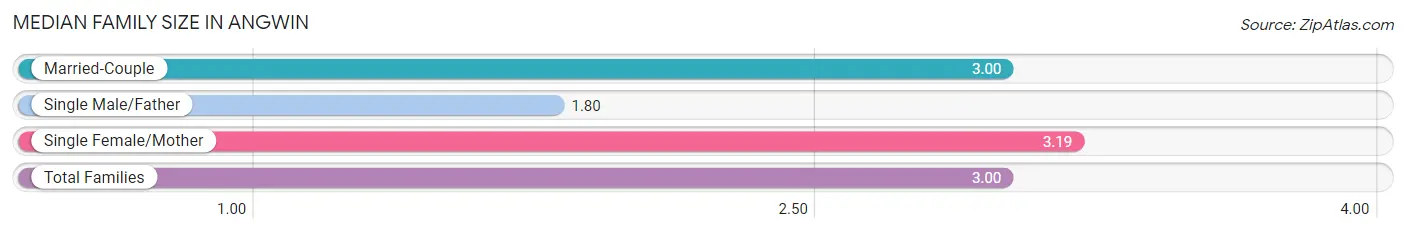
Median Family Size in Angwin
The median family size in Angwin is 3.00 persons per family, with single female/mother families (42 | 9.8%) accounting for the largest median family size of 3.19 persons per family. On the other hand, single male/father families (5 | 1.2%) represent the smallest median family size with 1.80 persons per family.
| Family Type | # Families | Family Size |
| Married-Couple | 383 (89.1%) | 3.00 |
| Single Male/Father | 5 (1.2%) | 1.80 |
| Single Female/Mother | 42 (9.8%) | 3.19 |
| Total Families | 430 (100.0%) | 3.00 |
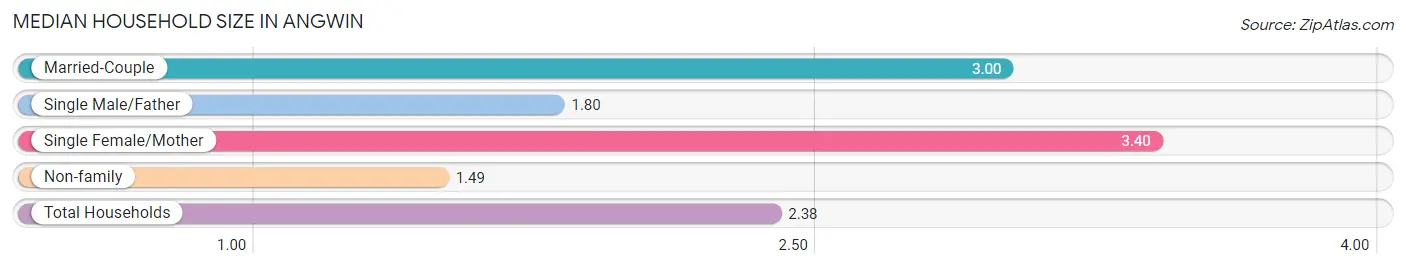
Median Household Size in Angwin
The median household size in Angwin is 2.38 persons per household, with single female/mother households (42 | 5.7%) accounting for the largest median household size of 3.4 persons per household. non-family households (311 | 42.0%) represent the smallest median household size with 1.49 persons per household.
| Household Type | # Households | Household Size |
| Married-Couple | 383 (51.7%) | 3.00 |
| Single Male/Father | 5 (0.7%) | 1.80 |
| Single Female/Mother | 42 (5.7%) | 3.40 |
| Non-family | 311 (42.0%) | 1.49 |
| Total Households | 741 (100.0%) | 2.38 |
Household Size by Marriage Status in Angwin
Out of a total of 741 households in Angwin, 430 (58.0%) are family households, while 311 (42.0%) are nonfamily households. The most numerous type of family households are 2-person households, comprising 188, and the most common type of nonfamily households are 1-person households, comprising 181.
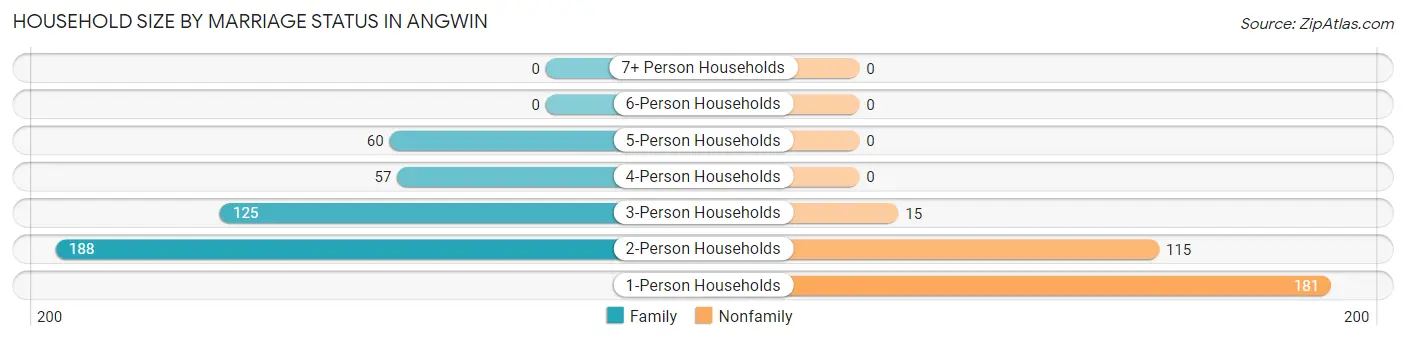
| Household Size | Family Households | Nonfamily Households |
| 1-Person Households | - | 181 (24.4%) |
| 2-Person Households | 188 (25.4%) | 115 (15.5%) |
| 3-Person Households | 125 (16.9%) | 15 (2.0%) |
| 4-Person Households | 57 (7.7%) | 0 (0.0%) |
| 5-Person Households | 60 (8.1%) | 0 (0.0%) |
| 6-Person Households | 0 (0.0%) | 0 (0.0%) |
| 7+ Person Households | 0 (0.0%) | 0 (0.0%) |
| Total | 430 (58.0%) | 311 (42.0%) |
Female Fertility in Angwin
Fertility by Age in Angwin
Average fertility rate in Angwin is 40.0 births per 1,000 women. Women in the age bracket of 35 to 50 years have the highest fertility rate with 108.0 births per 1,000 women. Women in the age bracket of 35 to 50 years acount for 77.1% of all women with births.
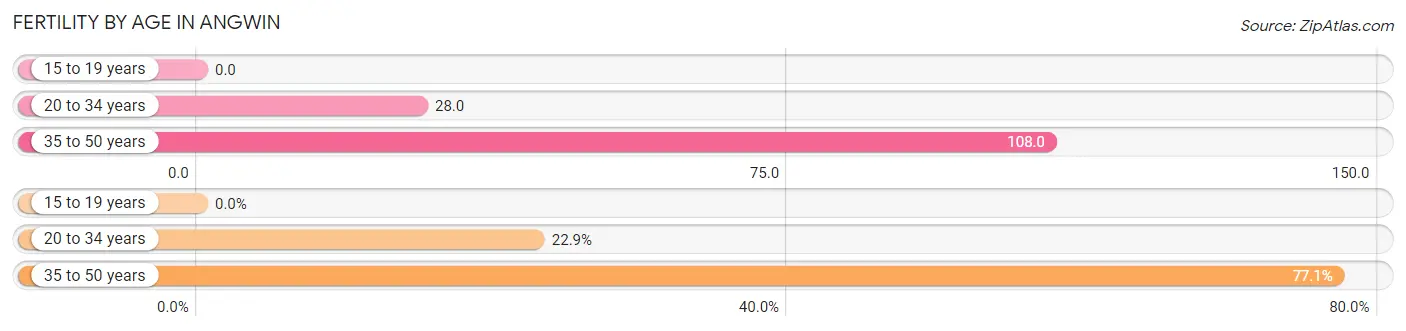
| Age Bracket | Women with Births | Births / 1,000 Women |
| 15 to 19 years | 0 (0.0%) | 0.0 |
| 20 to 34 years | 8 (22.9%) | 28.0 |
| 35 to 50 years | 27 (77.1%) | 108.0 |
| Total | 35 (100.0%) | 40.0 |
Fertility by Age by Marriage Status in Angwin
77.1% of women with births (35) in Angwin are married. The highest percentage of unmarried women with births falls into 20 to 34 years age bracket with 100.0% of them unmarried at the time of birth, while the lowest percentage of unmarried women with births belong to 35 to 50 years age bracket with 0.0% of them unmarried.
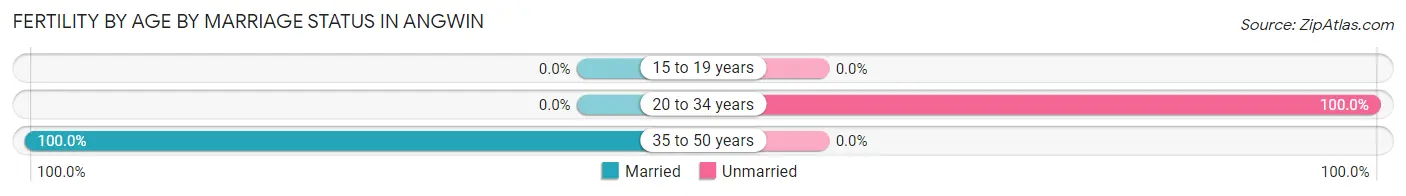
| Age Bracket | Married | Unmarried |
| 15 to 19 years | 0 (0.0%) | 0 (0.0%) |
| 20 to 34 years | 0 (0.0%) | 8 (100.0%) |
| 35 to 50 years | 27 (100.0%) | 0 (0.0%) |
| Total | 27 (77.1%) | 8 (22.9%) |
Fertility by Education in Angwin
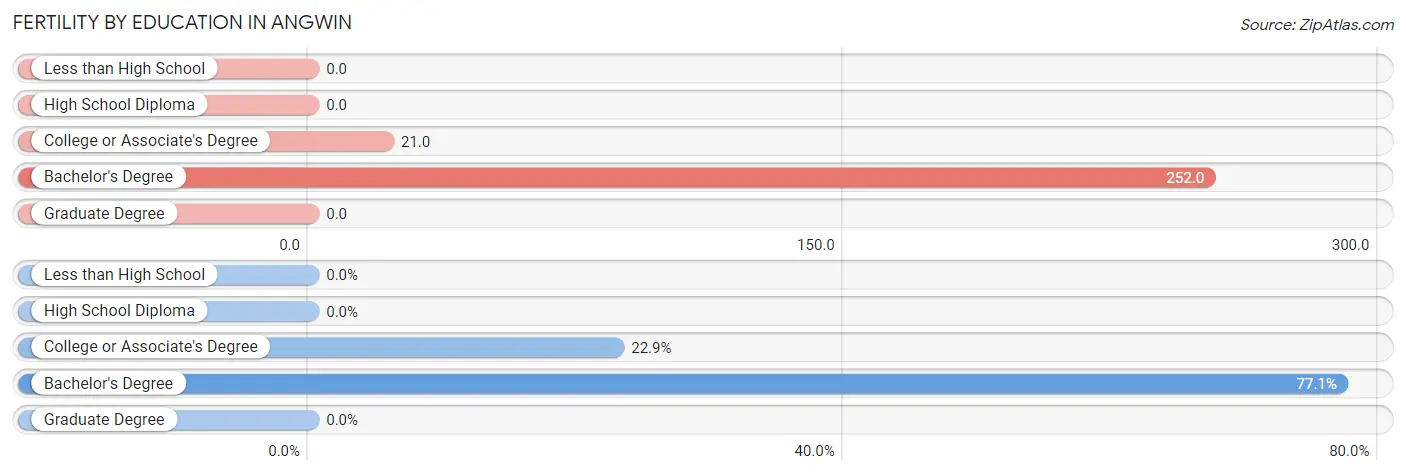
| Educational Attainment | Women with Births | Births / 1,000 Women |
| Less than High School | 0 (0.0%) | 0.0 |
| High School Diploma | 0 (0.0%) | 0.0 |
| College or Associate's Degree | 8 (22.9%) | 21.0 |
| Bachelor's Degree | 27 (77.1%) | 252.0 |
| Graduate Degree | 0 (0.0%) | 0.0 |
| Total | 35 (100.0%) | 40.0 |
Fertility by Education by Marriage Status in Angwin
22.9% of women with births in Angwin are unmarried. Women with the educational attainment of bachelor's degree are most likely to be married with 100.0% of them married at childbirth, while women with the educational attainment of college or associate's degree are least likely to be married with 100.0% of them unmarried at childbirth.
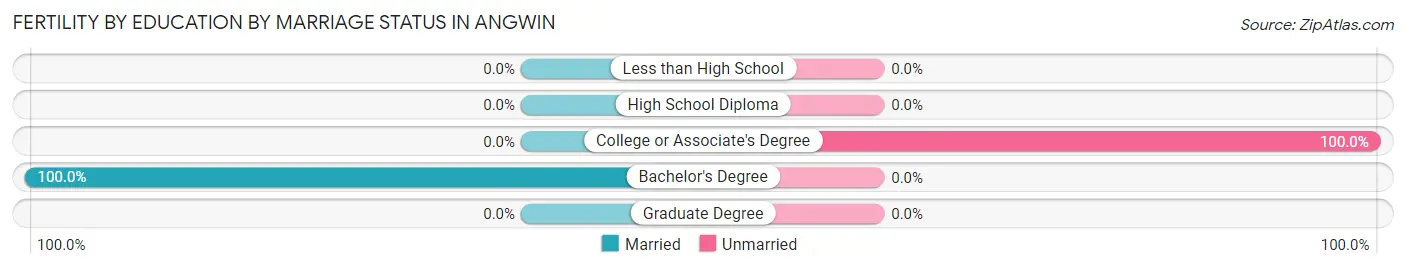
| Educational Attainment | Married | Unmarried |
| Less than High School | 0 (0.0%) | 0 (0.0%) |
| High School Diploma | 0 (0.0%) | 0 (0.0%) |
| College or Associate's Degree | 0 (0.0%) | 8 (100.0%) |
| Bachelor's Degree | 27 (100.0%) | 0 (0.0%) |
| Graduate Degree | 0 (0.0%) | 0 (0.0%) |
| Total | 27 (77.1%) | 8 (22.9%) |
Employment Characteristics in Angwin
Employment by Class of Employer in Angwin
Among the 1,328 employed individuals in Angwin, private company employees (803 | 60.5%), not-for-profit organizations (338 | 25.5%), and self-employed (not incorporated) (60 | 4.5%) make up the most common classes of employment.
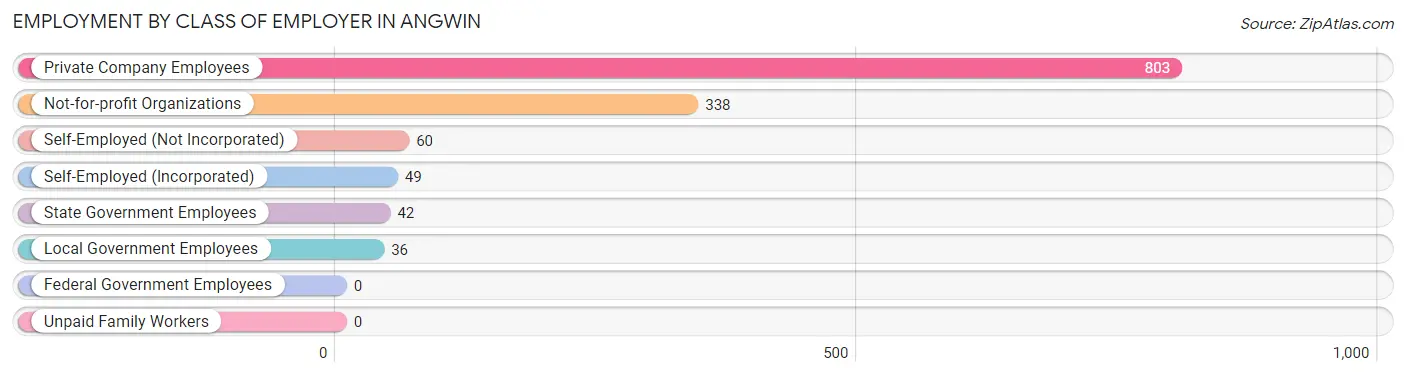
| Employer Class | # Employees | % Employees |
| Private Company Employees | 803 | 60.5% |
| Self-Employed (Incorporated) | 49 | 3.7% |
| Self-Employed (Not Incorporated) | 60 | 4.5% |
| Not-for-profit Organizations | 338 | 25.5% |
| Local Government Employees | 36 | 2.7% |
| State Government Employees | 42 | 3.2% |
| Federal Government Employees | 0 | 0.0% |
| Unpaid Family Workers | 0 | 0.0% |
| Total | 1,328 | 100.0% |
Employment Status by Age in Angwin
According to the labor force statistics for Angwin, out of the total population over 16 years of age (2,398), 62.7% or 1,504 individuals are in the labor force, with 5.8% or 87 of them unemployed. The age group with the highest labor force participation rate is 60 to 64 years, with 95.3% or 204 individuals in the labor force. Within the labor force, the 60 to 64 years age range has the highest percentage of unemployed individuals, with 22.1% or 45 of them being unemployed.
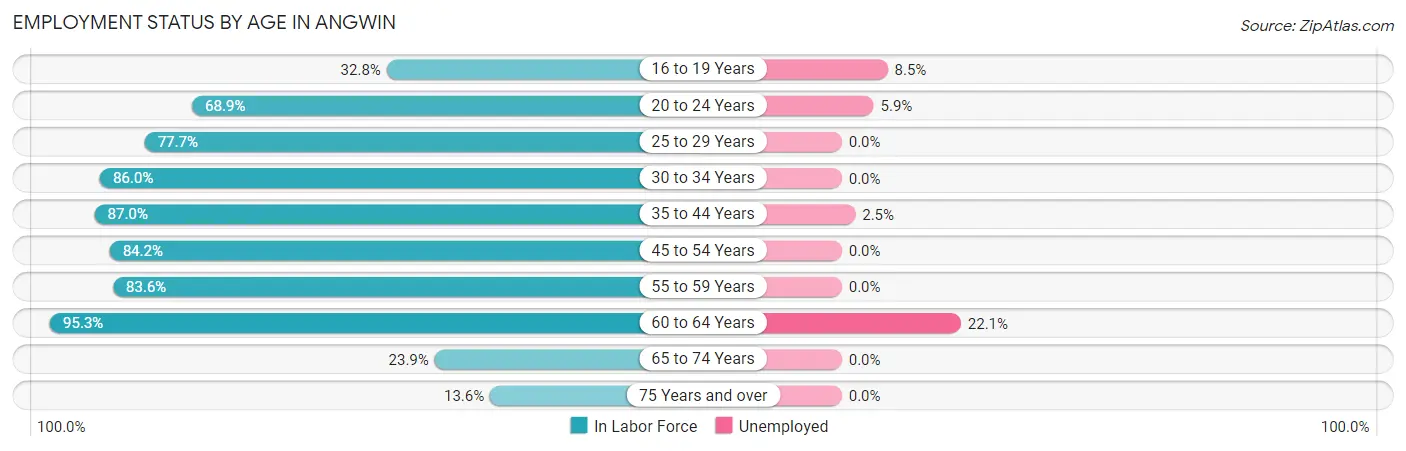
| Age Bracket | In Labor Force | Unemployed |
| 16 to 19 Years | 189 (32.8%) | 16 (8.5%) |
| 20 to 24 Years | 321 (68.9%) | 19 (5.9%) |
| 25 to 29 Years | 108 (77.7%) | 0 (0.0%) |
| 30 to 34 Years | 92 (86.0%) | 0 (0.0%) |
| 35 to 44 Years | 280 (87.0%) | 7 (2.5%) |
| 45 to 54 Years | 202 (84.2%) | 0 (0.0%) |
| 55 to 59 Years | 56 (83.6%) | 0 (0.0%) |
| 60 to 64 Years | 204 (95.3%) | 45 (22.1%) |
| 65 to 74 Years | 34 (23.9%) | 0 (0.0%) |
| 75 Years and over | 17 (13.6%) | 0 (0.0%) |
| Total | 1,504 (62.7%) | 87 (5.8%) |
Employment Status by Educational Attainment in Angwin
According to labor force statistics for Angwin, 86.5% of individuals (942) out of the total population between 25 and 64 years of age (1,089) are in the labor force, with 5.5% or 52 of them being unemployed. The group with the highest labor force participation rate are those with the educational attainment of bachelor's degree or higher, with 93.1% or 510 individuals in the labor force. Within the labor force, individuals with college / associate degree education have the highest percentage of unemployment, with 15.3% or 45 of them being unemployed.
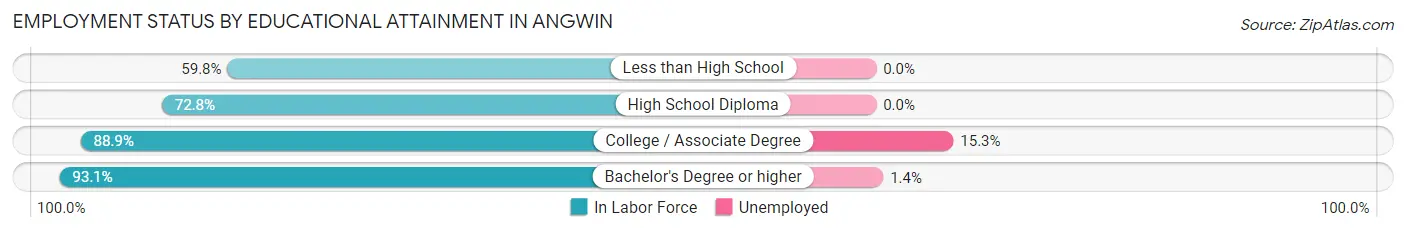
| Educational Attainment | In Labor Force | Unemployed |
| Less than High School | 70 (59.8%) | 0 (0.0%) |
| High School Diploma | 67 (72.8%) | 0 (0.0%) |
| College / Associate Degree | 295 (88.9%) | 51 (15.3%) |
| Bachelor's Degree or higher | 510 (93.1%) | 8 (1.4%) |
| Total | 942 (86.5%) | 60 (5.5%) |
Employment Occupations by Sex in Angwin
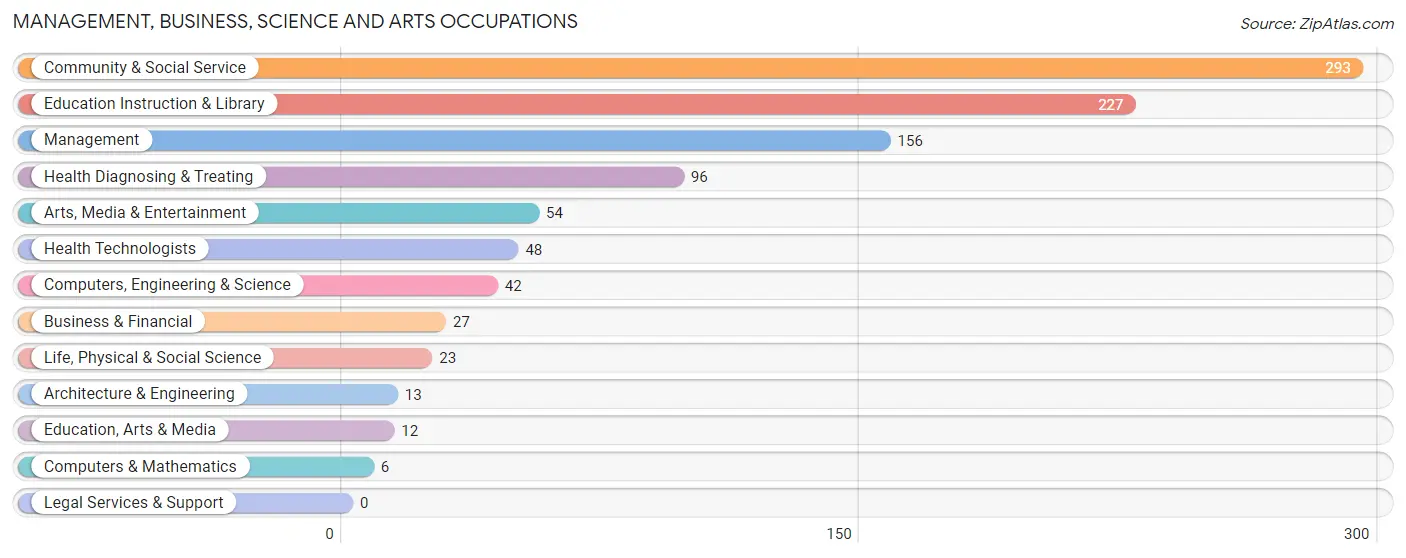
Management, Business, Science and Arts Occupations
The most common Management, Business, Science and Arts occupations in Angwin are Community & Social Service (293 | 20.7%), Education Instruction & Library (227 | 16.0%), Management (156 | 11.0%), Health Diagnosing & Treating (96 | 6.8%), and Arts, Media & Entertainment (54 | 3.8%).
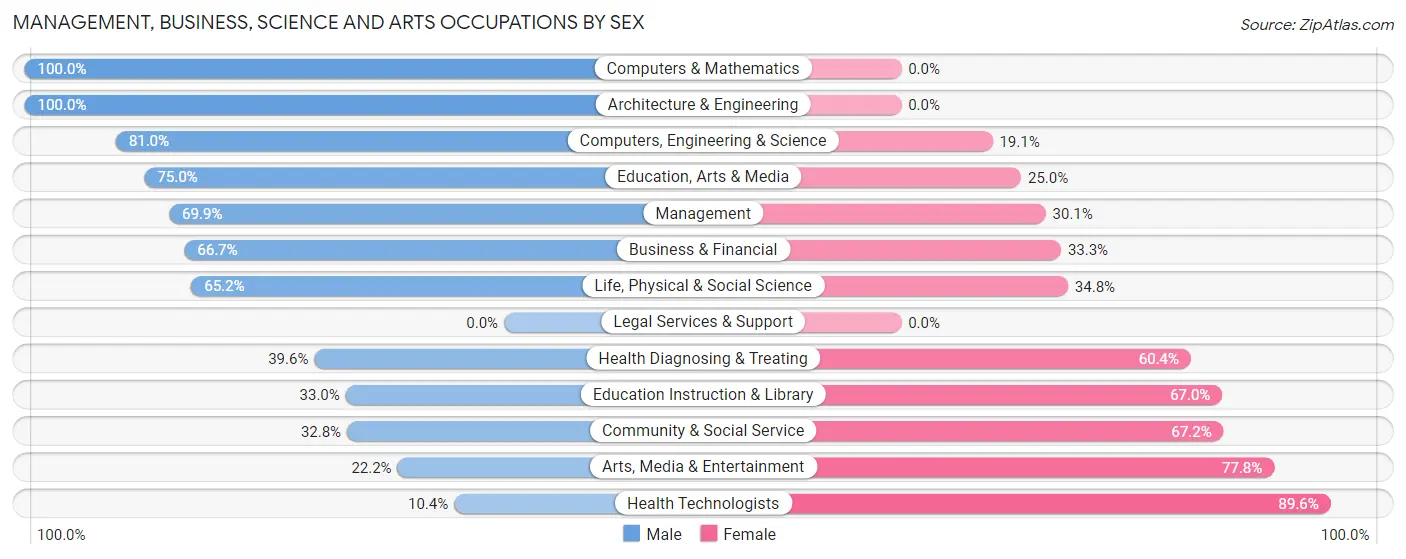
Management, Business, Science and Arts Occupations by Sex
Within the Management, Business, Science and Arts occupations in Angwin, the most male-oriented occupations are Computers & Mathematics (100.0%), Architecture & Engineering (100.0%), and Computers, Engineering & Science (80.9%), while the most female-oriented occupations are Health Technologists (89.6%), Arts, Media & Entertainment (77.8%), and Community & Social Service (67.2%).
| Occupation | Male | Female |
| Management | 109 (69.9%) | 47 (30.1%) |
| Business & Financial | 18 (66.7%) | 9 (33.3%) |
| Computers, Engineering & Science | 34 (80.9%) | 8 (19.1%) |
| Computers & Mathematics | 6 (100.0%) | 0 (0.0%) |
| Architecture & Engineering | 13 (100.0%) | 0 (0.0%) |
| Life, Physical & Social Science | 15 (65.2%) | 8 (34.8%) |
| Community & Social Service | 96 (32.8%) | 197 (67.2%) |
| Education, Arts & Media | 9 (75.0%) | 3 (25.0%) |
| Legal Services & Support | 0 (0.0%) | 0 (0.0%) |
| Education Instruction & Library | 75 (33.0%) | 152 (67.0%) |
| Arts, Media & Entertainment | 12 (22.2%) | 42 (77.8%) |
| Health Diagnosing & Treating | 38 (39.6%) | 58 (60.4%) |
| Health Technologists | 5 (10.4%) | 43 (89.6%) |
| Total (Category) | 295 (48.0%) | 319 (51.9%) |
| Total (Overall) | 823 (58.1%) | 593 (41.9%) |
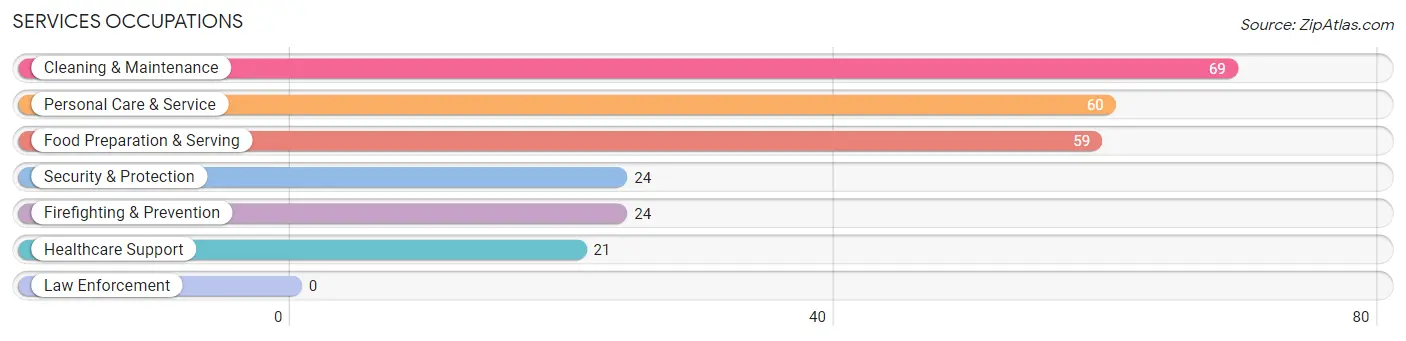
Services Occupations
The most common Services occupations in Angwin are Cleaning & Maintenance (69 | 4.9%), Personal Care & Service (60 | 4.2%), Food Preparation & Serving (59 | 4.2%), Security & Protection (24 | 1.7%), and Firefighting & Prevention (24 | 1.7%).
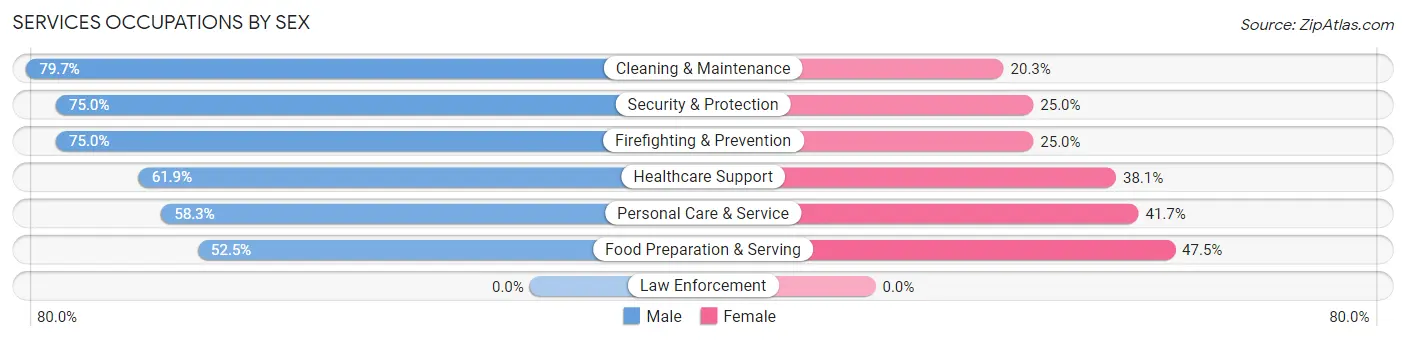
Services Occupations by Sex
Within the Services occupations in Angwin, the most male-oriented occupations are Cleaning & Maintenance (79.7%), Security & Protection (75.0%), and Firefighting & Prevention (75.0%), while the most female-oriented occupations are Food Preparation & Serving (47.5%), Personal Care & Service (41.7%), and Healthcare Support (38.1%).
| Occupation | Male | Female |
| Healthcare Support | 13 (61.9%) | 8 (38.1%) |
| Security & Protection | 18 (75.0%) | 6 (25.0%) |
| Firefighting & Prevention | 18 (75.0%) | 6 (25.0%) |
| Law Enforcement | 0 (0.0%) | 0 (0.0%) |
| Food Preparation & Serving | 31 (52.5%) | 28 (47.5%) |
| Cleaning & Maintenance | 55 (79.7%) | 14 (20.3%) |
| Personal Care & Service | 35 (58.3%) | 25 (41.7%) |
| Total (Category) | 152 (65.2%) | 81 (34.8%) |
| Total (Overall) | 823 (58.1%) | 593 (41.9%) |
Sales and Office Occupations
The most common Sales and Office occupations in Angwin are Office & Administration (167 | 11.8%), and Sales & Related (104 | 7.3%).
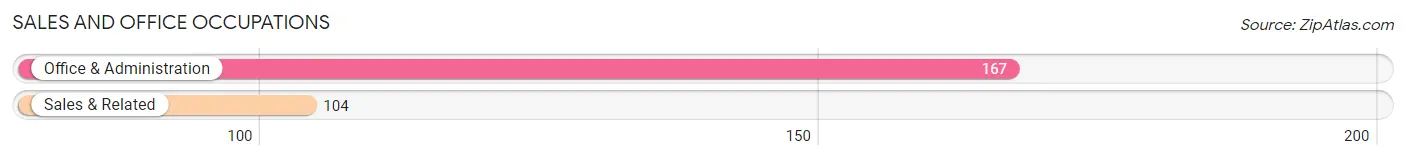
Sales and Office Occupations by Sex
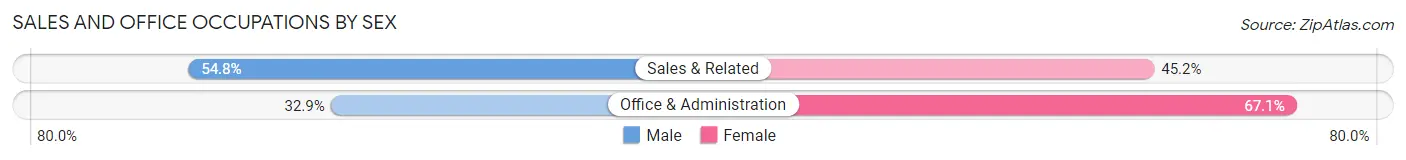
| Occupation | Male | Female |
| Sales & Related | 57 (54.8%) | 47 (45.2%) |
| Office & Administration | 55 (32.9%) | 112 (67.1%) |
| Total (Category) | 112 (41.3%) | 159 (58.7%) |
| Total (Overall) | 823 (58.1%) | 593 (41.9%) |
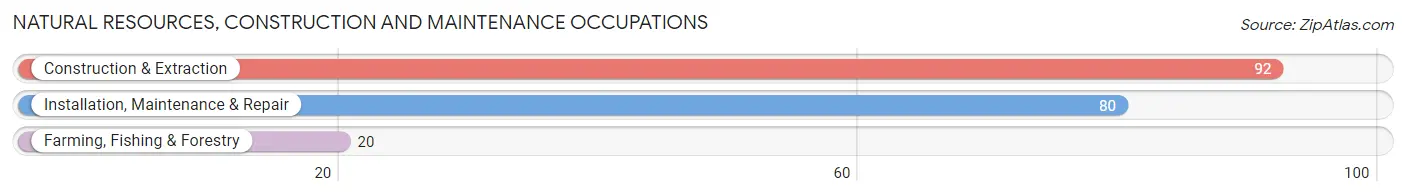
Natural Resources, Construction and Maintenance Occupations
The most common Natural Resources, Construction and Maintenance occupations in Angwin are Construction & Extraction (92 | 6.5%), Installation, Maintenance & Repair (80 | 5.7%), and Farming, Fishing & Forestry (20 | 1.4%).
Natural Resources, Construction and Maintenance Occupations by Sex
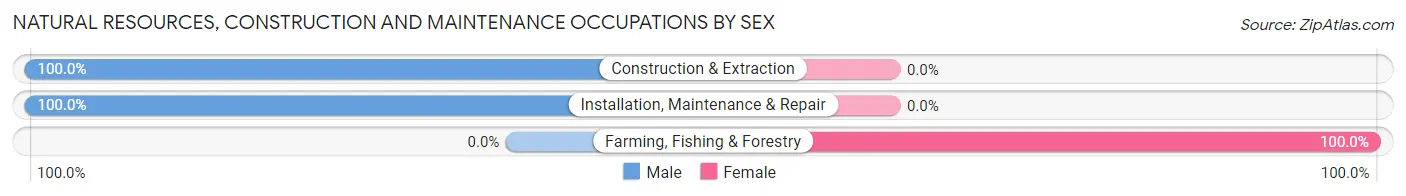
| Occupation | Male | Female |
| Farming, Fishing & Forestry | 0 (0.0%) | 20 (100.0%) |
| Construction & Extraction | 92 (100.0%) | 0 (0.0%) |
| Installation, Maintenance & Repair | 80 (100.0%) | 0 (0.0%) |
| Total (Category) | 172 (89.6%) | 20 (10.4%) |
| Total (Overall) | 823 (58.1%) | 593 (41.9%) |
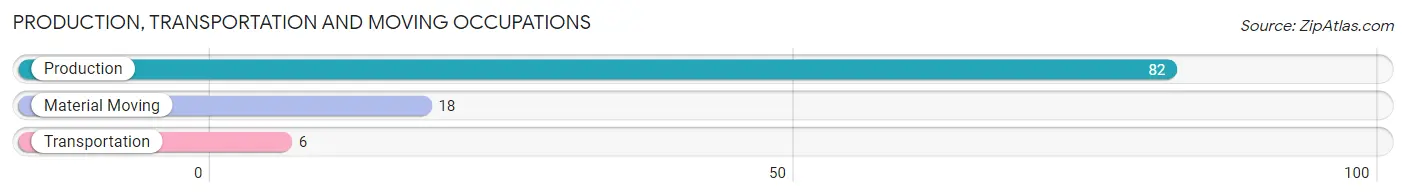
Production, Transportation and Moving Occupations
The most common Production, Transportation and Moving occupations in Angwin are Production (82 | 5.8%), Material Moving (18 | 1.3%), and Transportation (6 | 0.4%).
Production, Transportation and Moving Occupations by Sex
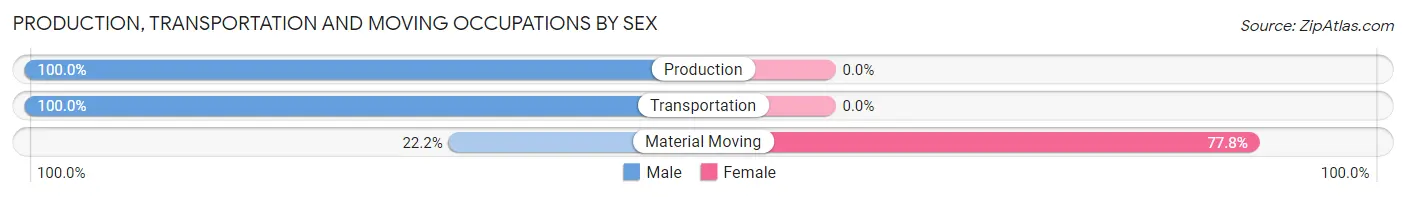
| Occupation | Male | Female |
| Production | 82 (100.0%) | 0 (0.0%) |
| Transportation | 6 (100.0%) | 0 (0.0%) |
| Material Moving | 4 (22.2%) | 14 (77.8%) |
| Total (Category) | 92 (86.8%) | 14 (13.2%) |
| Total (Overall) | 823 (58.1%) | 593 (41.9%) |
Employment Industries by Sex in Angwin
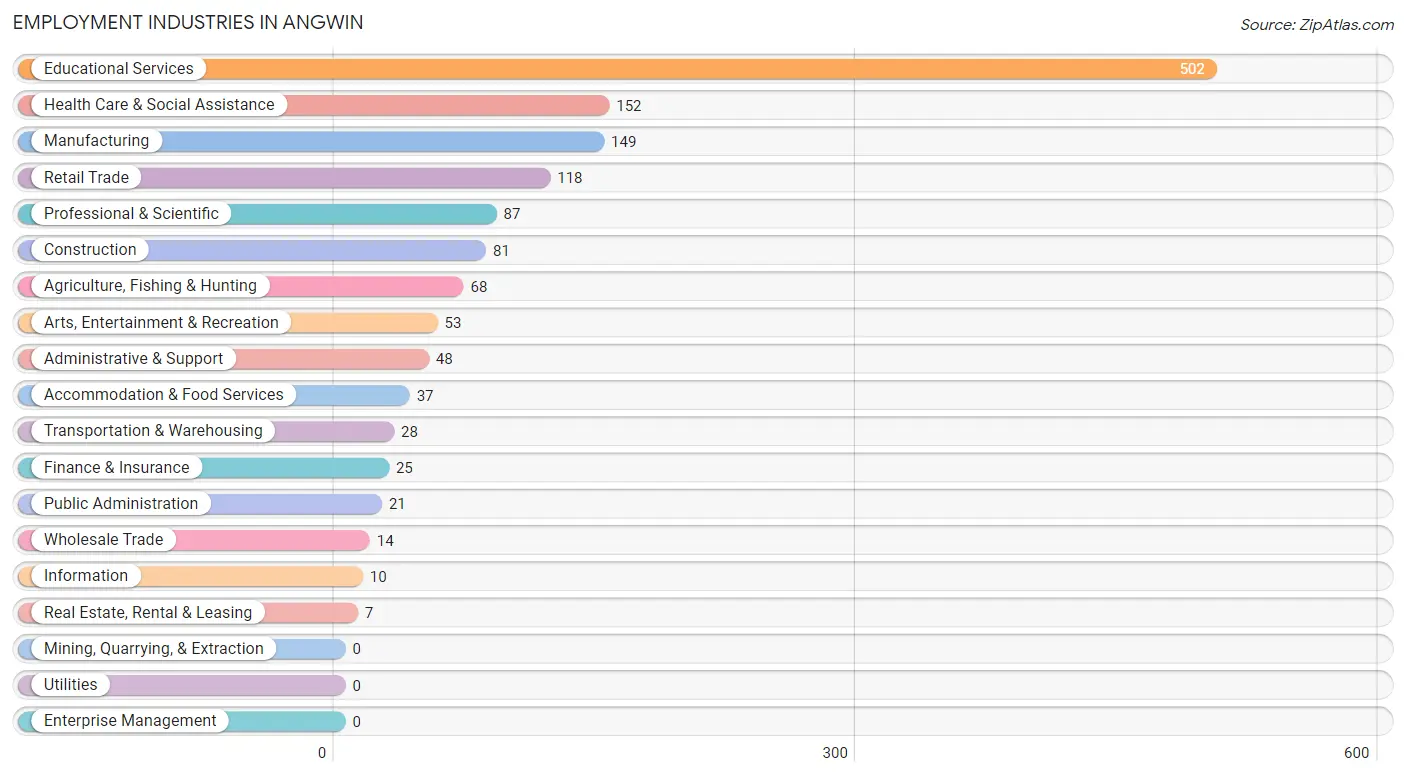
Employment Industries in Angwin
The major employment industries in Angwin include Educational Services (502 | 35.4%), Health Care & Social Assistance (152 | 10.7%), Manufacturing (149 | 10.5%), Retail Trade (118 | 8.3%), and Professional & Scientific (87 | 6.1%).
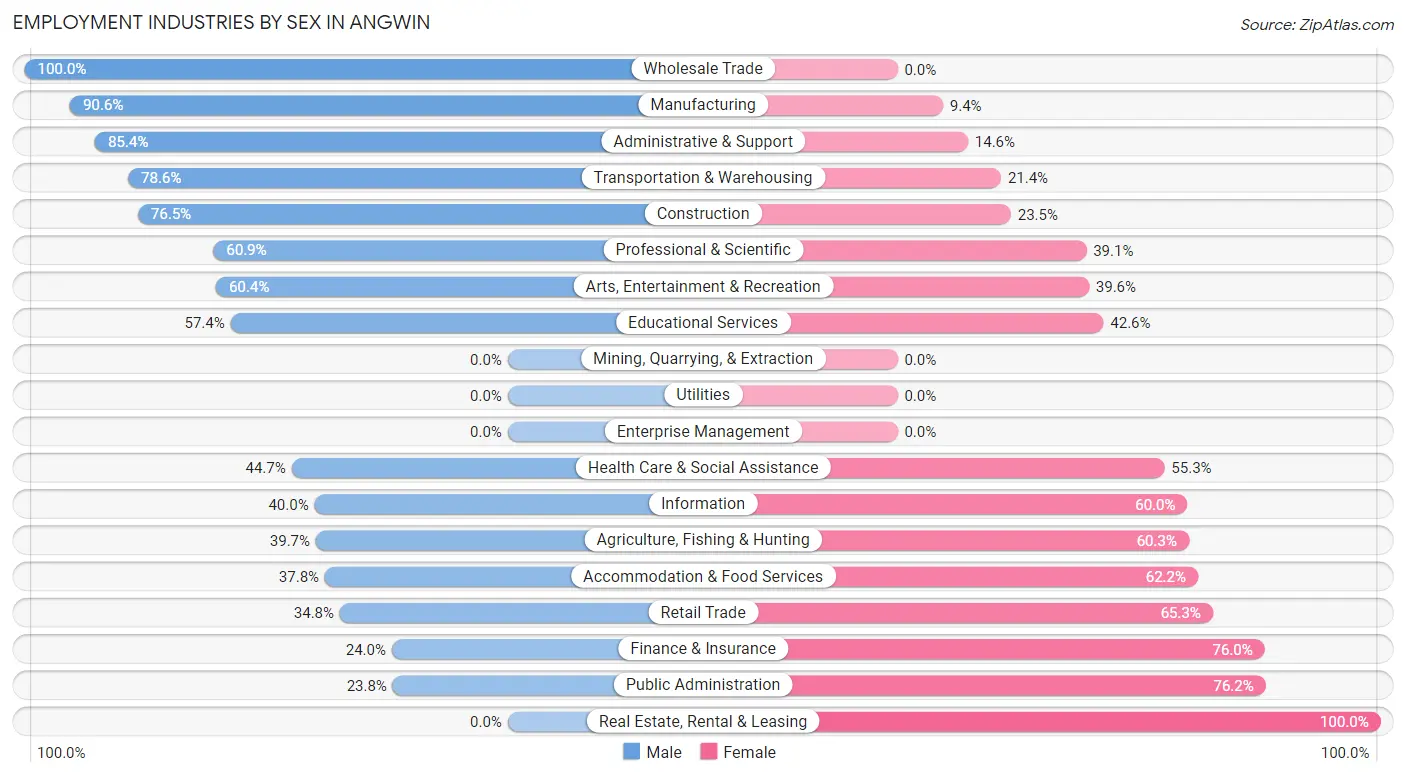
Employment Industries by Sex in Angwin
The Angwin industries that see more men than women are Wholesale Trade (100.0%), Manufacturing (90.6%), and Administrative & Support (85.4%), whereas the industries that tend to have a higher number of women are Real Estate, Rental & Leasing (100.0%), Public Administration (76.2%), and Finance & Insurance (76.0%).
| Industry | Male | Female |
| Agriculture, Fishing & Hunting | 27 (39.7%) | 41 (60.3%) |
| Mining, Quarrying, & Extraction | 0 (0.0%) | 0 (0.0%) |
| Construction | 62 (76.5%) | 19 (23.5%) |
| Manufacturing | 135 (90.6%) | 14 (9.4%) |
| Wholesale Trade | 14 (100.0%) | 0 (0.0%) |
| Retail Trade | 41 (34.7%) | 77 (65.2%) |
| Transportation & Warehousing | 22 (78.6%) | 6 (21.4%) |
| Utilities | 0 (0.0%) | 0 (0.0%) |
| Information | 4 (40.0%) | 6 (60.0%) |
| Finance & Insurance | 6 (24.0%) | 19 (76.0%) |
| Real Estate, Rental & Leasing | 0 (0.0%) | 7 (100.0%) |
| Professional & Scientific | 53 (60.9%) | 34 (39.1%) |
| Enterprise Management | 0 (0.0%) | 0 (0.0%) |
| Administrative & Support | 41 (85.4%) | 7 (14.6%) |
| Educational Services | 288 (57.4%) | 214 (42.6%) |
| Health Care & Social Assistance | 68 (44.7%) | 84 (55.3%) |
| Arts, Entertainment & Recreation | 32 (60.4%) | 21 (39.6%) |
| Accommodation & Food Services | 14 (37.8%) | 23 (62.2%) |
| Public Administration | 5 (23.8%) | 16 (76.2%) |
| Total | 823 (58.1%) | 593 (41.9%) |
Education in Angwin
School Enrollment in Angwin
The most common levels of schooling among the 1,389 students in Angwin are college / undergraduate (1,004 | 72.3%), high school (113 | 8.1%), and elementary school (104 | 7.5%).
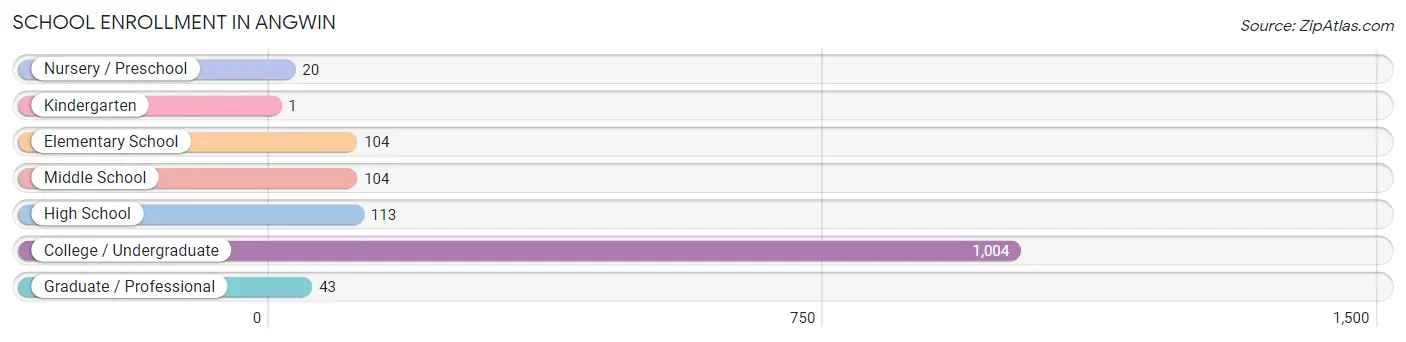
| School Level | # Students | % Students |
| Nursery / Preschool | 20 | 1.4% |
| Kindergarten | 1 | 0.1% |
| Elementary School | 104 | 7.5% |
| Middle School | 104 | 7.5% |
| High School | 113 | 8.1% |
| College / Undergraduate | 1,004 | 72.3% |
| Graduate / Professional | 43 | 3.1% |
| Total | 1,389 | 100.0% |
School Enrollment by Age by Funding Source in Angwin
Out of a total of 1,389 students who are enrolled in schools in Angwin, 946 (68.1%) attend a private institution, while the remaining 443 (31.9%) are enrolled in public schools. The age group of 3 to 4 year olds has the highest likelihood of being enrolled in private schools, with 14 (100.0% in the age bracket) enrolled. Conversely, the age group of 15 to 17 year olds has the lowest likelihood of being enrolled in a private school, with 87 (77.7% in the age bracket) attending a public institution.
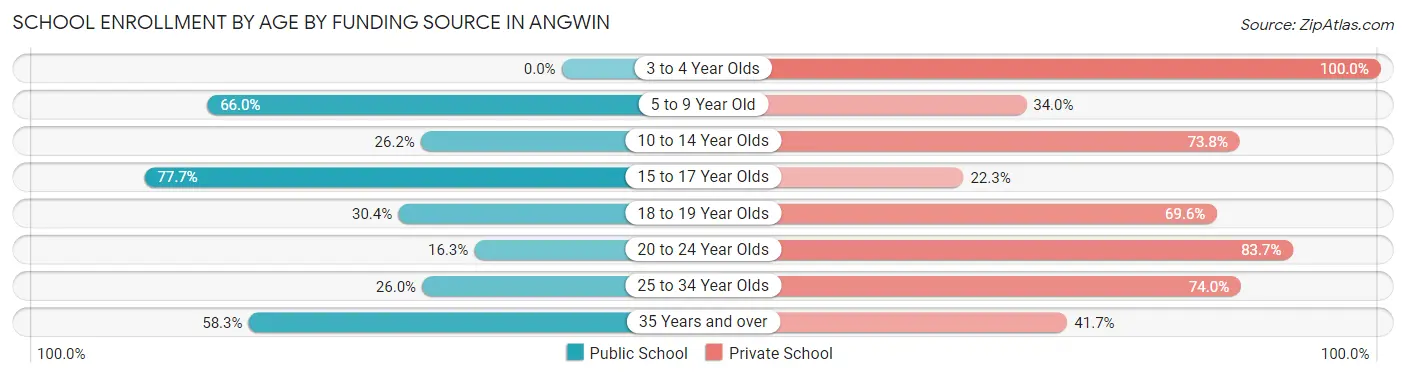
| Age Bracket | Public School | Private School |
| 3 to 4 Year Olds | 0 (0.0%) | 14 (100.0%) |
| 5 to 9 Year Old | 64 (66.0%) | 33 (34.0%) |
| 10 to 14 Year Olds | 32 (26.2%) | 90 (73.8%) |
| 15 to 17 Year Olds | 87 (77.7%) | 25 (22.3%) |
| 18 to 19 Year Olds | 151 (30.4%) | 345 (69.6%) |
| 20 to 24 Year Olds | 69 (16.3%) | 355 (83.7%) |
| 25 to 34 Year Olds | 26 (26.0%) | 74 (74.0%) |
| 35 Years and over | 14 (58.3%) | 10 (41.7%) |
| Total | 443 (31.9%) | 946 (68.1%) |
Educational Attainment by Field of Study in Angwin
Bio, nature & agricultural (162 | 21.8%), literature & languages (104 | 14.0%), education (87 | 11.7%), science & technology (85 | 11.4%), and arts & humanities (64 | 8.6%) are the most common fields of study among 743 individuals in Angwin who have obtained a bachelor's degree or higher.
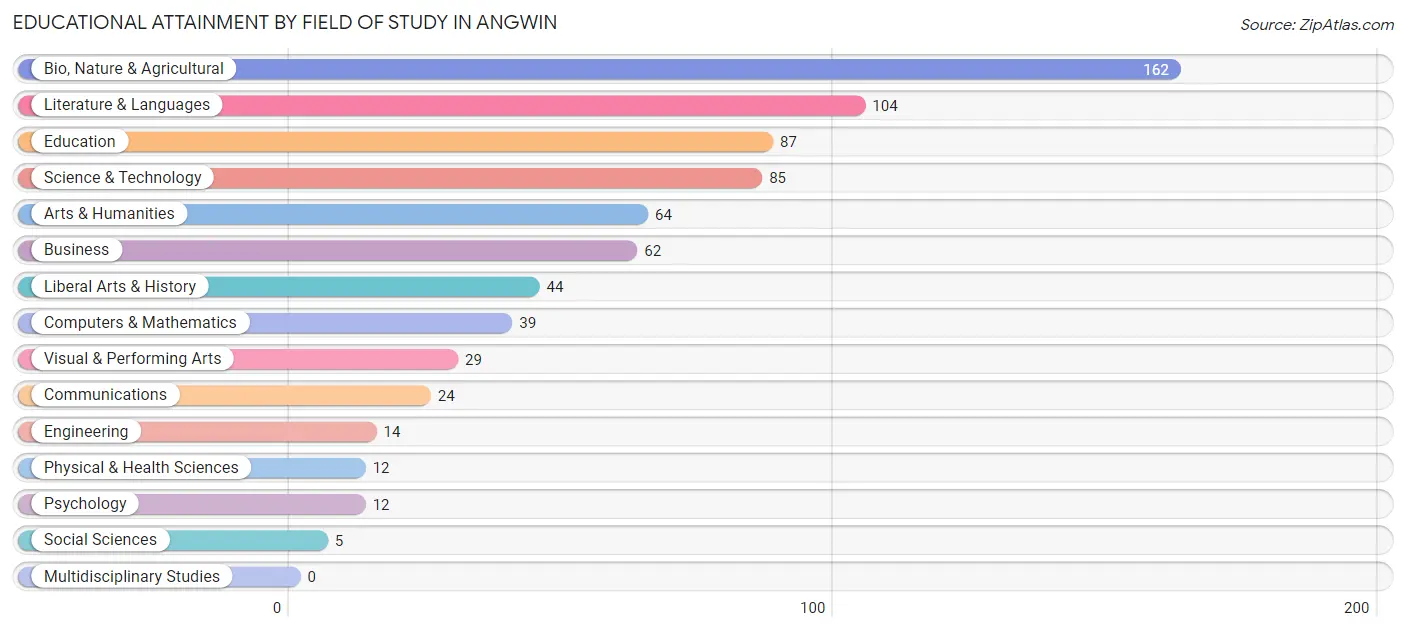
| Field of Study | # Graduates | % Graduates |
| Computers & Mathematics | 39 | 5.2% |
| Bio, Nature & Agricultural | 162 | 21.8% |
| Physical & Health Sciences | 12 | 1.6% |
| Psychology | 12 | 1.6% |
| Social Sciences | 5 | 0.7% |
| Engineering | 14 | 1.9% |
| Multidisciplinary Studies | 0 | 0.0% |
| Science & Technology | 85 | 11.4% |
| Business | 62 | 8.3% |
| Education | 87 | 11.7% |
| Literature & Languages | 104 | 14.0% |
| Liberal Arts & History | 44 | 5.9% |
| Visual & Performing Arts | 29 | 3.9% |
| Communications | 24 | 3.2% |
| Arts & Humanities | 64 | 8.6% |
| Total | 743 | 100.0% |
Transportation & Commute in Angwin
Vehicle Availability by Sex in Angwin
The most prevalent vehicle ownership categories in Angwin are males with 2 vehicles (207, accounting for 35.1%) and females with 2 vehicles (112, making up 57.7%).
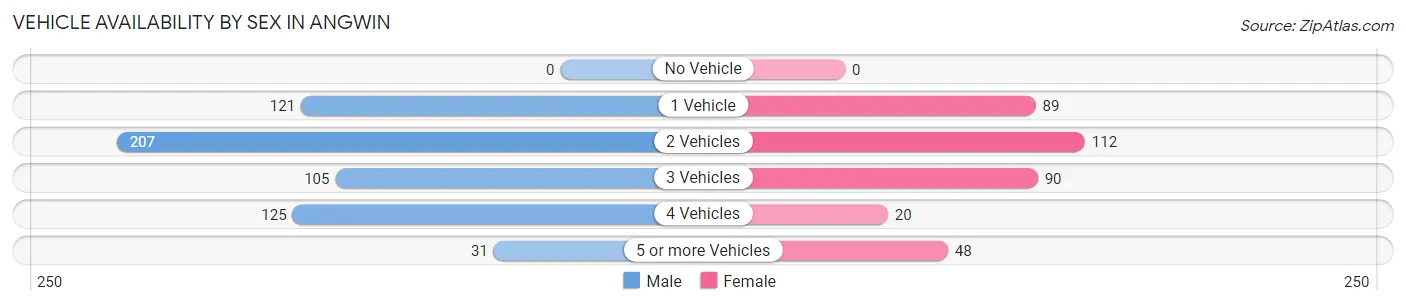
| Vehicles Available | Male | Female |
| No Vehicle | 0 (0.0%) | 0 (0.0%) |
| 1 Vehicle | 121 (20.5%) | 89 (24.8%) |
| 2 Vehicles | 207 (35.1%) | 112 (31.2%) |
| 3 Vehicles | 105 (17.8%) | 90 (25.1%) |
| 4 Vehicles | 125 (21.2%) | 20 (5.6%) |
| 5 or more Vehicles | 31 (5.3%) | 48 (13.4%) |
| Total | 589 (100.0%) | 359 (100.0%) |
Commute Time in Angwin
The most frequently occuring commute durations in Angwin are 5 to 9 minutes (330 commuters, 30.2%), 15 to 19 minutes (191 commuters, 17.5%), and less than 5 minutes (112 commuters, 10.3%).
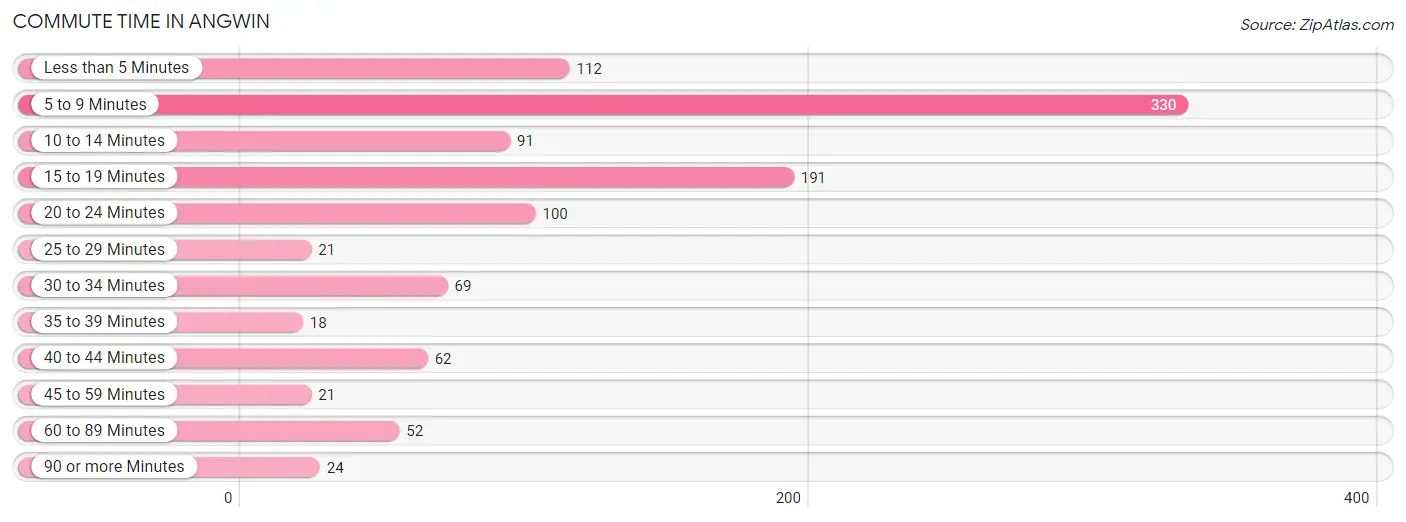
| Commute Time | # Commuters | % Commuters |
| Less than 5 Minutes | 112 | 10.3% |
| 5 to 9 Minutes | 330 | 30.2% |
| 10 to 14 Minutes | 91 | 8.3% |
| 15 to 19 Minutes | 191 | 17.5% |
| 20 to 24 Minutes | 100 | 9.2% |
| 25 to 29 Minutes | 21 | 1.9% |
| 30 to 34 Minutes | 69 | 6.3% |
| 35 to 39 Minutes | 18 | 1.7% |
| 40 to 44 Minutes | 62 | 5.7% |
| 45 to 59 Minutes | 21 | 1.9% |
| 60 to 89 Minutes | 52 | 4.8% |
| 90 or more Minutes | 24 | 2.2% |
Commute Time by Sex in Angwin
The most common commute times in Angwin are 5 to 9 minutes (159 commuters, 25.3%) for males and 5 to 9 minutes (171 commuters, 37.0%) for females.
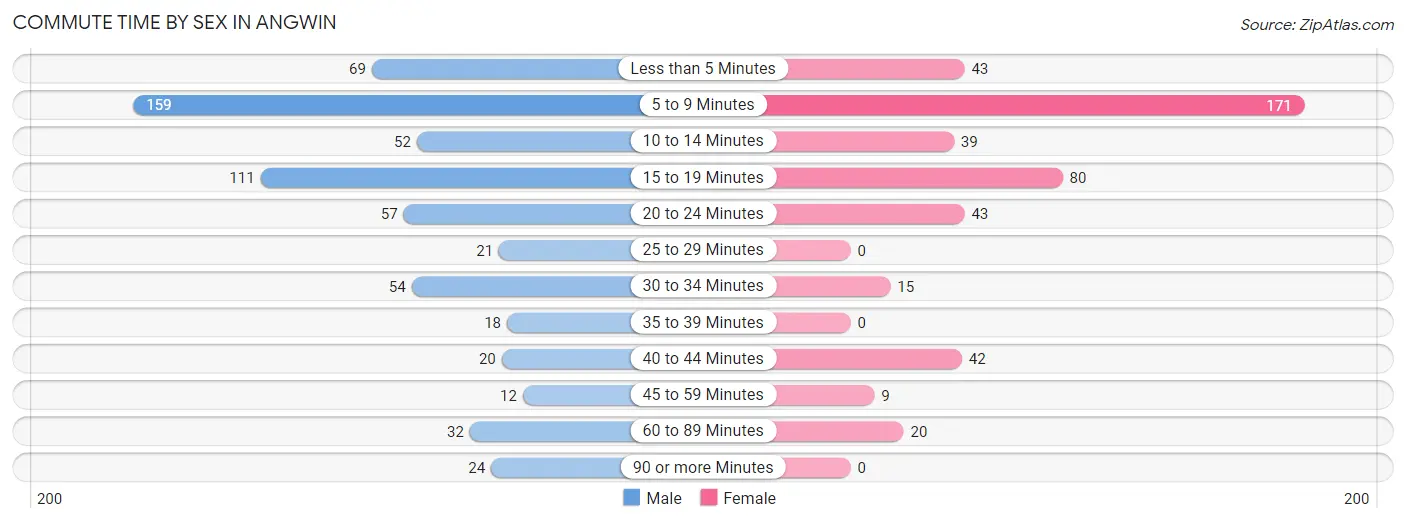
| Commute Time | Male | Female |
| Less than 5 Minutes | 69 (11.0%) | 43 (9.3%) |
| 5 to 9 Minutes | 159 (25.3%) | 171 (37.0%) |
| 10 to 14 Minutes | 52 (8.3%) | 39 (8.4%) |
| 15 to 19 Minutes | 111 (17.6%) | 80 (17.3%) |
| 20 to 24 Minutes | 57 (9.1%) | 43 (9.3%) |
| 25 to 29 Minutes | 21 (3.3%) | 0 (0.0%) |
| 30 to 34 Minutes | 54 (8.6%) | 15 (3.3%) |
| 35 to 39 Minutes | 18 (2.9%) | 0 (0.0%) |
| 40 to 44 Minutes | 20 (3.2%) | 42 (9.1%) |
| 45 to 59 Minutes | 12 (1.9%) | 9 (1.9%) |
| 60 to 89 Minutes | 32 (5.1%) | 20 (4.3%) |
| 90 or more Minutes | 24 (3.8%) | 0 (0.0%) |
Time of Departure to Work by Sex in Angwin
The most frequent times of departure to work in Angwin are 8:00 AM to 8:29 AM (139, 22.1%) for males and 8:00 AM to 8:29 AM (66, 14.3%) for females.
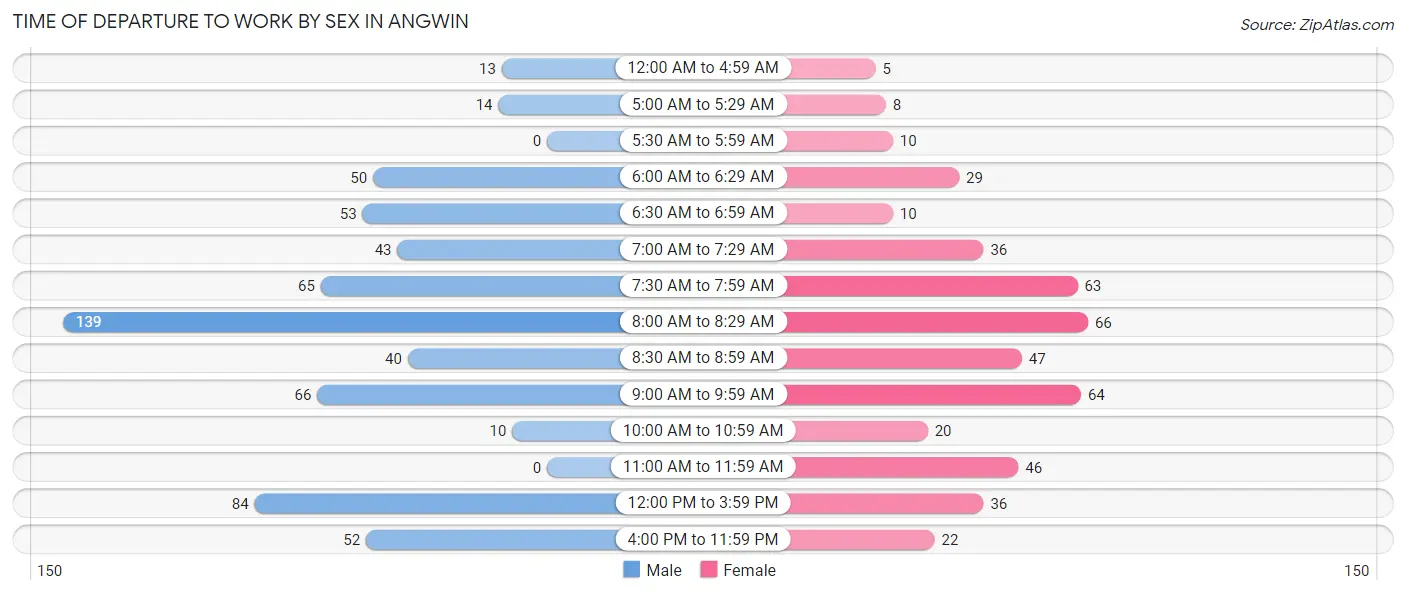
| Time of Departure | Male | Female |
| 12:00 AM to 4:59 AM | 13 (2.1%) | 5 (1.1%) |
| 5:00 AM to 5:29 AM | 14 (2.2%) | 8 (1.7%) |
| 5:30 AM to 5:59 AM | 0 (0.0%) | 10 (2.2%) |
| 6:00 AM to 6:29 AM | 50 (8.0%) | 29 (6.3%) |
| 6:30 AM to 6:59 AM | 53 (8.4%) | 10 (2.2%) |
| 7:00 AM to 7:29 AM | 43 (6.8%) | 36 (7.8%) |
| 7:30 AM to 7:59 AM | 65 (10.3%) | 63 (13.6%) |
| 8:00 AM to 8:29 AM | 139 (22.1%) | 66 (14.3%) |
| 8:30 AM to 8:59 AM | 40 (6.4%) | 47 (10.2%) |
| 9:00 AM to 9:59 AM | 66 (10.5%) | 64 (13.9%) |
| 10:00 AM to 10:59 AM | 10 (1.6%) | 20 (4.3%) |
| 11:00 AM to 11:59 AM | 0 (0.0%) | 46 (10.0%) |
| 12:00 PM to 3:59 PM | 84 (13.4%) | 36 (7.8%) |
| 4:00 PM to 11:59 PM | 52 (8.3%) | 22 (4.8%) |
| Total | 629 (100.0%) | 462 (100.0%) |
Housing Occupancy in Angwin
Occupancy by Ownership in Angwin
Of the total 741 dwellings in Angwin, owner-occupied units account for 469 (63.3%), while renter-occupied units make up 272 (36.7%).
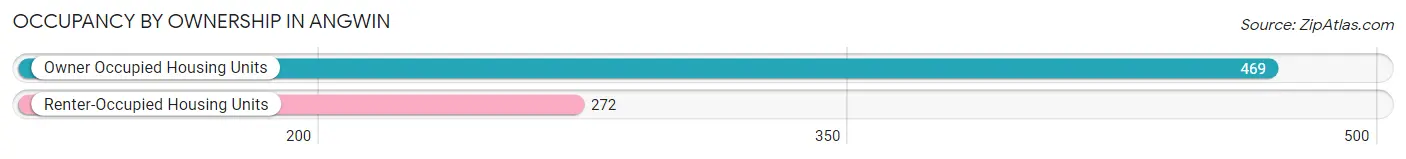
| Occupancy | # Housing Units | % Housing Units |
| Owner Occupied Housing Units | 469 | 63.3% |
| Renter-Occupied Housing Units | 272 | 36.7% |
| Total Occupied Housing Units | 741 | 100.0% |
Occupancy by Household Size in Angwin
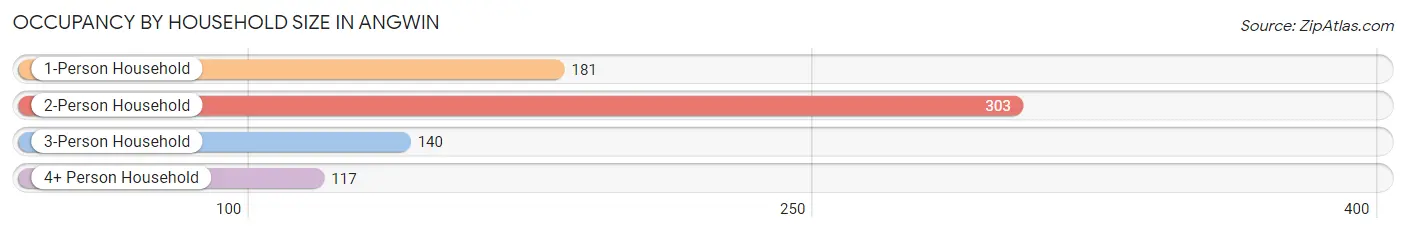
| Household Size | # Housing Units | % Housing Units |
| 1-Person Household | 181 | 24.4% |
| 2-Person Household | 303 | 40.9% |
| 3-Person Household | 140 | 18.9% |
| 4+ Person Household | 117 | 15.8% |
| Total Housing Units | 741 | 100.0% |
Occupancy by Ownership by Household Size in Angwin
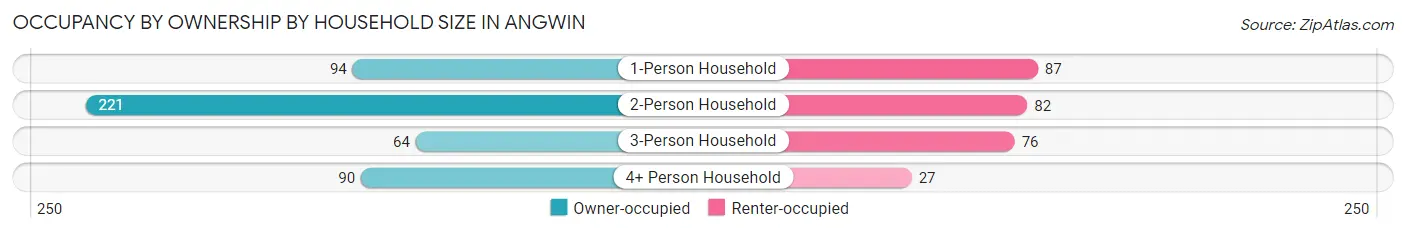
| Household Size | Owner-occupied | Renter-occupied |
| 1-Person Household | 94 (51.9%) | 87 (48.1%) |
| 2-Person Household | 221 (72.9%) | 82 (27.1%) |
| 3-Person Household | 64 (45.7%) | 76 (54.3%) |
| 4+ Person Household | 90 (76.9%) | 27 (23.1%) |
| Total Housing Units | 469 (63.3%) | 272 (36.7%) |
Occupancy by Educational Attainment in Angwin
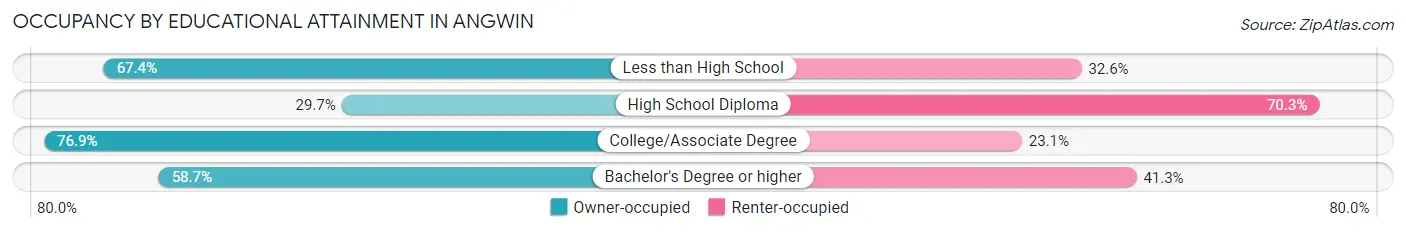
| Household Size | Owner-occupied | Renter-occupied |
| Less than High School | 29 (67.4%) | 14 (32.6%) |
| High School Diploma | 11 (29.7%) | 26 (70.3%) |
| College/Associate Degree | 173 (76.9%) | 52 (23.1%) |
| Bachelor's Degree or higher | 256 (58.7%) | 180 (41.3%) |
Occupancy by Age of Householder in Angwin
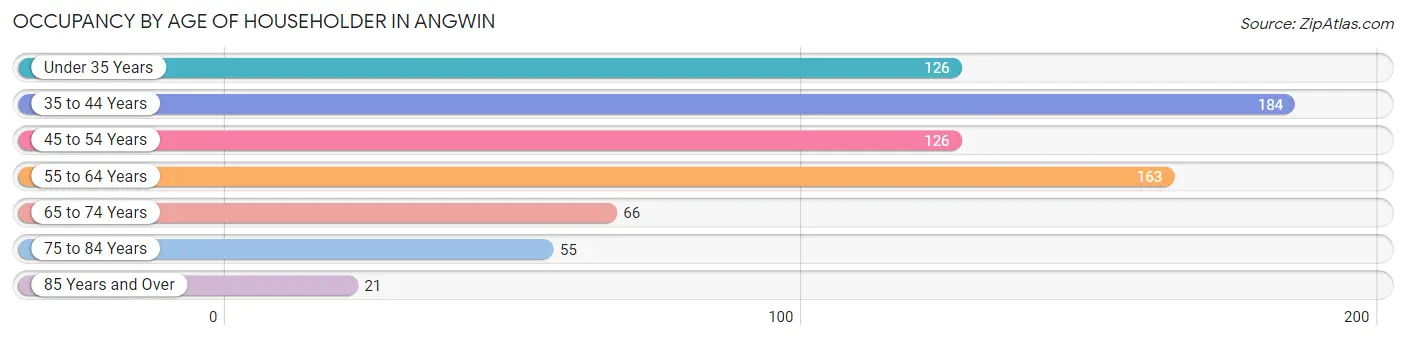
| Age Bracket | # Households | % Households |
| Under 35 Years | 126 | 17.0% |
| 35 to 44 Years | 184 | 24.8% |
| 45 to 54 Years | 126 | 17.0% |
| 55 to 64 Years | 163 | 22.0% |
| 65 to 74 Years | 66 | 8.9% |
| 75 to 84 Years | 55 | 7.4% |
| 85 Years and Over | 21 | 2.8% |
| Total | 741 | 100.0% |
Housing Finances in Angwin
Median Income by Occupancy in Angwin
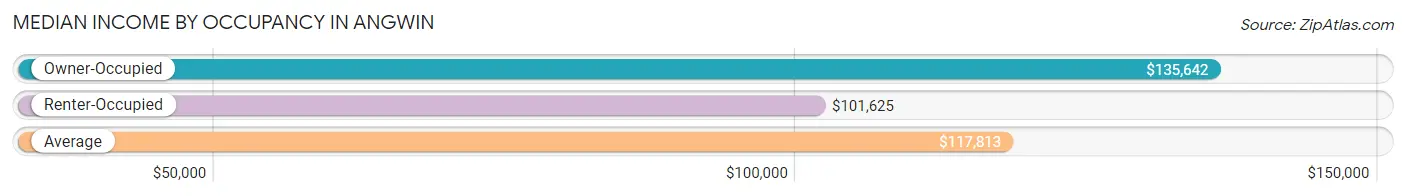
| Occupancy Type | # Households | Median Income |
| Owner-Occupied | 469 (63.3%) | $135,642 |
| Renter-Occupied | 272 (36.7%) | $101,625 |
| Average | 741 (100.0%) | $117,813 |
Occupancy by Householder Income Bracket in Angwin
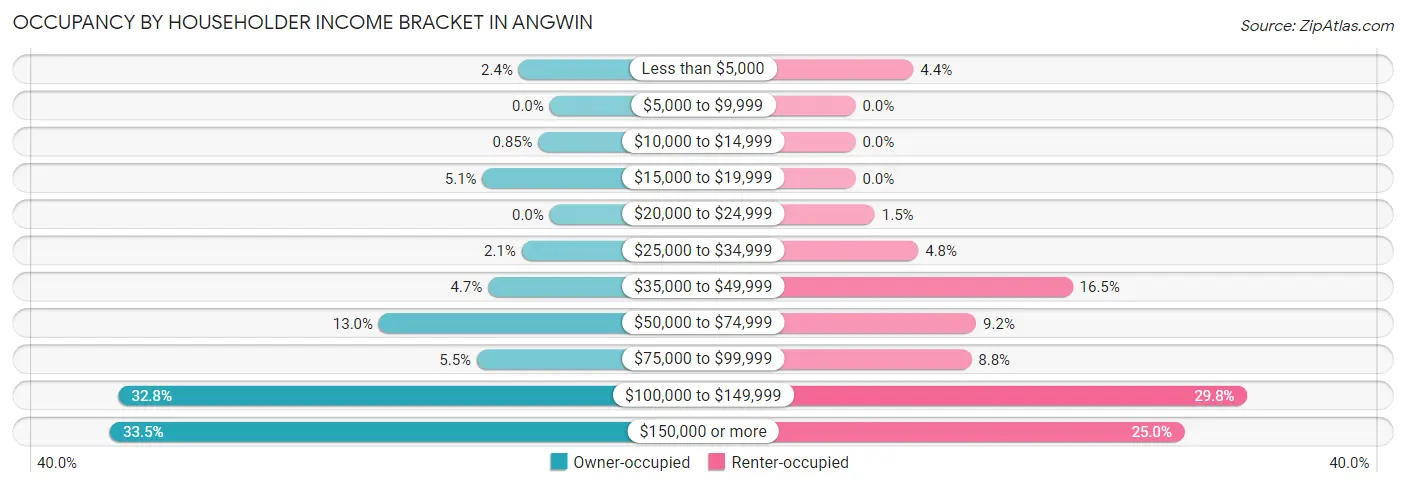
| Income Bracket | Owner-occupied | Renter-occupied |
| Less than $5,000 | 11 (2.4%) | 12 (4.4%) |
| $5,000 to $9,999 | 0 (0.0%) | 0 (0.0%) |
| $10,000 to $14,999 | 4 (0.9%) | 0 (0.0%) |
| $15,000 to $19,999 | 24 (5.1%) | 0 (0.0%) |
| $20,000 to $24,999 | 0 (0.0%) | 4 (1.5%) |
| $25,000 to $34,999 | 10 (2.1%) | 13 (4.8%) |
| $35,000 to $49,999 | 22 (4.7%) | 45 (16.5%) |
| $50,000 to $74,999 | 61 (13.0%) | 25 (9.2%) |
| $75,000 to $99,999 | 26 (5.5%) | 24 (8.8%) |
| $100,000 to $149,999 | 154 (32.8%) | 81 (29.8%) |
| $150,000 or more | 157 (33.5%) | 68 (25.0%) |
| Total | 469 (100.0%) | 272 (100.0%) |
Monthly Housing Cost Tiers in Angwin
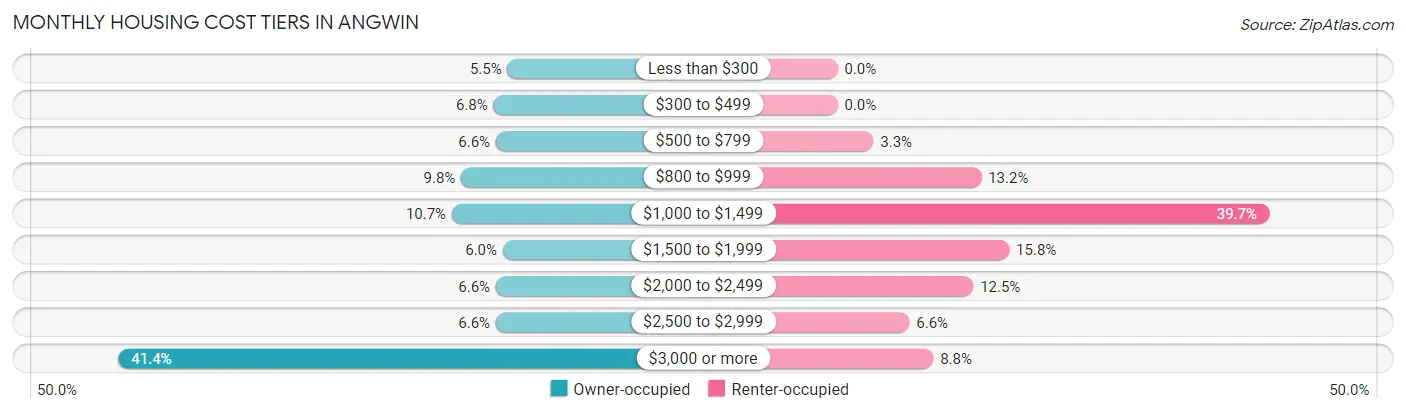
| Monthly Cost | Owner-occupied | Renter-occupied |
| Less than $300 | 26 (5.5%) | 0 (0.0%) |
| $300 to $499 | 32 (6.8%) | 0 (0.0%) |
| $500 to $799 | 31 (6.6%) | 9 (3.3%) |
| $800 to $999 | 46 (9.8%) | 36 (13.2%) |
| $1,000 to $1,499 | 50 (10.7%) | 108 (39.7%) |
| $1,500 to $1,999 | 28 (6.0%) | 43 (15.8%) |
| $2,000 to $2,499 | 31 (6.6%) | 34 (12.5%) |
| $2,500 to $2,999 | 31 (6.6%) | 18 (6.6%) |
| $3,000 or more | 194 (41.4%) | 24 (8.8%) |
| Total | 469 (100.0%) | 272 (100.0%) |
Physical Housing Characteristics in Angwin
Housing Structures in Angwin
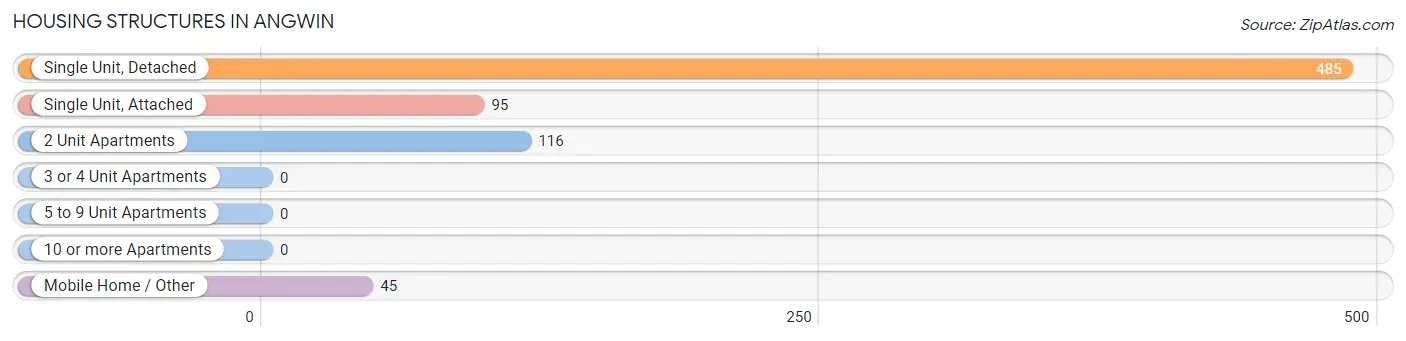
| Structure Type | # Housing Units | % Housing Units |
| Single Unit, Detached | 485 | 65.4% |
| Single Unit, Attached | 95 | 12.8% |
| 2 Unit Apartments | 116 | 15.7% |
| 3 or 4 Unit Apartments | 0 | 0.0% |
| 5 to 9 Unit Apartments | 0 | 0.0% |
| 10 or more Apartments | 0 | 0.0% |
| Mobile Home / Other | 45 | 6.1% |
| Total | 741 | 100.0% |
Housing Structures by Occupancy in Angwin
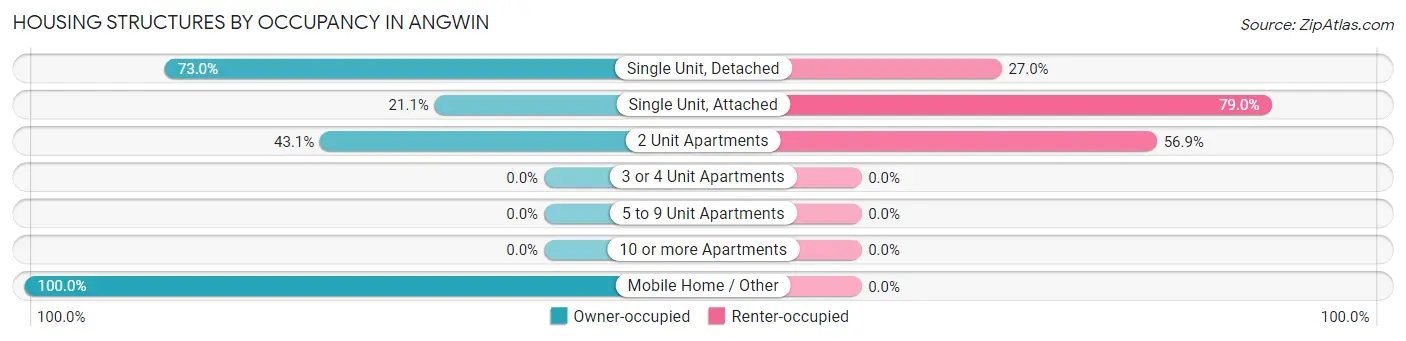
| Structure Type | Owner-occupied | Renter-occupied |
| Single Unit, Detached | 354 (73.0%) | 131 (27.0%) |
| Single Unit, Attached | 20 (21.0%) | 75 (78.9%) |
| 2 Unit Apartments | 50 (43.1%) | 66 (56.9%) |
| 3 or 4 Unit Apartments | 0 (0.0%) | 0 (0.0%) |
| 5 to 9 Unit Apartments | 0 (0.0%) | 0 (0.0%) |
| 10 or more Apartments | 0 (0.0%) | 0 (0.0%) |
| Mobile Home / Other | 45 (100.0%) | 0 (0.0%) |
| Total | 469 (63.3%) | 272 (36.7%) |
Housing Structures by Number of Rooms in Angwin
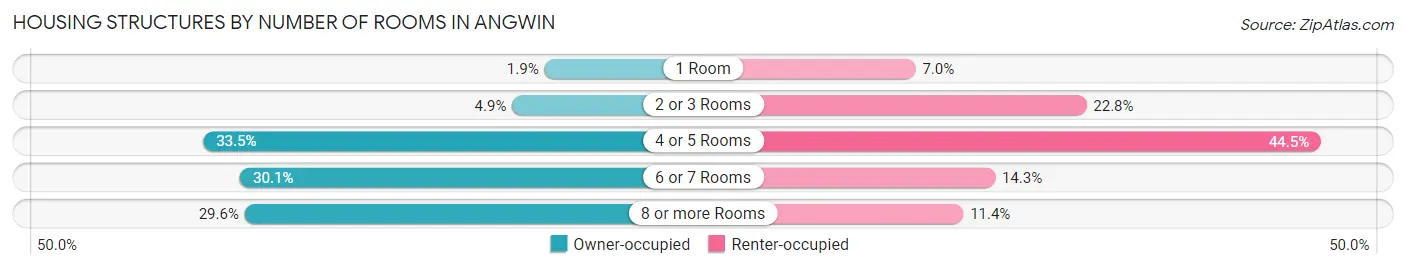
| Number of Rooms | Owner-occupied | Renter-occupied |
| 1 Room | 9 (1.9%) | 19 (7.0%) |
| 2 or 3 Rooms | 23 (4.9%) | 62 (22.8%) |
| 4 or 5 Rooms | 157 (33.5%) | 121 (44.5%) |
| 6 or 7 Rooms | 141 (30.1%) | 39 (14.3%) |
| 8 or more Rooms | 139 (29.6%) | 31 (11.4%) |
| Total | 469 (100.0%) | 272 (100.0%) |
Housing Structure by Heating Type in Angwin
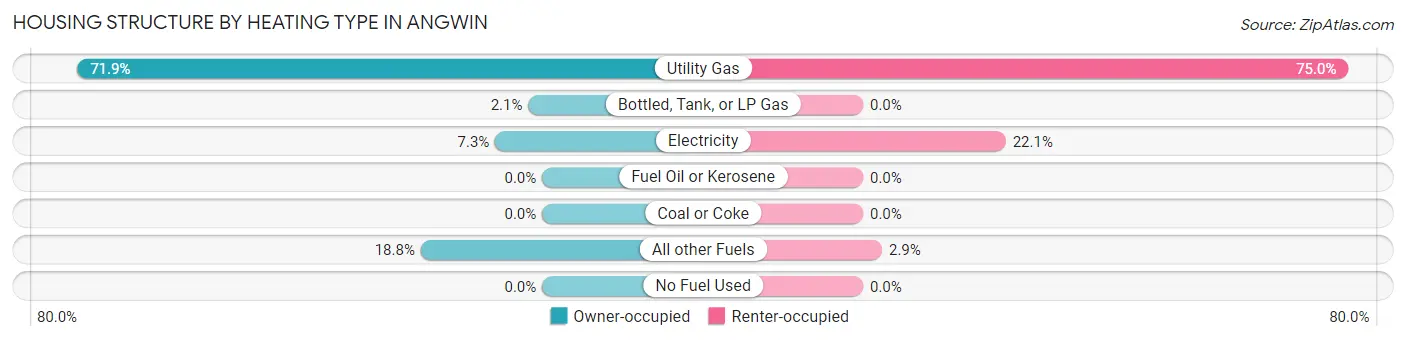
| Heating Type | Owner-occupied | Renter-occupied |
| Utility Gas | 337 (71.9%) | 204 (75.0%) |
| Bottled, Tank, or LP Gas | 10 (2.1%) | 0 (0.0%) |
| Electricity | 34 (7.2%) | 60 (22.1%) |
| Fuel Oil or Kerosene | 0 (0.0%) | 0 (0.0%) |
| Coal or Coke | 0 (0.0%) | 0 (0.0%) |
| All other Fuels | 88 (18.8%) | 8 (2.9%) |
| No Fuel Used | 0 (0.0%) | 0 (0.0%) |
| Total | 469 (100.0%) | 272 (100.0%) |
Household Vehicle Usage in Angwin
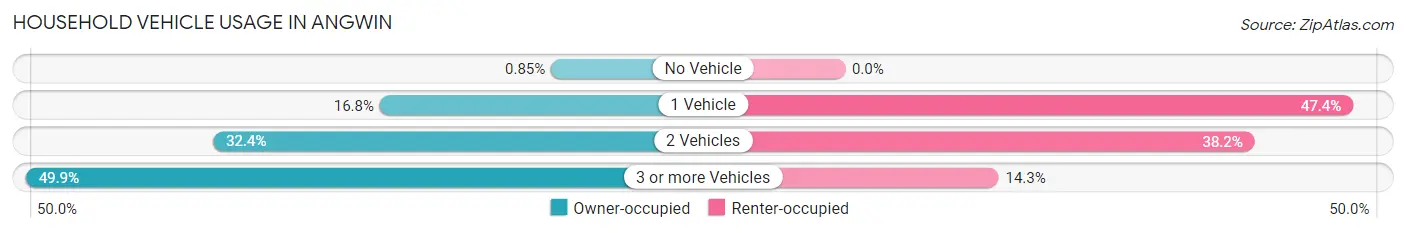
| Vehicles per Household | Owner-occupied | Renter-occupied |
| No Vehicle | 4 (0.9%) | 0 (0.0%) |
| 1 Vehicle | 79 (16.8%) | 129 (47.4%) |
| 2 Vehicles | 152 (32.4%) | 104 (38.2%) |
| 3 or more Vehicles | 234 (49.9%) | 39 (14.3%) |
| Total | 469 (100.0%) | 272 (100.0%) |
Real Estate & Mortgages in Angwin
Real Estate and Mortgage Overview in Angwin
| Characteristic | Without Mortgage | With Mortgage |
| Housing Units | 140 | 329 |
| Median Property Value | $791,700 | $665,800 |
| Median Household Income | $59,688 | $154 |
| Monthly Housing Costs | $650 | $190 |
| Real Estate Taxes | $3,500 | $4 |
Property Value by Mortgage Status in Angwin
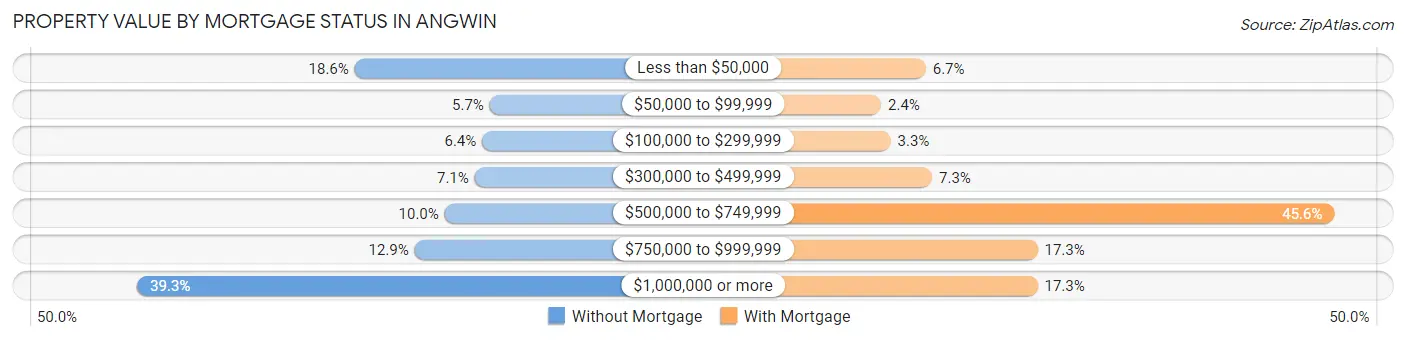
| Property Value | Without Mortgage | With Mortgage |
| Less than $50,000 | 26 (18.6%) | 22 (6.7%) |
| $50,000 to $99,999 | 8 (5.7%) | 8 (2.4%) |
| $100,000 to $299,999 | 9 (6.4%) | 11 (3.3%) |
| $300,000 to $499,999 | 10 (7.1%) | 24 (7.3%) |
| $500,000 to $749,999 | 14 (10.0%) | 150 (45.6%) |
| $750,000 to $999,999 | 18 (12.9%) | 57 (17.3%) |
| $1,000,000 or more | 55 (39.3%) | 57 (17.3%) |
| Total | 140 (100.0%) | 329 (100.0%) |
Household Income by Mortgage Status in Angwin
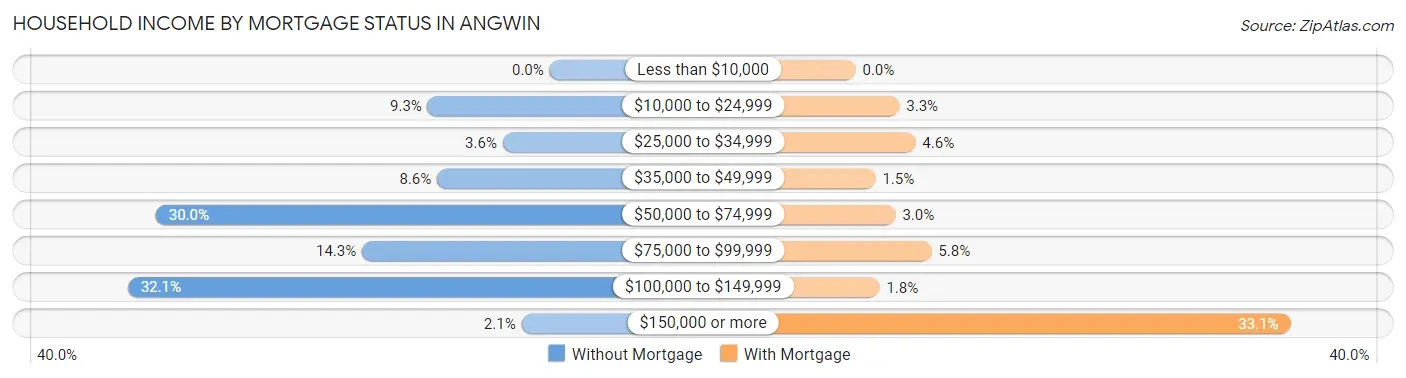
| Household Income | Without Mortgage | With Mortgage |
| Less than $10,000 | 0 (0.0%) | 0 (0.0%) |
| $10,000 to $24,999 | 13 (9.3%) | 11 (3.3%) |
| $25,000 to $34,999 | 5 (3.6%) | 15 (4.6%) |
| $35,000 to $49,999 | 12 (8.6%) | 5 (1.5%) |
| $50,000 to $74,999 | 42 (30.0%) | 10 (3.0%) |
| $75,000 to $99,999 | 20 (14.3%) | 19 (5.8%) |
| $100,000 to $149,999 | 45 (32.1%) | 6 (1.8%) |
| $150,000 or more | 3 (2.1%) | 109 (33.1%) |
| Total | 140 (100.0%) | 329 (100.0%) |
Property Value to Household Income Ratio in Angwin
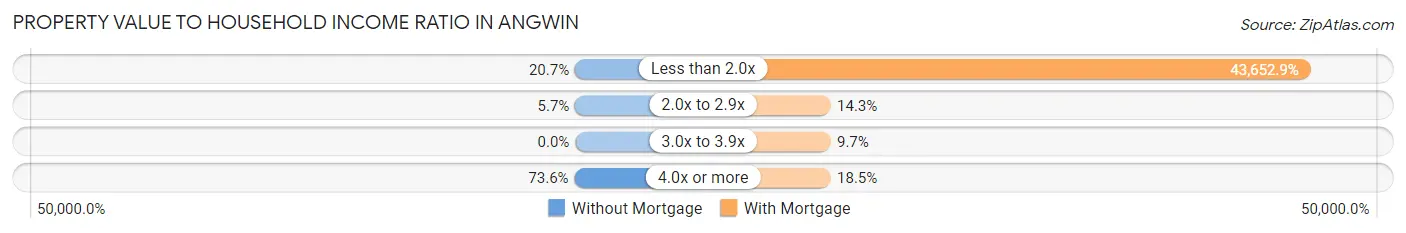
| Value-to-Income Ratio | Without Mortgage | With Mortgage |
| Less than 2.0x | 29 (20.7%) | 143,618 (43,652.9%) |
| 2.0x to 2.9x | 8 (5.7%) | 47 (14.3%) |
| 3.0x to 3.9x | 0 (0.0%) | 32 (9.7%) |
| 4.0x or more | 103 (73.6%) | 61 (18.5%) |
| Total | 140 (100.0%) | 329 (100.0%) |
Real Estate Taxes by Mortgage Status in Angwin
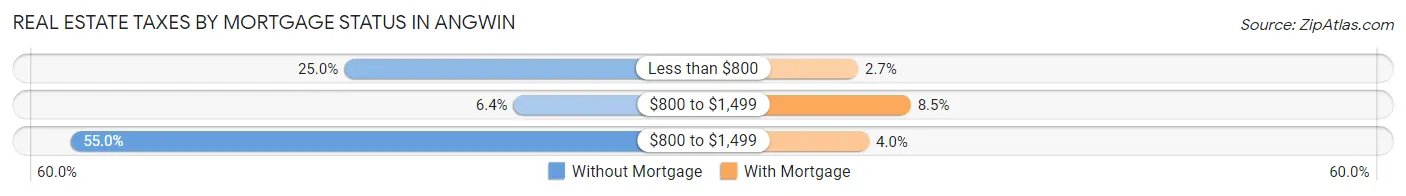
| Property Taxes | Without Mortgage | With Mortgage |
| Less than $800 | 35 (25.0%) | 9 (2.7%) |
| $800 to $1,499 | 9 (6.4%) | 28 (8.5%) |
| $800 to $1,499 | 77 (55.0%) | 13 (4.0%) |
| Total | 140 (100.0%) | 329 (100.0%) |
Health & Disability in Angwin
Health Insurance Coverage by Age in Angwin
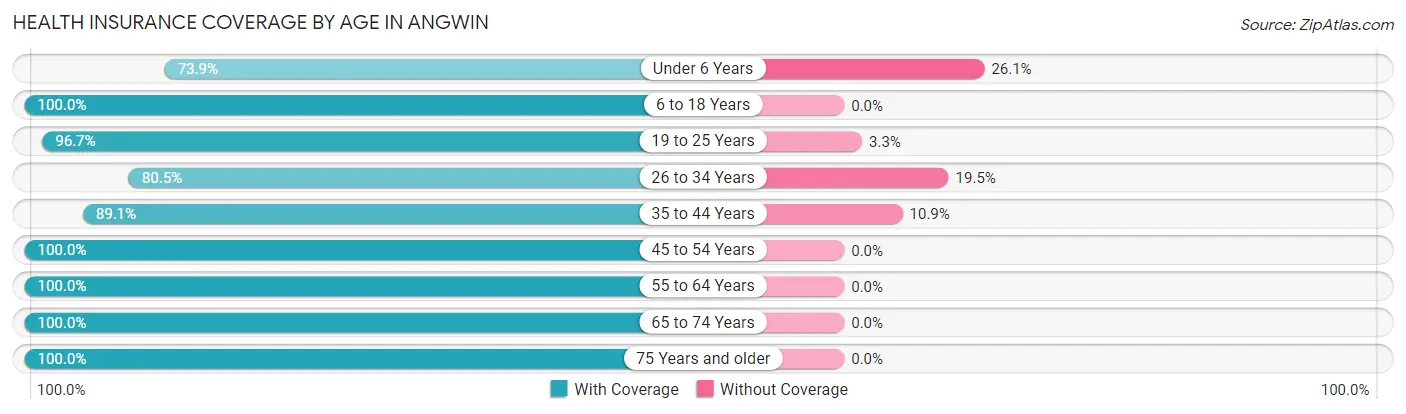
| Age Bracket | With Coverage | Without Coverage |
| Under 6 Years | 65 (73.9%) | 23 (26.1%) |
| 6 to 18 Years | 558 (100.0%) | 0 (0.0%) |
| 19 to 25 Years | 729 (96.7%) | 25 (3.3%) |
| 26 to 34 Years | 178 (80.5%) | 43 (19.5%) |
| 35 to 44 Years | 287 (89.1%) | 35 (10.9%) |
| 45 to 54 Years | 240 (100.0%) | 0 (0.0%) |
| 55 to 64 Years | 281 (100.0%) | 0 (0.0%) |
| 65 to 74 Years | 142 (100.0%) | 0 (0.0%) |
| 75 Years and older | 125 (100.0%) | 0 (0.0%) |
| Total | 2,605 (95.4%) | 126 (4.6%) |
Health Insurance Coverage by Citizenship Status in Angwin
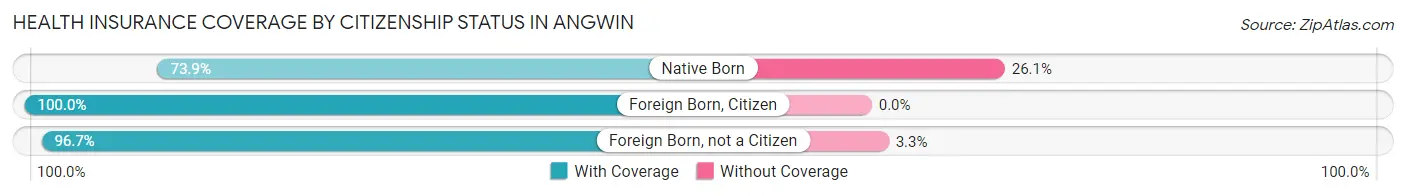
| Citizenship Status | With Coverage | Without Coverage |
| Native Born | 65 (73.9%) | 23 (26.1%) |
| Foreign Born, Citizen | 558 (100.0%) | 0 (0.0%) |
| Foreign Born, not a Citizen | 729 (96.7%) | 25 (3.3%) |
Health Insurance Coverage by Household Income in Angwin
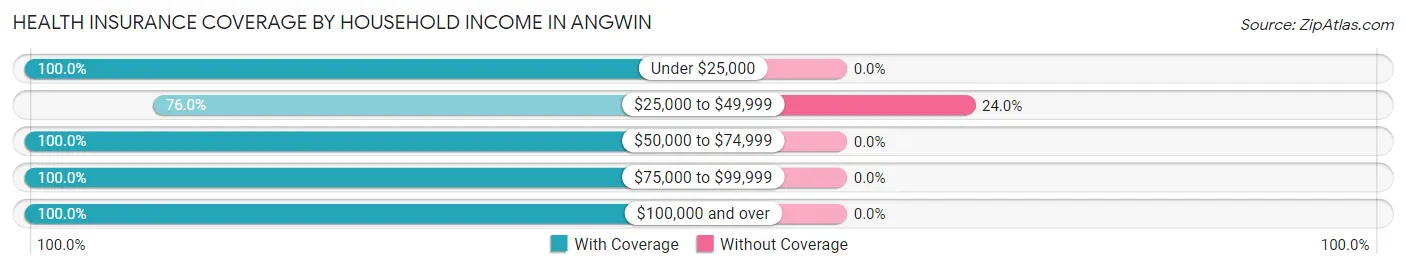
| Household Income | With Coverage | Without Coverage |
| Under $25,000 | 95 (100.0%) | 0 (0.0%) |
| $25,000 to $49,999 | 117 (76.0%) | 37 (24.0%) |
| $50,000 to $74,999 | 145 (100.0%) | 0 (0.0%) |
| $75,000 to $99,999 | 93 (100.0%) | 0 (0.0%) |
| $100,000 and over | 1,275 (100.0%) | 0 (0.0%) |
Public vs Private Health Insurance Coverage by Age in Angwin
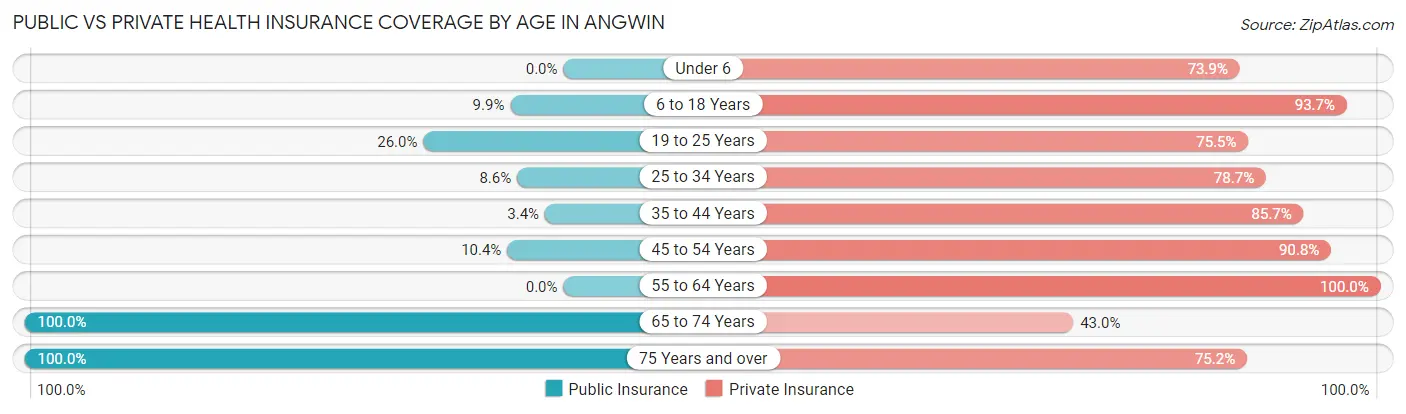
| Age Bracket | Public Insurance | Private Insurance |
| Under 6 | 0 (0.0%) | 65 (73.9%) |
| 6 to 18 Years | 55 (9.9%) | 523 (93.7%) |
| 19 to 25 Years | 196 (26.0%) | 569 (75.5%) |
| 25 to 34 Years | 19 (8.6%) | 174 (78.7%) |
| 35 to 44 Years | 11 (3.4%) | 276 (85.7%) |
| 45 to 54 Years | 25 (10.4%) | 218 (90.8%) |
| 55 to 64 Years | 0 (0.0%) | 281 (100.0%) |
| 65 to 74 Years | 142 (100.0%) | 61 (43.0%) |
| 75 Years and over | 125 (100.0%) | 94 (75.2%) |
| Total | 573 (21.0%) | 2,261 (82.8%) |
Disability Status by Sex by Age in Angwin
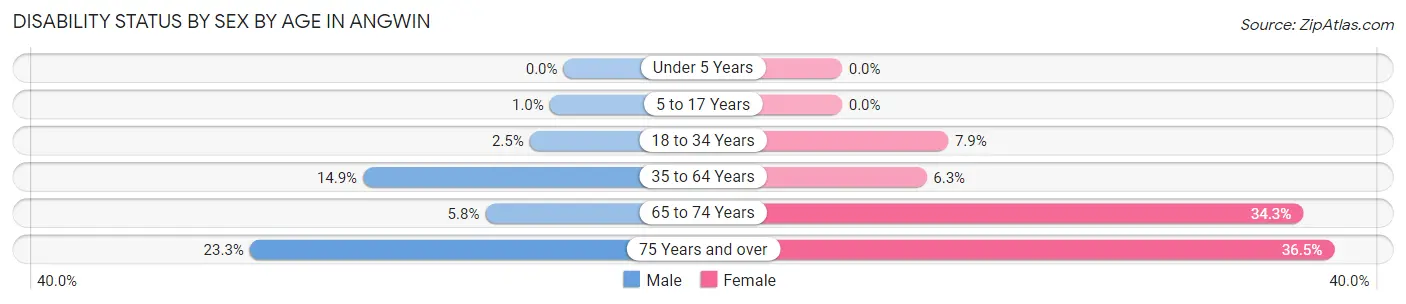
| Age Bracket | Male | Female |
| Under 5 Years | 0 (0.0%) | 0 (0.0%) |
| 5 to 17 Years | 2 (1.0%) | 0 (0.0%) |
| 18 to 34 Years | 16 (2.5%) | 45 (7.9%) |
| 35 to 64 Years | 71 (14.9%) | 23 (6.3%) |
| 65 to 74 Years | 4 (5.8%) | 25 (34.3%) |
| 75 Years and over | 17 (23.3%) | 19 (36.5%) |
Disability Class by Sex by Age in Angwin
Disability Class: Hearing Difficulty
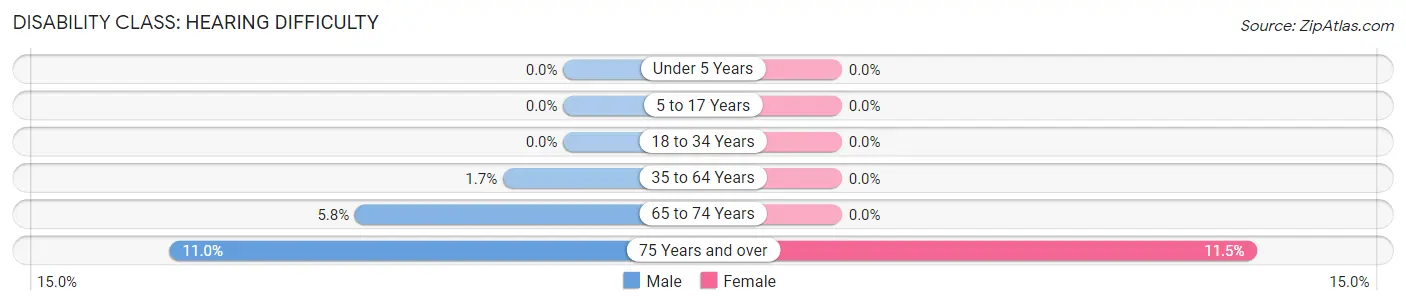
| Age Bracket | Male | Female |
| Under 5 Years | 0 (0.0%) | 0 (0.0%) |
| 5 to 17 Years | 0 (0.0%) | 0 (0.0%) |
| 18 to 34 Years | 0 (0.0%) | 0 (0.0%) |
| 35 to 64 Years | 8 (1.7%) | 0 (0.0%) |
| 65 to 74 Years | 4 (5.8%) | 0 (0.0%) |
| 75 Years and over | 8 (11.0%) | 6 (11.5%) |
Disability Class: Vision Difficulty
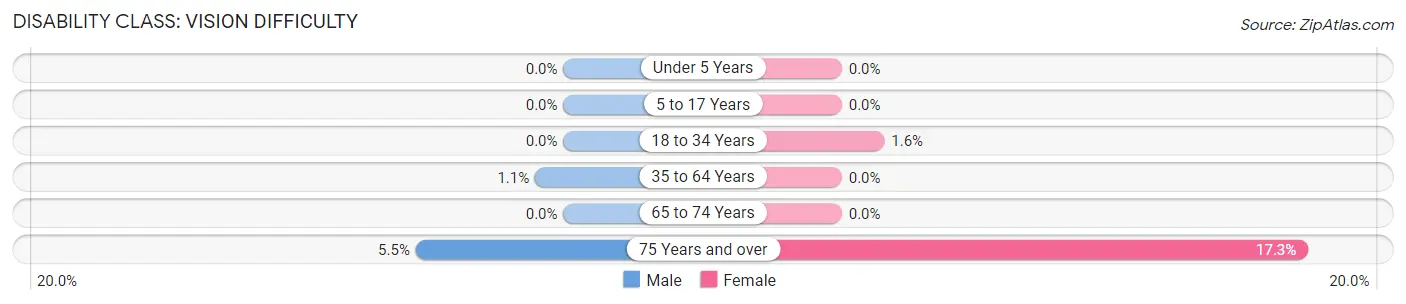
| Age Bracket | Male | Female |
| Under 5 Years | 0 (0.0%) | 0 (0.0%) |
| 5 to 17 Years | 0 (0.0%) | 0 (0.0%) |
| 18 to 34 Years | 0 (0.0%) | 9 (1.6%) |
| 35 to 64 Years | 5 (1.1%) | 0 (0.0%) |
| 65 to 74 Years | 0 (0.0%) | 0 (0.0%) |
| 75 Years and over | 4 (5.5%) | 9 (17.3%) |
Disability Class: Cognitive Difficulty
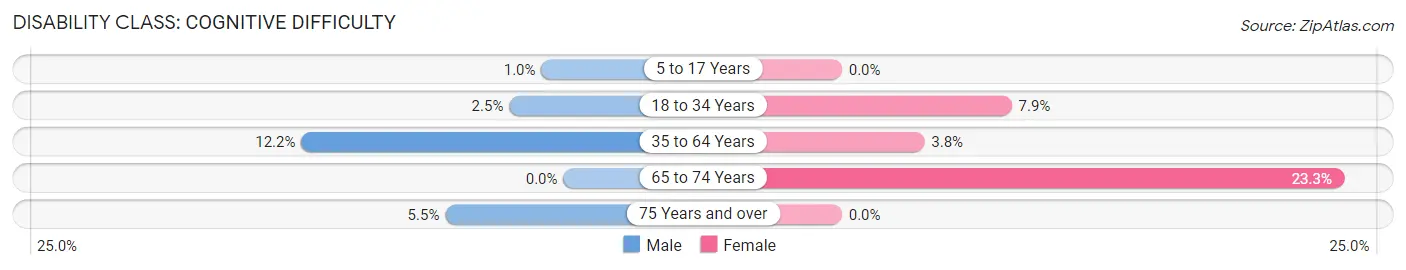
| Age Bracket | Male | Female |
| 5 to 17 Years | 2 (1.0%) | 0 (0.0%) |
| 18 to 34 Years | 16 (2.5%) | 45 (7.9%) |
| 35 to 64 Years | 58 (12.2%) | 14 (3.8%) |
| 65 to 74 Years | 0 (0.0%) | 17 (23.3%) |
| 75 Years and over | 4 (5.5%) | 0 (0.0%) |
Disability Class: Ambulatory Difficulty
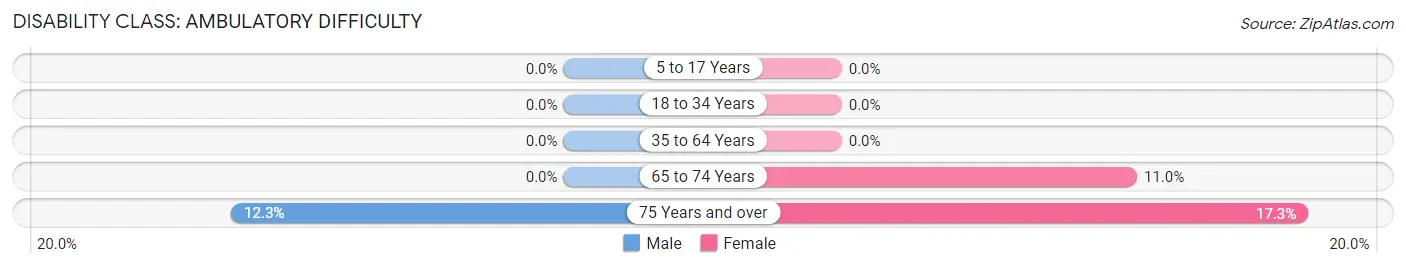
| Age Bracket | Male | Female |
| 5 to 17 Years | 0 (0.0%) | 0 (0.0%) |
| 18 to 34 Years | 0 (0.0%) | 0 (0.0%) |
| 35 to 64 Years | 0 (0.0%) | 0 (0.0%) |
| 65 to 74 Years | 0 (0.0%) | 8 (11.0%) |
| 75 Years and over | 9 (12.3%) | 9 (17.3%) |
Disability Class: Self-Care Difficulty
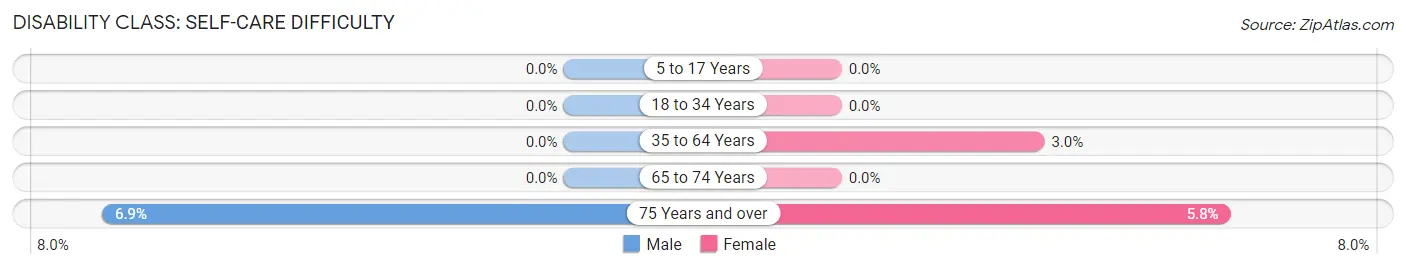
| Age Bracket | Male | Female |
| 5 to 17 Years | 0 (0.0%) | 0 (0.0%) |
| 18 to 34 Years | 0 (0.0%) | 0 (0.0%) |
| 35 to 64 Years | 0 (0.0%) | 11 (3.0%) |
| 65 to 74 Years | 0 (0.0%) | 0 (0.0%) |
| 75 Years and over | 5 (6.9%) | 3 (5.8%) |
Technology Access in Angwin
Computing Device Access in Angwin
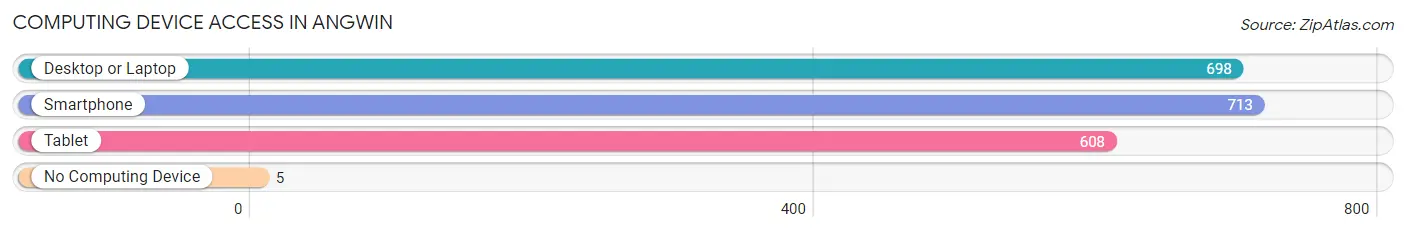
| Device Type | # Households | % Households |
| Desktop or Laptop | 698 | 94.2% |
| Smartphone | 713 | 96.2% |
| Tablet | 608 | 82.1% |
| No Computing Device | 5 | 0.7% |
| Total | 741 | 100.0% |
Internet Access in Angwin
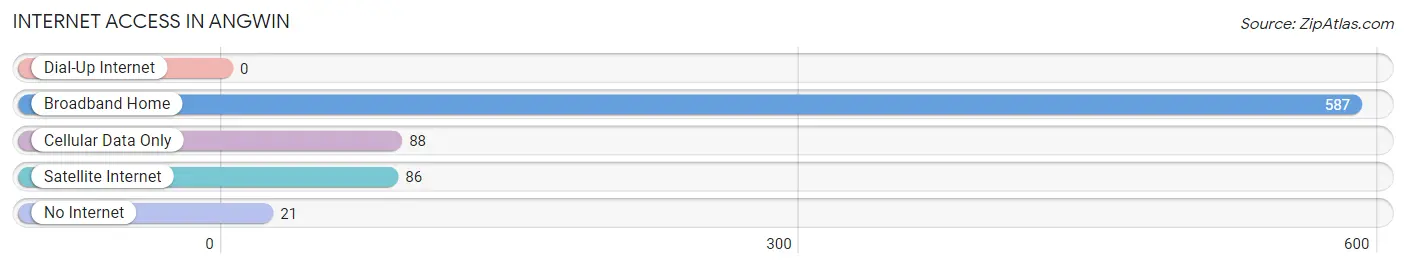
| Internet Type | # Households | % Households |
| Dial-Up Internet | 0 | 0.0% |
| Broadband Home | 587 | 79.2% |
| Cellular Data Only | 88 | 11.9% |
| Satellite Internet | 86 | 11.6% |
| No Internet | 21 | 2.8% |
| Total | 741 | 100.0% |
Angwin Summary
Angwin, California is a small unincorporated community located in Napa County, California. It is situated in the hills of the Mayacamas Mountains, approximately 6 miles (9.7 km) east of the city of St. Helena. The population of Angwin was 3,819 at the 2010 census.
Geography
Angwin is located at 38°32'25" North, 122°27'45" West (38.540278, -122.4625). It is situated in the hills of the Mayacamas Mountains, approximately 6 miles (9.7 km) east of the city of St. Helena. The elevation of Angwin is 1,890 feet (576 m).
The town is located in the Vaca Mountains, which are part of the California Coast Ranges. The terrain is mostly rolling hills, with some steep slopes. The area is heavily forested, with oak, madrone, and Douglas fir trees.
Climate
Angwin has a Mediterranean climate, with hot, dry summers and cool, wet winters. The average annual temperature is 57°F (14°C). The average annual precipitation is 33.5 inches (850 mm).
Demographics
As of the 2010 census, there were 3,819 people, 1,093 households, and 845 families residing in Angwin. The population density was 1,072.3 people per square mile (414.7/km2). The racial makeup of Angwin was 87.2% White, 0.7% African American, 0.3% Native American, 8.2% Asian, 0.1% Pacific Islander, 0.9% from other races, and 2.6% from two or more races. Hispanic or Latino of any race were 4.2% of the population.
Economy
The economy of Angwin is largely based on tourism and education. The town is home to Pacific Union College, a private liberal arts college affiliated with the Seventh-day Adventist Church. The college is the largest employer in the town, and provides a significant portion of the local economy.
The town is also home to several wineries, including the Robert Mondavi Winery, which is located just outside of town. The wineries attract tourists from all over the world, and provide a significant source of income for the town.
In addition, Angwin is home to several small businesses, including restaurants, shops, and galleries. These businesses provide employment for local residents and attract visitors to the town.
Conclusion
Angwin, California is a small unincorporated community located in Napa County, California. It is situated in the hills of the Mayacamas Mountains, approximately 6 miles (9.7 km) east of the city of St. Helena. The population of Angwin was 3,819 at the 2010 census. The town is located in the Vaca Mountains, which are part of the California Coast Ranges. The terrain is mostly rolling hills, with some steep slopes. The area is heavily forested, with oak, madrone, and Douglas fir trees. Angwin has a Mediterranean climate, with hot, dry summers and cool, wet winters. The economy of Angwin is largely based on tourism and education. The town is home to Pacific Union College, a private liberal arts college affiliated with the Seventh-day Adventist Church. The college is the largest employer in the town, and provides a significant portion of the local economy. In addition, Angwin is home to several wineries, small businesses, and restaurants. These businesses provide employment for local residents and attract visitors to the town.
Common Questions
What is Per Capita Income in Angwin?
Per Capita income in Angwin is $41,599.
What is the Median Family Income in Angwin?
Median Family Income in Angwin is $133,438.
What is the Median Household income in Angwin?
Median Household Income in Angwin is $117,813.
What is Inequality or Gini Index in Angwin?
Inequality or Gini Index in Angwin is 0.43.
What is the Total Population of Angwin?
Total Population of Angwin is 2,731.
What is the Total Male Population of Angwin?
Total Male Population of Angwin is 1,476.
What is the Total Female Population of Angwin?
Total Female Population of Angwin is 1,255.
What is the Ratio of Males per 100 Females in Angwin?
There are 117.61 Males per 100 Females in Angwin.
What is the Ratio of Females per 100 Males in Angwin?
There are 85.03 Females per 100 Males in Angwin.
What is the Median Population Age in Angwin?
Median Population Age in Angwin is 24.7 Years.
What is the Average Family Size in Angwin
Average Family Size in Angwin is 3.0 People.
What is the Average Household Size in Angwin
Average Household Size in Angwin is 2.4 People.
How Large is the Labor Force in Angwin?
There are 1,504 People in the Labor Forcein in Angwin.
What is the Percentage of People in the Labor Force in Angwin?
62.7% of People are in the Labor Force in Angwin.
What is the Unemployment Rate in Angwin?
Unemployment Rate in Angwin is 5.8%.