Cities with the Highest Percentage of African Population in Connecticut
RELATED REPORTS & OPTIONS
African
Connecticut
Compare Cities
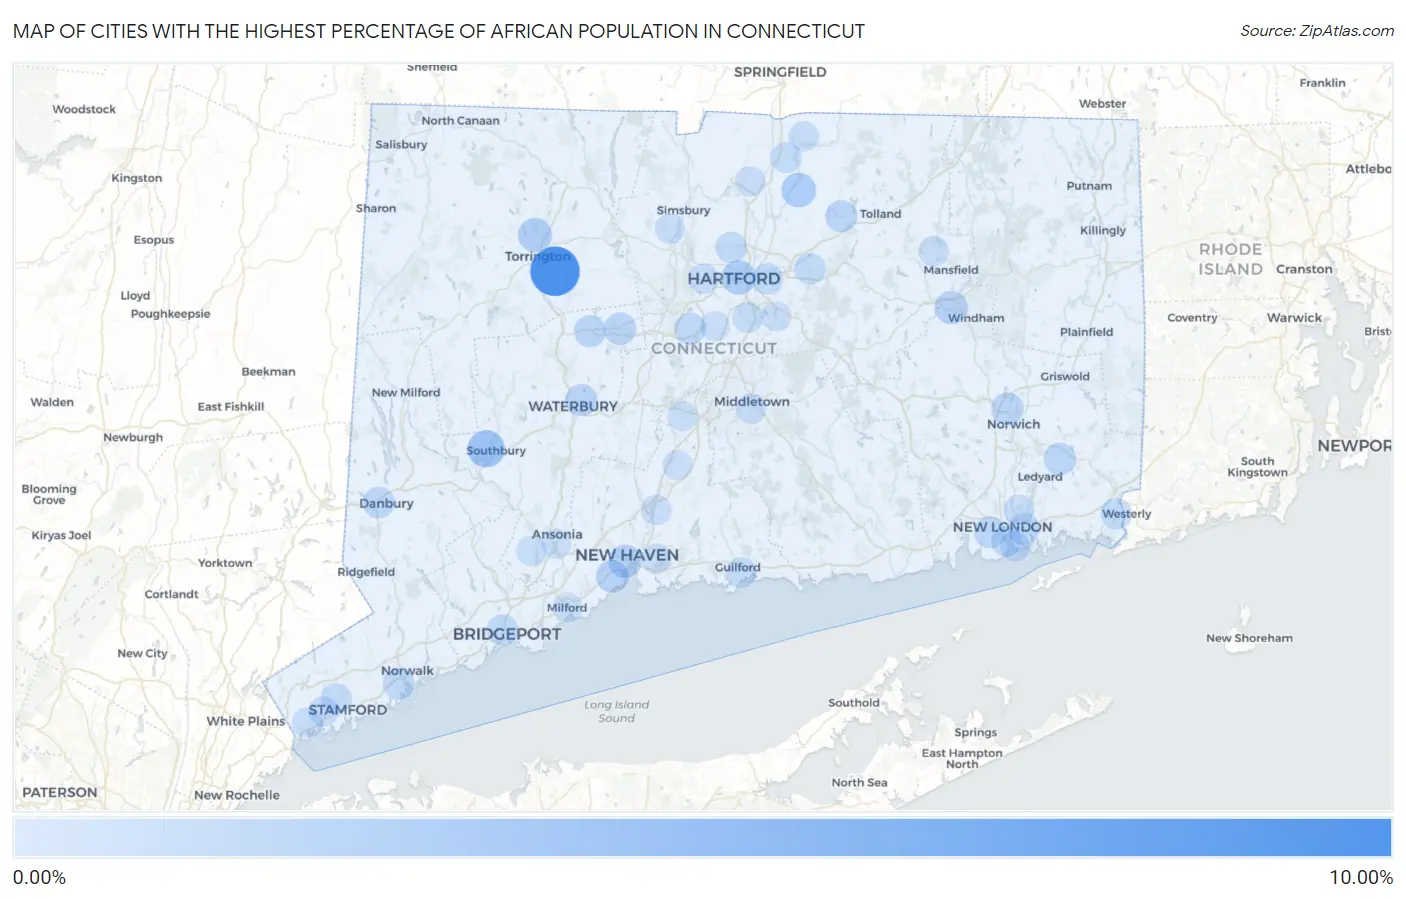
Map of Cities with the Highest Percentage of African Population in Connecticut
0.00%
10.00%
Cities with the Highest Percentage of African Population in Connecticut
| City | African | vs State | vs National | |
| 1. | Northwest Harwinton | 8.59% | 0.51%(+8.08)#1 | 0.57%(+8.02)#133 |
| 2. | Heritage Village | 2.99% | 0.51%(+2.48)#2 | 0.57%(+2.43)#628 |
| 3. | Naugatuck Borough | 2.69% | 0.51%(+2.18)#3 | 0.57%(+2.13)#715 |
| 4. | Broad Brook | 1.87% | 0.51%(+1.36)#4 | 0.57%(+1.31)#1,109 |
| 5. | Hartford | 1.81% | 0.51%(+1.30)#5 | 0.57%(+1.25)#1,140 |
| 6. | Trumbull Center | 1.77% | 0.51%(+1.26)#6 | 0.57%(+1.21)#1,171 |
| 7. | Torrington | 1.68% | 0.51%(+1.17)#7 | 0.57%(+1.11)#1,243 |
| 8. | New Haven | 1.35% | 0.51%(+0.844)#8 | 0.57%(+0.789)#1,594 |
| 9. | Willimantic | 1.33% | 0.51%(+0.824)#9 | 0.57%(+0.769)#1,623 |
| 10. | Litchfield Borough | 1.25% | 0.51%(+0.745)#10 | 0.57%(+0.689)#1,742 |
| 11. | West Haven | 1.17% | 0.51%(+0.665)#11 | 0.57%(+0.609)#1,848 |
| 12. | Bristol | 0.99% | 0.51%(+0.484)#12 | 0.57%(+0.429)#2,147 |
| 13. | Mashantucket | 0.96% | 0.51%(+0.452)#13 | 0.57%(+0.396)#2,210 |
| 14. | Norwich | 0.95% | 0.51%(+0.441)#14 | 0.57%(+0.386)#2,232 |
| 15. | Waterbury | 0.88% | 0.51%(+0.372)#15 | 0.57%(+0.317)#2,378 |
| 16. | Rockville | 0.82% | 0.51%(+0.310)#16 | 0.57%(+0.255)#2,532 |
| 17. | Terryville | 0.80% | 0.51%(+0.290)#17 | 0.57%(+0.235)#2,583 |
| 18. | Fairfield University | 0.76% | 0.51%(+0.247)#18 | 0.57%(+0.192)#2,729 |
| 19. | New Britain | 0.73% | 0.51%(+0.224)#19 | 0.57%(+0.169)#2,784 |
| 20. | Norwalk | 0.69% | 0.51%(+0.179)#20 | 0.57%(+0.123)#2,920 |
| 21. | Long Hill | 0.69% | 0.51%(+0.176)#21 | 0.57%(+0.120)#2,931 |
| 22. | Waterford | 0.67% | 0.51%(+0.162)#22 | 0.57%(+0.106)#2,976 |
| 23. | Danbury | 0.66% | 0.51%(+0.152)#23 | 0.57%(+0.096)#3,005 |
| 24. | Manchester | 0.63% | 0.51%(+0.125)#24 | 0.57%(+0.070)#3,103 |
| 25. | Bridgeport | 0.60% | 0.51%(+0.086)#25 | 0.57%(+0.031)#3,250 |
| 26. | Pawcatuck | 0.59% | 0.51%(+0.082)#26 | 0.57%(+0.027)#3,264 |
| 27. | Blue Hills | 0.58% | 0.51%(+0.075)#27 | 0.57%(+0.019)#3,294 |
| 28. | Noroton | 0.57% | 0.51%(+0.061)#28 | 0.57%(+0.006)#3,351 |
| 29. | Quinnipiac University | 0.57% | 0.51%(+0.058)#29 | 0.57%(+0.003)#3,358 |
| 30. | Stratford Downtown | 0.56% | 0.51%(+0.054)#30 | 0.57%(-0.001)#3,385 |
| 31. | East Hartford | 0.52% | 0.51%(+0.006)#31 | 0.57%(-0.049)#3,566 |
| 32. | Stamford | 0.49% | 0.51%(-0.020)#32 | 0.57%(-0.075)#3,682 |
| 33. | Southwood Acres | 0.43% | 0.51%(-0.081)#33 | 0.57%(-0.137)#4,004 |
| 34. | New London | 0.39% | 0.51%(-0.122)#34 | 0.57%(-0.178)#4,211 |
| 35. | Oronoque | 0.34% | 0.51%(-0.166)#35 | 0.57%(-0.221)#4,443 |
| 36. | Wethersfield | 0.27% | 0.51%(-0.238)#36 | 0.57%(-0.293)#4,885 |
| 37. | Guilford Center | 0.24% | 0.51%(-0.274)#37 | 0.57%(-0.329)#5,174 |
| 38. | Groton | 0.21% | 0.51%(-0.296)#38 | 0.57%(-0.352)#5,349 |
| 39. | Middletown | 0.19% | 0.51%(-0.323)#39 | 0.57%(-0.378)#5,570 |
| 40. | Hazardville | 0.18% | 0.51%(-0.330)#40 | 0.57%(-0.386)#5,633 |
| 41. | Cos Cob | 0.17% | 0.51%(-0.344)#41 | 0.57%(-0.400)#5,763 |
| 42. | West Hartford | 0.17% | 0.51%(-0.345)#42 | 0.57%(-0.400)#5,766 |
| 43. | Conning Towers Nautilus Park | 0.14% | 0.51%(-0.366)#43 | 0.57%(-0.421)#5,953 |
| 44. | Greenwich | 0.14% | 0.51%(-0.368)#44 | 0.57%(-0.423)#5,967 |
| 45. | Storrs | 0.14% | 0.51%(-0.374)#45 | 0.57%(-0.429)#6,020 |
| 46. | North Haven | 0.12% | 0.51%(-0.394)#46 | 0.57%(-0.450)#6,232 |
| 47. | Weatogue | 0.11% | 0.51%(-0.398)#47 | 0.57%(-0.453)#6,258 |
| 48. | Windsor Locks | 0.088% | 0.51%(-0.422)#48 | 0.57%(-0.478)#6,498 |
| 49. | Shelton | 0.087% | 0.51%(-0.423)#49 | 0.57%(-0.478)#6,499 |
| 50. | East Haven | 0.075% | 0.51%(-0.435)#50 | 0.57%(-0.490)#6,605 |
| 51. | Meriden | 0.074% | 0.51%(-0.436)#51 | 0.57%(-0.491)#6,612 |
| 52. | Wallingford Center | 0.053% | 0.51%(-0.457)#52 | 0.57%(-0.512)#6,819 |
| 53. | Glastonbury Center | 0.050% | 0.51%(-0.460)#53 | 0.57%(-0.515)#6,843 |
| 54. | Saugatuck | 0.033% | 0.51%(-0.477)#54 | 0.57%(-0.532)#6,998 |
| 55. | Newington | 0.030% | 0.51%(-0.480)#55 | 0.57%(-0.536)#7,032 |
| 56. | Derby | 0.0081% | 0.51%(-0.502)#56 | 0.57%(-0.557)#7,205 |
| 57. | Milford City Balance | 0.0059% | 0.51%(-0.504)#57 | 0.57%(-0.559)#7,225 |
Common Questions
What are the Top 10 Cities with the Highest Percentage of African Population in Connecticut?
Top 10 Cities with the Highest Percentage of African Population in Connecticut are:
#1
8.59%
#2
2.99%
#3
1.87%
#4
1.81%
#5
1.68%
#6
1.35%
#7
1.33%
#8
1.17%
#9
0.99%
#10
0.96%
What city has the Highest Percentage of African Population in Connecticut?
Northwest Harwinton has the Highest Percentage of African Population in Connecticut with 8.59%.
What is the Percentage of African Population in the State of Connecticut?
Percentage of African Population in Connecticut is 0.51%.
What is the Percentage of African Population in the United States?
Percentage of African Population in the United States is 0.57%.