Cities with the Highest Percentage of African Population in Delaware
RELATED REPORTS & OPTIONS
African
Delaware
Compare Cities
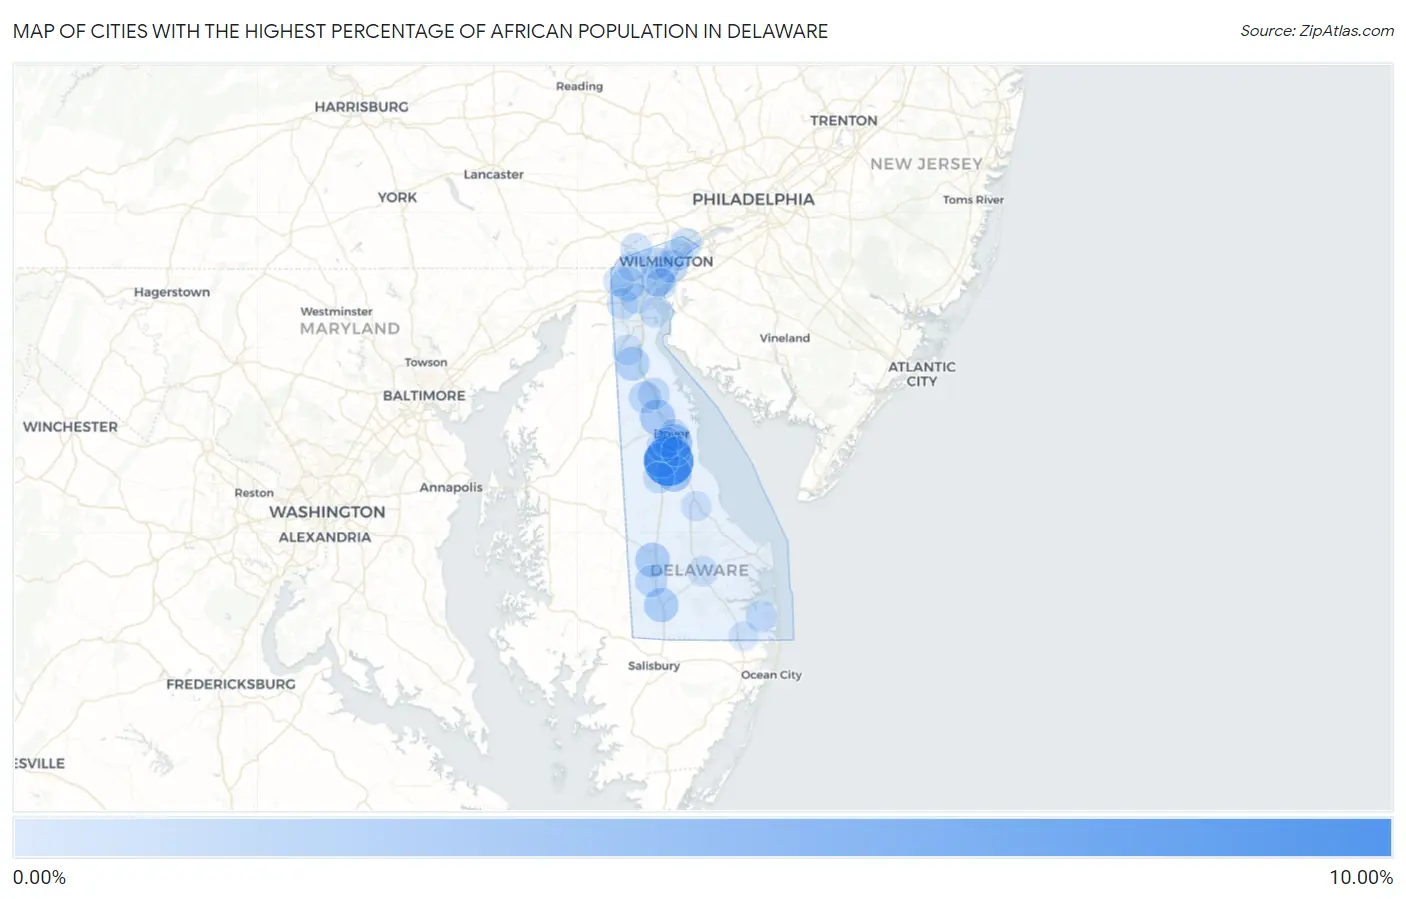
Map of Cities with the Highest Percentage of African Population in Delaware
0.00%
10.00%
Cities with the Highest Percentage of African Population in Delaware
| City | African | vs State | vs National | |
| 1. | Woodside East | 9.04% | 0.77%(+8.27)#1 | 0.57%(+8.48)#119 |
| 2. | Kent Acres | 3.11% | 0.77%(+2.34)#2 | 0.57%(+2.54)#597 |
| 3. | Riverview | 2.69% | 0.77%(+1.92)#3 | 0.57%(+2.12)#718 |
| 4. | Cheswold | 2.50% | 0.77%(+1.74)#4 | 0.57%(+1.94)#785 |
| 5. | Woodside | 2.37% | 0.77%(+1.61)#5 | 0.57%(+1.81)#832 |
| 6. | Bridgeville | 2.08% | 0.77%(+1.32)#6 | 0.57%(+1.52)#979 |
| 7. | Laurel | 1.97% | 0.77%(+1.21)#7 | 0.57%(+1.41)#1,041 |
| 8. | Brookside | 1.86% | 0.77%(+1.09)#8 | 0.57%(+1.29)#1,116 |
| 9. | Townsend | 1.69% | 0.77%(+0.920)#9 | 0.57%(+1.12)#1,239 |
| 10. | Wilmington Manor | 1.45% | 0.77%(+0.687)#10 | 0.57%(+0.887)#1,477 |
| 11. | Wilmington | 1.36% | 0.77%(+0.595)#11 | 0.57%(+0.796)#1,588 |
| 12. | Clayton | 0.96% | 0.77%(+0.189)#12 | 0.57%(+0.390)#2,225 |
| 13. | Seaford | 0.89% | 0.77%(+0.128)#13 | 0.57%(+0.328)#2,357 |
| 14. | Dover | 0.83% | 0.77%(+0.065)#14 | 0.57%(+0.265)#2,506 |
| 15. | Elsmere | 0.81% | 0.77%(+0.041)#15 | 0.57%(+0.242)#2,563 |
| 16. | Smyrna | 0.78% | 0.77%(+0.011)#16 | 0.57%(+0.212)#2,656 |
| 17. | Millville | 0.73% | 0.77%(-0.035)#17 | 0.57%(+0.166)#2,793 |
| 18. | Wyoming | 0.69% | 0.77%(-0.078)#18 | 0.57%(+0.123)#2,921 |
| 19. | Hockessin | 0.64% | 0.77%(-0.125)#19 | 0.57%(+0.076)#3,077 |
| 20. | Felton | 0.62% | 0.77%(-0.150)#20 | 0.57%(+0.051)#3,177 |
| 21. | Bellefonte | 0.59% | 0.77%(-0.176)#21 | 0.57%(+0.024)#3,275 |
| 22. | Claymont | 0.58% | 0.77%(-0.187)#22 | 0.57%(+0.014)#3,321 |
| 23. | Glasgow | 0.56% | 0.77%(-0.201)#23 | 0.57%(-0.001)#3,382 |
| 24. | New Castle | 0.54% | 0.77%(-0.223)#24 | 0.57%(-0.022)#3,465 |
| 25. | Middletown | 0.34% | 0.77%(-0.423)#25 | 0.57%(-0.222)#4,452 |
| 26. | Bear | 0.29% | 0.77%(-0.471)#26 | 0.57%(-0.271)#4,738 |
| 27. | Newark | 0.27% | 0.77%(-0.492)#27 | 0.57%(-0.291)#4,871 |
| 28. | Rodney Village | 0.23% | 0.77%(-0.536)#28 | 0.57%(-0.335)#5,227 |
| 29. | Georgetown | 0.21% | 0.77%(-0.559)#29 | 0.57%(-0.358)#5,412 |
| 30. | Milford | 0.20% | 0.77%(-0.570)#30 | 0.57%(-0.369)#5,489 |
| 31. | Pike Creek Valley | 0.17% | 0.77%(-0.592)#31 | 0.57%(-0.391)#5,683 |
| 32. | Delaware City | 0.10% | 0.77%(-0.663)#32 | 0.57%(-0.462)#6,347 |
| 33. | Selbyville | 0.034% | 0.77%(-0.732)#33 | 0.57%(-0.531)#6,986 |
| 34. | Rising Sun Lebanon | 0.025% | 0.77%(-0.742)#34 | 0.57%(-0.541)#7,077 |
1
Common Questions
What are the Top 10 Cities with the Highest Percentage of African Population in Delaware?
Top 10 Cities with the Highest Percentage of African Population in Delaware are:
#1
9.04%
#2
3.11%
#3
2.69%
#4
2.50%
#5
2.37%
#6
2.08%
#7
1.97%
#8
1.86%
#9
1.69%
#10
1.45%
What city has the Highest Percentage of African Population in Delaware?
Woodside East has the Highest Percentage of African Population in Delaware with 9.04%.
What is the Percentage of African Population in the State of Delaware?
Percentage of African Population in Delaware is 0.77%.
What is the Percentage of African Population in the United States?
Percentage of African Population in the United States is 0.57%.